* Corresponding * Corresponding * Corresponding
* Corresponding AAAAuthor, Tel: +234uthor, Tel: +234uthor, Tel: +234----803uthor, Tel: +234803803803
MODELING OF
MODELING OF
MODELING OF
MODELING OF RESERVOIR IN
RESERVOIR IN
RESERVOIR IN
RESERVOIR IN
ARTIFICIAL NEURAL NETWORK
ARTIFICIAL NEURAL NETWORK
ARTIFICIAL NEURAL NETWORK
ARTIFICIAL NEURAL NETWORK
A.
A.
A.
A. W. Salami
W. Salami
W. Salami
W. Salami
1111, A. A. Mohammed
, A. A. Mohammed
, A. A. Mohammed
, A. A. Mohammed
1 11
1 ,4,4,4,4DEPARTMENT OF C 2
22
2 NATIONAL CENTRE FOR HYDROPOWER
3 33
3 DEPT. OF CIVIL ENGINEERING AND SURVEYING
E EE
E----mail mail mail mail AAAddresses:Addresses:ddresses:ddresses: 1111awsalami2009@gmail.com
ABSTRACT ABSTRACT ABSTRACT ABSTRACT The stream flow The stream flow The stream flow
The stream flow atatat the three hydropower reservoirs in Nigeria were at the three hydropower reservoirs in Nigeria were the three hydropower reservoirs in Nigeria were the three hydropower reservoirs in Nigeria were parameters
parameters parameters
parameters andandandand AAAArtificial rtificial rtificial rtificial NNNNeural Network (ANN)eural Network (ANN)eural Network (ANN)eural Network (ANN) and
and and
and the the the the modeled reservoir inflowmodeled reservoir inflowmodeled reservoir inflowmodeled reservoir inflow with values of correlation coefficient of 0.57, 0.84 and 0.92 for Kainji, Jebba and with values of correlation coefficient of 0.57, 0.84 and 0.92 for Kainji, Jebba and with values of correlation coefficient of 0.57, 0.84 and 0.92 for Kainji, Jebba and with values of correlation coefficient of 0.57, 0.84 and 0.92 for Kainji, Jebba and Shiroro hydropower reservoir respectively.
Shiroro hydropower reservoir respectively. Shiroro hydropower reservoir respectively. Shiroro hydropower reservoir respectively. each of the hydropower reservoir
each of the hydropower reservoir each of the hydropower reservoir
each of the hydropower reservoirssss which werewhich werewhich werewhich were predict
predict predict
predicted reservoir inflow were ed reservoir inflow were ed reservoir inflow were subjected to trend analysised reservoir inflow were subjected to trend analysissubjected to trend analysissubjected to trend analysis inc
inc inc
increase rease rease rease of of of of 4.54.584.54.5888%%%%, 6.34% and 5.42% for Kainji, Jebba and Shiroro, 6.34% and 5.42% for Kainji, Jebba and Shiroro, 6.34% and 5.42% for Kainji, Jebba and Shiroro, 6.34% and 5.42% for Kainji, Jebba and Shiroro trend
trend trend
trend is is is an indicationis an indicationan indicationan indication of increase in water availability for hydropower generation at the three stations given other of increase in water availability for hydropower generation at the three stations given other of increase in water availability for hydropower generation at the three stations given other of increase in water availability for hydropower generation at the three stations given other constraints are
constraints are constraints are
constraints are brought under controlbrought under controlbrought under control.... brought under control
K K K
Keywordseywordseywordseywords: Reservoir inflow, Hydropower dams, Hydro Hydrologic process
1. 1. 1.
1. INTRODUCTION INTRODUCTION INTRODUCTION INTRODUCTION
Water Resources data need correct measurement, analysis and reliable estimates for future planning and current operations for its purposes such as: drinking water, irrigation and energy production [1] Forecasting streamflow is an important task since it can help in short term operation of water resources systems as well as providing early warning of river flooding. Accurate and reliable forecasts of catchment runoff are crucial for successful management of water resources are particularly important in the occurrence of hydrological extremes such as floods and droughts. Accurate and timely inflow forecasting is crucial for effective hydropower reservoir operati
prevention because it can provide an extension of lead-time of the inflow into the reservoir forecas [2].
The need for this study cannot be over
adequate inflow data modeling and forecasting is very essential for proper operation, optimization and maintenance of hydropower system. The study was
803 803 803
803----716716716----1336716133613361336
RESERVOIR IN
RESERVOIR IN
RESERVOIR IN
RESERVOIR INFLOW FOR HYDROPOWER
FLOW FOR HYDROPOWER
FLOW FOR HYDROPOWER
FLOW FOR HYDROPOWER
ARTIFICIAL NEURAL NETWORK
ARTIFICIAL NEURAL NETWORK
ARTIFICIAL NEURAL NETWORK
ARTIFICIAL NEURAL NETWORK
, A. A. Mohammed
, A. A. Mohammed
, A. A. Mohammed
, A. A. Mohammed
2,2,2,2,****, J. A. Adeyemo
, J. A. Adeyemo
, J. A. Adeyemo
, J. A. Adeyemo
3333and O. K. Olanlokun
and O. K. Olanlokun
and O. K. Olanlokun
and O. K. Olanlokun
CIVIL ENGINEERING,UNIVERSITY OF ILORIN,ILORIN,N
YDROPOWER RESEARCH AND DEVELOPMENT,UNIVERSITY OF ILORIN URVEYING,DURBAN UNIVERSITY OF TECHNOLOGY,DURBAN
awsalami2009@gmail.com, 2222rasaq.muhammed@yahoo.com, 3333josiaha@dut.ac.za 4
44
4yemilokun@yahoo.co.uk
the three hydropower reservoirs in Nigeria were the three hydropower reservoirs in Nigeria were the three hydropower reservoirs in Nigeria were
the three hydropower reservoirs in Nigeria were modelmodelmodelmodelededed usinged usingusingusing eural Network (ANN)
eural Network (ANN)eural Network (ANN)
eural Network (ANN). . . . The model revealed positive relationship between the The model revealed positive relationship between the The model revealed positive relationship between the The model revealed positive relationship between the
with values of correlation coefficient of 0.57, 0.84 and 0.92 for Kainji, Jebba and with values of correlation coefficient of 0.57, 0.84 and 0.92 for Kainji, Jebba and with values of correlation coefficient of 0.57, 0.84 and 0.92 for Kainji, Jebba and with values of correlation coefficient of 0.57, 0.84 and 0.92 for Kainji, Jebba and Shiroro hydropower reservoir respectively.
Shiroro hydropower reservoir respectively. Shiroro hydropower reservoir respectively.
Shiroro hydropower reservoir respectively. TheTheTheThe establishedestablishedestablishedestablished model model model was used to model was used to was used to predictwas used to predictpredictpredict which were
which were which were
which were found to have sifound to have sifound to have sifound to have similar statistics with the observed values. The milar statistics with the observed values. The milar statistics with the observed values. The milar statistics with the observed values. The subjected to trend analysis
subjected to trend analysissubjected to trend analysis
subjected to trend analysis which revealed which revealed which revealed which revealed an an an upward trend with an upward trend with upward trend with upward trend with , 6.34% and 5.42% for Kainji, Jebba and Shiroro
, 6.34% and 5.42% for Kainji, Jebba and Shiroro, 6.34% and 5.42% for Kainji, Jebba and Shiroro
, 6.34% and 5.42% for Kainji, Jebba and Shiroro hydropower reservoirshydropower reservoirshydropower reservoirshydropower reservoirs
of increase in water availability for hydropower generation at the three stations given other of increase in water availability for hydropower generation at the three stations given other of increase in water availability for hydropower generation at the three stations given other of increase in water availability for hydropower generation at the three stations given other
: Reservoir inflow, Hydropower dams, Hydro-meteorological variables, Artificial Neura
Water Resources data need correct measurement, analysis and reliable estimates for future planning and current operations for its purposes such as: drinking production [1]. Forecasting streamflow is an important task since it can help in short term operation of water resources systems as well as providing early warning of river Accurate and reliable forecasts of catchment runoff are crucial for successful management of water resources are particularly important in the occurrence of hydrological extremes such as floods and droughts. Accurate and timely inflow forecasting is crucial for effective hydropower reservoir operation and flooding prevention because it can provide an extension of time of the inflow into the reservoir forecasting The need for this study cannot be over-emphasised, adequate inflow data modeling and forecasting is very ation, optimization and maintenance of hydropower system. The study was
carried out to sensitize the stakeholders at the three hydropower stations in Nigeria on the likely volume of future inflow into their reservoirs for effective planning. The study aims
inflow to hydropower dams in Nigeria for effective planning and management. The objectives of the study are: to collect hydro-meteorological parameters from the hydropower stations, to model reservoir inflows, calibrate and validate the model and forecast the future inflow into the reservoirs.
The general difficulty associated with streamflow forecasting is the non-linear and non
characteristics which are often encountered inmost streamflow time series data. Artifici
(ANN) models are considered as a category of the data-driven techniques, have been widely used in streamflow forecasting. Several distinguishing features of ANN models make them valuable and attractive for forecasting tasks. First, there
priori assumptions about the models as opposed to model-driven techniques. They learn from examples
Nigerian Journal of Technology (NIJOTECH)
Vol. 34 No. 1, January 2015, pp. Copyright© Faculty of Engineering, University of Nigeria, Nsukka, ISSN: 1115
http://dx.doi.org/10.4314/njt.v34i1.4
FLOW FOR HYDROPOWER
FLOW FOR HYDROPOWER
FLOW FOR HYDROPOWER
FLOW FOR HYDROPOWER DAMS
DAMS
DAMS
DAMS USING
USING
USING
USING
and O. K. Olanlokun
and O. K. Olanlokun
and O. K. Olanlokun
and O. K. Olanlokun
4444NIGERIA
LORIN,ILORIN,NIGERIA
URBAN,SOUTHAFRICA.
josiaha@dut.ac.za,,,,
using using using
using hydrohydrohydro----meteorological hydrometeorological meteorological meteorological The model revealed positive relationship between the
The model revealed positive relationship between the The model revealed positive relationship between the
The model revealed positive relationship between the observed observed observed observed with values of correlation coefficient of 0.57, 0.84 and 0.92 for Kainji, Jebba and with values of correlation coefficient of 0.57, 0.84 and 0.92 for Kainji, Jebba and with values of correlation coefficient of 0.57, 0.84 and 0.92 for Kainji, Jebba and with values of correlation coefficient of 0.57, 0.84 and 0.92 for Kainji, Jebba and
predict predict predict
predict 20 years stream20 years stream20 years stream20 years stream----flow for flow for flow for flow for milar statistics with the observed values. The milar statistics with the observed values. The milar statistics with the observed values. The milar statistics with the observed values. The
upward trend with upward trend with upward trend with
upward trend with percentage percentage percentage percentage hydropower reservoirs
hydropower reservoirs hydropower reservoirs
hydropower reservoirs respectivelyrespectivelyrespectively. . . . The upward respectively The upward The upward The upward of increase in water availability for hydropower generation at the three stations given other of increase in water availability for hydropower generation at the three stations given other of increase in water availability for hydropower generation at the three stations given other of increase in water availability for hydropower generation at the three stations given other
Artificial Neural Network and
carried out to sensitize the stakeholders at the three hydropower stations in Nigeria on the likely volume of future inflow into their reservoirs for effective at modeling the reservoir inflow to hydropower dams in Nigeria for effective planning and management. The objectives of the study meteorological parameters from the hydropower stations, to model reservoir inflows, ate the model and forecast the future inflow into the reservoirs.
The general difficulty associated with streamflow linear and non-stationary characteristics which are often encountered inmost streamflow time series data. Artificial neural networks (ANN) models are considered as a category of the driven techniques, have been widely used in streamflow forecasting. Several distinguishing features of ANN models make them valuable and attractive for forecasting tasks. First, there are few a priori assumptions about the models as opposed to driven techniques. They learn from examples
Nigerian Journal of Technology (NIJOTECH)
Vol. 34 No. 1, January 2015, pp. 28 – 36
Copyright© Faculty of Engineering, University of Nigeria, Nsukka, ISSN: 1115-8443 www.nijotech.com
Nigerian Journal of Technology, Nigerian Journal of Technology, Nigerian Journal of Technology,
Nigerian Journal of Technology, Vol. 34, No. 1, January 2015Vol. 34, No. 1, January 2015Vol. 34, No. 1, January 2015Vol. 34, No. 1, January 2015
29
29
29
29
and capture the functional relationships among thedata even if the underlying relationships are too complex to specify [3].
Artificial neural network (ANN) has been widely applied in modeling of many nonlinear hydrologic processes such as numerical weather and global climate model [4], rainfall-runoff model [5] and [6], stream flow model [7], [8] and [9], precipitation prediction [10] and [11], rainfall modeling [12], [13] and [14] and simulation of daily temperature [15]. ANN have been trained to perform complex functions in various fields, including pattern recognition, identification, traffic prediction, classification, speech, vision and control systems [16]. According to Khaing andThinn among forty eight (48) studies conducted using ANN between 1988 and 1994, it was found that neural network models produced superior predictions [11]. Adya and Collopy reviewed effectiveness of ANN in forecasting and predicting flow. They stated that effectively implemented and validated, ANN out-performed all comparative methods such as linear regression, stepwise polynomial regression, multiple regression, discriminant analysis, logic models and rule-based system [17].
Dibike and Solomatine studied the river flow forecasting using ANN model in the Apure river basin in Venezuela. Two types of ANN architectures namely multilayer perceptron network (MLP) and radial basis function networks (RBF) were implemented. The data used for the analysis are weekly precipitation, evapotranspiration and runoff for the period of five years. The result revealed that the model was found to be slightly better for river flow forecasting problem [18]. Solaimani assessed the rainfall-runoff prediction based on ANN in Jarahi Watershed in Iran. The study was aimed at modeling the rainfall-runoff relationship in the catchment area. The results indicated that the ANN model is appropriate and efficient to predict the river runoff [19]. Kothyari estimated mean annual flood from ungauged catchments with mean annual flood and average rainfall value for two year return period using ANN model. Two ANN model architectures: multilayer perceptron architecture, in which back propagation algorithms (BPANN) were used and the cascade correlation architecture (CCANN) were used to evaluate performance of ANNs in estimating reference evapotranspiration with minimal meteorological data [20]. Diamantopoulou et al stated that ANNs have shown great ability in modeling and forecasting linear and non-stationary time series [21]. ANN model in most cases
especially in drought prediction have showed very good performance [22].
Jeong and Kim assessed rainfall-runoff for ensemble streamflow prediction using two types of ANN, namely the single neural network (SNN) and the ensemble neural network (ENN), to provide better rainfall-runoff simulation capability. The overall results showed that the ENN performed better than the SNN in modeling rainfall-runoff [23]. Pulido-Calvo et al carried out study on water resources management in the Guadalquivir River Basin, Southern Spain using ANN model to simulate the inflow and outflow in a water resources system under shortage of water. Hydro-meteorological data from various gauging stations were used in this study. Weekly data were used for the analysis for the period of eight years. Data of six years were used for model calibration and the remaining two years data were used for the validation. The results demonstrated that the neural approach approximated the behaviour of various components of the water resources system in terms of various hydrologic cycle processes and management rules [24]. Demirel and Booij studied the identification of an appropriate low flow forecast model for the Meuse River in Netherlands based on the comparison of output uncertainties of different models. Three models were developed for the Meuse River such as multivariate, linear regression and ANN models. The uncertainty in the three models was assumed to be represented by the difference between observed and simulated discharge. The data used for the study were discharge, precipitation and evapotranspiration for thirty years (1968-1998). Twenty years data was used for the model calibration while ten years data was used for validation of the result. The results obtained using ANN model revealed that the low flow forecast model performed slightly better than the other statistical models in forecasting low flows for a lead time of seven days [25]. This study provided basis that was adopted in this study.
Nigerian Journal of Technology, Nigerian Journal of Technology, Nigerian Journal of Technology,
Nigerian Journal of Technology, Vol. 34, No. 1, January 2015Vol. 34, No. 1, January 2015Vol. 34, No. 1, January 2015Vol. 34, No. 1, January 2015
30
30
30
30
model using parameters obtained from calibrating themeasured flows. The artificial flows were then used to replace the original flows in the calibration data, which was then used for testing how calibration procedures can reproduce known model parameters. The results showed that in performing one hundred independent calibration runs of the HBV model, it was observed that the obtained parameters were almost identical to those used to create the artificial flow data without a certain degree of uncertainty [26].
The aim of this paper is to present the modelling of the reservoir inflow at the Kainji, Jebba and Shiroro hydropower reservoirs based on hydro-meteorological parameters using Artificial Neural Networks for forecasting purposes. The Kainji and Jebba hydropower dams were constructed across the River Niger in 1968 and 1984 respectively, while Shiroro hydropower dam was constructed across River Kaduna in 1990. The installed capacity is 760 MW, 540 MW and 600 MW for Kainji, Jebba and Shiroro respectively. River Niger is divided into upper Niger, middle Niger and lower Niger. The power stations are located in the middle Niger in Nigeria. 2.
2. 2.
2. MATERIALS AND METHODSMATERIALS AND METHODSMATERIALS AND METHODSMATERIALS AND METHODS 2.1
2.1 2.1
2.1 Data collectionData collectionData collectionData collection
The data required for this study are hydro-meteorological data which were obtained for a period of 20-42 years from the hydrologic section of the three hydropower dams in Nigeria. The data include precipitation (mm), evaporation, temperature (°C) and reservoir inflow (m3/s) for the three hydropower
reservoirs in Nigeria. The missing hydro-meteorological data were supplied using statistical methods [27].Table 1 shows three hydropower stations and year of available hydro-meteorological data.
2.2 Data analysis 2.2 Data analysis 2.2 Data analysis 2.2 Data analysis
Artificial Neural Network (ANN) was used to model reservoir inflow as a function of meteorological parameters such as precipitation, temperature and evaporation. That is, the input variables are: precipitation, temperature and evaporation while, the output variable is reservoir inflow at the three hydropower reservoirs. The ANN model in the ‘Alyuda forecaster XL’ softwares was used for the analysis. The model was trained (calibrated), validated and tested with the available hydro-meteorological parameters in the selected stations using error back propagation algorithm in order to speed up its convergence to a minimum error [28].
3. 3. 3.
3. RESULTS AND DISCUSSIONRESULTS AND DISCUSSIONRESULTS AND DISCUSSIONRESULTS AND DISCUSSION
The ANN model for Kainji was trained with 30 years hydro-meteorological data (1970-1999), Jebba was trained with 20 years hydro-meteorological data (1984-2007) and Shiroro was trained with 14 years hydro-meteorological data (1990-2003). In validating the ANN model for Kainji, seven years hydro-meteorological data (2000-2006) was used, while 4 years hydro-meteorological data (2004-2007) was used to validate those of Jebba and Shiroro. However, for the model testing, five years hydro-meteorological data (2007-2011) was used for Kainji, while Jebba and Shiroro were tested with 4 years hydro-meteorological data (2008-2011).
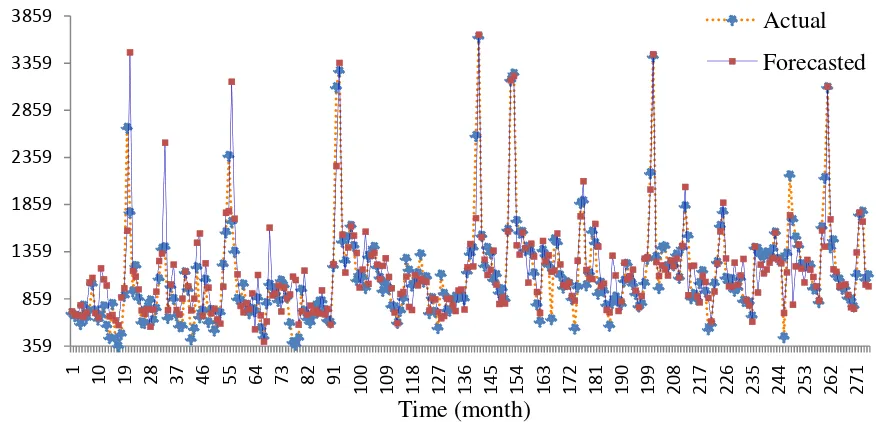
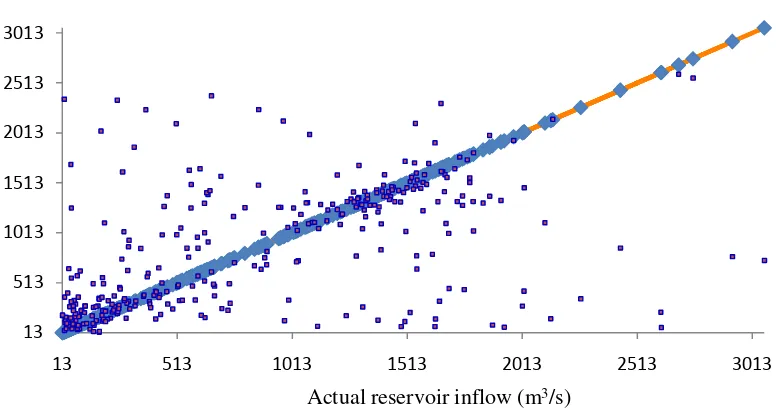
The summaries of ANN model analyses for the hydro-meteorological parameters at the selected locations are presented in the Tables 2 to 4, while the comparison between the actual and forecasted reservoir inflow is depicted in Figure 1 to 3 for Kainji, Jebba and Shiroro respectively. Also Figures 4 to 6 depict the linearity between the actual and forecasted reservoir inflow for Kainji, Jebba and Shiroro respectively.
Table 1.Hydropower reservoirs and geographical location of study areas
River Location Year of record Coordinate
Latitude (oN) Longitude (oE)
Niger Kainji 1970-2011 9o 50ꞌ 4o 40ꞌ
Niger Jebba 1984-2011 9o 08ꞌ 4o 49 ꞌ
Kaduna Shiroro 1990-2011 9 o 58ꞌ 25ꞌꞌ 6 o 50 ꞌ 6ꞌꞌ
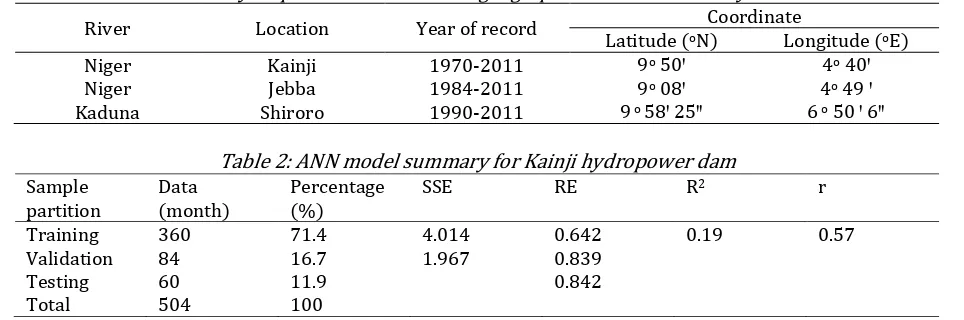
Table 2: ANN model summary for Kainji hydropower dam
Sample partition
Data (month)
Percentage (%)
SSE RE R2 r
Training 360 71.4 4.014 0.642 0.19 0.57
Validation 84 16.7 1.967 0.839
Testing 60 11.9 0.842
Nigerian Journal of Technology, Nigerian Journal of Technology, Nigerian Journal of Technology,
Nigerian Journal of Technology, Vol. 34, No. 1, January 2015Vol. 34, No. 1, January 2015Vol. 34, No. 1, January 2015Vol. 34, No. 1, January 2015
31
31
31
31
Table 3: ANN model summary for Jebba hydropower damSample partition Data (month) Percentage (%)
SSE RE R2 r
Training 240 71.4 94.93 0.999 0.67 0.84
Validation 48 14.3 32.79 0.973
Testing 48 14.3 0.997
Total 336 100
Table 4: ANN model summary for Shiroro hydropower dam Sample partition Data (month) Percentage (%)
SSE RE R2 r
Training 168 63.4 32.53 0.392 0.85 0.92
Validation 48 18.3 8.60 0.417
Testing 48 18.3 0.294
Total 264 100
Key: SSE = Sum of square error, RE = Relative error R2 = Coefficient of determination
r = Correlation coefficient
13 513 1013 1513 2013 2513 3013 3513 1 1 2 2 3 3 4 4 5 5 6 6 7 7 8 8 9 1 0 0 1 1 1 1 2 2 1 3 3 1 4 4 1 5 5 1 6 6 1 7 7 1 8 8 1 9 9 2 1 0 2 2 1 2 3 2 2 4 3 2 5 4 2 6 5 2 7 6 2 8 7 2 9 8 3 0 9 3 2 0 3 3 1 3 4 2
R
e
se
rvoi
r i
nf
low
(
m
3/s
)
Time (month)
Actual
Forecasted
Figure 1: Actual and forecasted reservoir inflow for Kainji
359 859 1359 1859 2359 2859 3359 3859 1 1 0 1 9 2 8 3 7 4 6 5 5 6 4 7 3 8 2 9 1 1 0 0 1 0 9 1 1 8 1 2 7 1 3 6 1 4 5 1 5 4 1 6 3 1 7 2 1 8 1 1 9 0 1 9 9 2 0 8 2 1 7 2 2 6 2 3 5 2 4 4 2 5 3 2 6 2 2 7 1
R
e
se
rvoi
r i
nf
low
(
m
3/s
)
Time (month)
Actual
Forecasted
Nigerian Journal of Technology, Nigerian Journal of Technology, Nigerian Journal of Technology,
Nigerian Journal of Technology, Vol. 34, No. 1, January 2015Vol. 34, No. 1, January 2015Vol. 34, No. 1, January 2015Vol. 34, No. 1, January 2015
32
32
32
32
9.9 209.9 409.9 609.9 809.9 1009.9 1209.9 1409.9 1609.9 1809.9 2009.9
1
1
1
2
1
3
1
4
1
5
1
6
1
7
1
8
1
9
1
1
0
1
1
1
1
1
2
1
1
3
1
1
4
1
1
5
1
1
6
1
1
7
1
1
8
1
1
9
1
2
0
1
2
1
1
2
2
1
2
3
1
R
e
se
rvoi
r i
nf
low
(
m
3
/s
)
Time (month)
Actual
Forecasted
Figure 3: Actual and forecasted reservoir inflow for Shiroro
13 513 1013 1513 2013 2513 3013
13 513 1013 1513 2013 2513 3013
F
or
e
c
a
st
e
d
re
se
rvoi
r
inf
low
(
m
3
/s
)
Actual reservoir inflow (m3/s)
Figure 4: Scatter plot of forecasted and actual reservoir inflow for Kainji
359 859 1359 1859 2359 2859 3359
359 859 1359 1859 2359 2859 3359
F
or
e
c
a
st
e
d
re
se
rvoi
r
inf
low
(
m
3
/s
)
Actual reservoir inflow (m3/s)
Nigerian Journal of Technology, Nigerian Journal of Technology, Nigerian Journal of Technology,
Nigerian Journal of Technology, Vol. 34, No. 1, January 2015Vol. 34, No. 1, January 2015Vol. 34, No. 1, January 2015Vol. 34, No. 1, January 2015
33
33
33
33
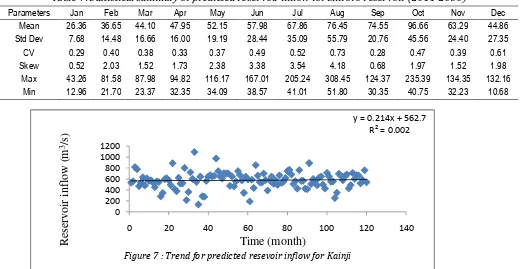
Table 5: Statistical summary of predicted reservoir inflow for Kainji reservoir (2011-2030)Parameters Jan Feb Mar Apr May Jun Jul Aug Sep Oct Nov Dec
Mean 300.29 396.75 463.33 516.41 568.76 599.03 613.46 664.23 738.94 856.35 596.92 558.97
Std Dev 121.96 77.70 63.26 49.04 78.91 62.73 56.23 67.66 91.12 134.48 51.56 51.40
CV 0.41 0.20 0.14 0.09 0.14 0.10 0.09 0.10 0.12 0.16 0.09 0.09
Skew -0.12 -0.44 -0.24 0.81 1.58 0.42 -0.90 -0.54 0.60 0.96 -0.62 -1.01
Max 491.86 512.20 564.97 640.99 812.98 757.04 706.00 802.92 987.87 1185.1 668.65 642.54 Min 68.92 214.86 337.25 448.66 462.91 465.89 485.09 508.08 542.66 687.21 485.66 415.38
Table 6: Statistical summary of predicted reservoir inflow for Jebba reservoir (2011-2030)
Parameters Jan Feb Mar Apr May Jun Jul Aug Sep Oct Nov Dec
Mean 1168.0 1156.8 1182.9 1162.1 1219.5 1140.1 1189.0 1125.7 1137.8 1172.6 1163.7 1149.6 Std Dev 161.17 129.06 179.74 104.39 159.59 149.16 110.04 83.85 133.39 200.32 171.44 129.80
CV 0.14 0.11 0.15 0.09 0.13 0.13 0.09 0.07 0.12 0.17 0.15 0.11
Skew 0.57 1.83 0.49 0.48 0.15 0.53 0.27 0.19 -0.50 -0.01 0.13 0.33
Max 1622.4 1568.4 1548.6 1373.4 1572.9 1473.6 1454.2 1286.3 1354.2 1619.2 1576.3 1407.6 Min 818.11 959.73 932.25 993.54 864.84 837.65 994.59 971.17 819.63 765.12 818.34 973.20
Table 7: Statistical summary of predicted reservoir inflow for Shiroro reservoir (2011-2030)
Parameters Jan Feb Mar Apr May Jun Jul Aug Sep Oct Nov Dec
Mean 26.36 36.65 44.10 47.95 52.15 57.98 67.86 76.45 74.55 96.66 63.29 44.86
Std Dev 7.68 14.48 16.66 16.00 19.19 28.44 35.09 55.79 20.76 45.56 24.40 27.35
CV 0.29 0.40 0.38 0.33 0.37 0.49 0.52 0.73 0.28 0.47 0.39 0.61
Skew 0.52 2.03 1.52 1.73 2.38 3.38 3.54 4.18 0.68 1.97 1.52 1.98
Max 43.26 81.58 87.98 94.82 116.17 167.01 205.24 308.45 124.37 235.39 134.35 132.16
Min 12.96 21.70 23.37 32.35 34.09 38.57 41.01 51.80 30.35 40.75 32.23 10.68
9.9 209.9 409.9 609.9 809.9 1009.9 1209.9 1409.9 1609.9
9.9 509.9 1009.9 1509.9
F
or
e
c
a
st
e
d
re
se
rvoi
r
inf
low
(
m
3
/s
)
Actual reservoir inflow (m3/s)
Figure 6: Scatter plot of forecasted and actual reservoir inflow for Shiroro
y = 0.214x + 562.7 R² = 0.002
0 200 400 600 800 1000 1200
0 20 40 60 80 100 120 140
R
e
se
rvoi
r i
nf
low
(
m
3
/s
)
Time (month)
Nigerian Journal of Technology, Nigerian Journal of Technology, Nigerian Journal of Technology,
Nigerian Journal of Technology, Vol. 34, No. 1, January 2015Vol. 34, No. 1, January 2015Vol. 34, No. 1, January 2015Vol. 34, No. 1, January 2015
34
34
34
34
3.1 Prediction of Reservoir Inflows 3.1 Prediction of Reservoir Inflows 3.1 Prediction of Reservoir Inflows 3.1 Prediction of Reservoir Inflows
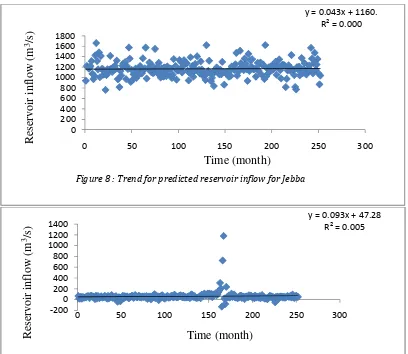
The trained and tested ANN model was used to predict the monthly runoff for Kainji, Jebba and Shiroro from year 2011-2030. The statistical summary of the predicted reservoir inflow are presented in Table 5 to 7 for Kainji, Jebba and Shiroro hydropower dams respectively. The mean values of the predicted monthly runoff data were subjected to trend analysis to show the trend pattern in the locations. Figures 7 to 9 depict the trend pattern for the predicted reservoir inflow at Kainji, Jebba and Shiroro stations respectively. In order to determine the percentage variation of the predicted reservoir inflow, the mean annual predicted inflow was subjected to percentage variation and the estimated variations are +4.58%, +6.34% and +5.42% for Kainji, Jebba and Shiroro respectively.
The hydropower reservoirs and their geographical location were presented in Table 1. The result of the statistical summary for ANN model was presented in Table 2 to 4, while the statistical summary of the forecasted reservoir inflow was presented in Tables 5 to 7 for Kainji, Jebba and Shiroro hydropower
reservoir respectively. Moreover, the variation of the actual and forecasted reservoir inflow with time was presented in Figures 1 to 3, while the linear relationship between the actual and the forecasted reservoir inflow was depicted in Figures 4 to 6 for Kainji, Jebba and Shiroro hydropower reservoir respectively. The trend of the forecasted reservoir inflow was also depicted in Figure 7 to 9 in order to detect the nature of the trend.
The summaries of the ANN model results show the percentage of data used for model calibration, validation and testing, sum of square error (SSE) and relative error (RE). The results for Kainji show that about 71%, 17% and 12% of the data were used for ANN model training, validation and testing respectively. The SSE for training data at Kainji station is 4.014 and its RE is 0.642 while its validation has SSE of 1.967, RE of 0.839 and the testing has RE of 0.842. R2 and r were 0.19 and 0.57 respectively which
revealed a positive relationship between the actual and the forecasted reservoir inflow for Kainji. The results for Jebba show that about 72%, 14% and 14 % respectively were used for calibration, validation and
y = 0.043x + 1160. R² = 0.000
0 200 400 600 800 1000 1200 1400 1600 1800
0 50 100 150 200 250 300
R
e
se
rvoi
r i
nf
low
(
m
3
/s
)
Time (month)
Figure 8 : Trend for predicted reservoir inflow for Jebba
y = 0.093x + 47.28 R² = 0.005
-200 0 200 400 600 800 1000 1200 1400
0 50 100 150 200 250 300
R
e
se
rvoi
r i
nf
low
(
m
3
/s
)
Time (month)
Nigerian Journal of Technology, Nigerian Journal of Technology, Nigerian Journal of Technology,
Nigerian Journal of Technology, Vol. 34, No. 1, January 2015Vol. 34, No. 1, January 2015Vol. 34, No. 1, January 2015Vol. 34, No. 1, January 2015
35
35
35
35
testing. The SSE for the training data at Jebba station is94.931 and its RE is 0.999 while its validation has SSE of 32.793 and RE of 0.973 and the testing has RE of 0.997, R2 and r were 0.67 and 0.84 respectively which
revealed a positive relationship between the actual and the forecasted reservoir inflow for Jebba. The results for Shiroro show that about 64%, 18% and 18 % respectively were used for calibration, validation and testing, while the SSE for the training data at Shiroro station is 32.524 and its RE is 0.392 while its validation has SSE of 8.602 and RE of 0.417 and the testing has RE of 0.294. R2 and r were 0.85 and 0.92
respectively which depict a positive relationship between the actual and the forecasted reservoir inflow for Shiroro. The correlations (r) for the three stations are all above 0.5; this implies that the results obtained for the stations are adequate for effective forecasting of reservoir inflow. The forecasted mean monthly reservoir inflow indicated an upward trend in all the three hydropower reservoirs. The scientific implication of the model results for the three hydropower stations in Nigeria revealed that there will be more inflow water into the hydropower reservoirs. All things being equal more power will be generated to the national grid which will boost power supply in the country provided the water is adequately harnessed. There is need for adequate reservoir operation to prevent the people at downstream from being flooded.
4. CONCLUSION 4. CONCLUSION 4. CONCLUSION 4. CONCLUSION
The ANN model results revealed that there was positive relationship between the actual and forecasted reservoir inflow with fairly high value of correlation coefficient for all the selected locations in the study area. This shows that the model is appropriate for the reservoir inflow modeling. The predicted reservoir inflow at Kainji, Jebba and Shiroro have upward trend, which indicate an increase inflow into the reservoirs in the near future. This will ensure more water for hydropower generation at the stations; however risk of flooding at stations is envisaged. Therefore, there is need for effective hydropower operation, planning and management in order to take adequate measures in tackling the envisaged challenges of flood.
5. REFERENCES 5. REFERENCES 5. REFERENCES 5. REFERENCES
[1] Aslihan, A. Burak, B. and Bihrat, Ö. “Data Generation for Murat River with Artificial Neural Networks”,
Water and Geoscience. 2010, ISSN: 1790-5095. pp. 73-77.
[2] de Vos, N. J. and Rientjes, T. H. M. “Multiobjective Training of Artificial Neural Networks for Rainfall-Runoff Modeling”, Water Resour. Res., 2008, 44, W08434, doi:10.1029/2007WR006734.
[3] Tran, H. D. Muttil, N. and B. J. Perera, C. (2011) “Investigation of Artificial Neural Network Models for Streamflow Forecasting”. 19th International
Congress on Modelling and Simulation, Perth, Australia. pp. 1099-1105.
[4] Kang, B. and Ramerez, J. A. “Use of Artificial Neural Network for Regionalizing Numerical Weather Prediction and Global Climate Model”, 8th
International Workshop on Precipitation in Urban Areas, St. Moritz, Switzerland, 2009, pp. 139 – 143. [5] Hsu, K., Gupta, H. V. and Sorooshian, S. “Artificial
Neural Network Modeling of the Rainfall - Runoff Process”, Water Resources, Res., Vol. 31, Number10, 1995, pp. 2517-2530.
[6] Shamseldin, A. Y. “Application of a Neural Network Technique to Rainfall-Runoff Modeling”, J. of Hydrol., 199, 1997, pp. 272–294.
[7] Zealand, C. M., Burn, D. H. and Simonovic, S. P. “Short-term Streamflow Forecasting Using Artificial Neural Networks”, J. of Hydrol., 214, 1999, pp. 32–48. [8] Modarres, R. “Multi-Criteria Validation of Artificial
Neural Network Rainfall–Runoff Modeling”, Hydrol. Earth Syst. Sci. Discuss., 5, 2008, pp. 3449 – 3477. [9] Karim, S. “Rainfall-Runoff Prediction Based on
Artificial Neural Network: A Case Study: Jarahi Watershed”, American-Eurasian J. Agric. & Environ. Sci., Vol. 5 Number 6, 2009, pp. 856-865.
[10] Kevin, L. C. “Precipitation Prediction Using Artificial Neural Networks”, M. Sc. Thesis Submitted to the Graduate Faculty of The University of Georgia, Republic of Georgia, 2008.
[11] Khaing, W. M. and Thinn, T. N. “Optimum Neural Network Architecture for Precipitation Prediction of Myanmar”, World Academy of Science, Engineering and Technology, 48, 2008, pp. 130-134. [12] Sunyoung, L., Sungzoon, C. and Patrick, M. W. “Rainfall Prediction Using Artificial Neural Networks”, Journal of Geographic Information and Decision Analysis, Vol. 2, Number 2, (1998) pp. 233-242.
[13] Hung, N. Q., Babel, M. S., Weesakul, S. and Tripathi, N. K. “An Artificial Neural Network Model for Rainfall Forecasting in Bangkok, Thailand”, Hydrol. Earth Syst. Sci. Discuss., Vol. 5, pp. 2008, 183-218.
Nigerian Journal of Technology, Nigerian Journal of Technology, Nigerian Journal of Technology,
Nigerian Journal of Technology, Vol. 34, No. 1, January 2015Vol. 34, No. 1, January 2015Vol. 34, No. 1, January 2015Vol. 34, No. 1, January 2015
36
36
36
36
Geophys. Union, Vol. 10, Number. 2, 2006, pp.141-151.
[15] Ricardo, M. T. and Jean, P. P. “Simulation of Daily Temperature for Climate Change Scenarios over Portugal: A Neural Network Model Approach”, Climate Research, Vol. 13, 1999, pp. 45-59.
[16] Orosun, R. O. and Adamu, S. S. “Neural Network Based Model of an Industrial Oil-Fired Boiler”. Nigerian Journal of Technology (NIJOTECH) Vol. 33, Number. 3, 2014, pp. 293– 303.
[17] Adya, M. and Collopy, F. “How Effective are Neural Networks at Forecasting and Prediction? A Review and Evaluation”, Journal of Forecasting, University of Maryland USA, 1998, pp. 481-482.
[18] Dibike, Y. B. and Solomatine, D. P. “River Flow ForecastingUsing Artificial Neural Networks”. A Paper Presented at European Geophysical Society (EGS) XXIV General Assembly Hague, The Netherlands, and Accepted for publication in EGS Journal of Physics and Chemistry of the Earth. 1999, pp.1-8.
[19] Solaimani, K. “Rainfall-Runoff Prediction Based on Artificial Neural Network A Case Study: Jarahi Watershed Iran”, American-Eurasian Journal Agriculture and Environmental Science, Vol. 5, Number 6, 2009, pp. 856-865.
[20] Kothyari, U. C. “Estimation of Mean Annual Flood from Ungauged Catchment using Artificial Neural Networks. Hydrology: Science and Practice for 21st Century”. British Hydrological Society. Vol. 1, 2004, pp. 297-301.
[21] Diamantopoulou, M. J., Georgiou, P. E. and Papamichail, D. M. “Performance Evaluation of Artificial Neural Networks in Estimating Reference Evapotranspiration with Minimal Meteorological Data”. Global NEST Journal Vol. 13, Number 1, 2011, pp. 18-27.
[22] Dastorania, M. T. and Afkhami, H. “Application of Artificial Neural Networks on Drought Prediction in Yazd (Central Iran)”, DESERT,Vol.16, 2011, pp. 39-48.
[23] Jeong, D. I. and Kim, Y. O. “Rainfall-Runoff Models using Artificial Neural Networks for Ensemble Streamflow Prediction”, HYDROLOGICAL PROCESSES, Vol.19, 2005, pp. 3819–3835.
[24] Pulido-Calvo, I., Gutiérrez-Estrada J. C. and Savic, D. “Heuristic Modelling of the Water Resources Management in the Guadalquivir River Basin, Southern Spain”, Water Resources Management. Vol. 26, 2012, pp. 185–209.
[25] Demirel, M. C. and Booij, M. J. “Identification of an Appropriate Low Flow Forecast Model for the Meuse River, Netherlands”, (Proceeding of Symposium JS.4 at the Joint IAHS & IAH Convention, Hyderabad, India 2009, pp. 296-300. http://www.doc.utwente.nl/78691/1/identificatio n_of.pdf. Assessed on April 24, 2012.
[26] Valent, P., Szolgay, J. and Riverso, C. “Assessment of the Uncertainties of a Conceptual Hydrologic Model by using Artificially Generated Flows”. Slovak Journal of Civil Engineering, Vol. 20, Number 4, 2012, pp. 35 – 43.
[27] Al Shamisi, M. H., Assi, A. H. and Hejase, H. A. N. “Using MATLAB to DevelopArtificial Neural Network Models for Predicting Global Solar Radiation in Al Ain City UAE”. Engineering Education and Research, 2011, pp. 219-238. [28] Chen, X. Wu, J. and Hu, Q. “Simulation of Climate