* The authors thank two anonymous referees, participants of Barcelona Empirical Banking Summer School and Finance and Growth in Central and Eastern Europe conference for their helpful comments.
** Received: May 31, 2010 Accepted: August 11, 2010
IN TURKEY
Elmas YALDΙZ, MA* Review article**
Interdepartmental Centre for Research Training JEL: D49, G21
in Economics and Management, UDC: 336.7
University of Trento, Trento elmas.yaldiz@unitn.it Flavio BAZZANA, PhD*
Department of Computer and Management Sciences, University of Trento, Trento
flavio.bazzana©unitn.it
Abstract
The aim of this paper is to understand the role of market power on the loan risk and overall bank risk measures for Turkish banks during 2001-2009. Testing for this questi-on is particularly important for the Turkish banking system, which experienced an inten-se regulation process after 2000 leading to a significant decreainten-se in the number of banks and thereby possibly reducing competition. The results of the study provide some eviden-ce regarding the competition-stability hypothesis.
Keywords: competition, banking
1 Introduction
Howe-ver, there is no theoretical and empirical consensus on the role of competition on stabi-lity in banking.
There are two main hypotheses that are found in the literature about the relationship between competition and stability in banking: competition-fragility and competition-sta-bility. The competition-fragility hypothesis argues that smaller banks, in more competitive environments, are more likely to take excessive risks and therefore competitive systems are more fragile than less competitive systems (see Keeley, 1990; Matutes and Vives, 2000; Caminal and Matutes, 2002; Martinez-Miera and Repullo, 2009 for further discussion). In contrast, the competition-stability hypothesis of Boyd and De Nicolo (2005) suggests that less competitive banking environment may cause fragility. Because a less competitive ban-king environments allow banks to increase the interest rate charged to firms (borrowers), which thus become more likely to have difficulties in repaying their loans, resulting in a higher probability of nonperforming loan ratios (NPL), more competitive environments are considered to be permit greater stability in banking systems (Beck, 2008)1.
Empirical studies consider the fragility issue from different points of views. Some stu-dies consider bank fragility from a macro perspective and take into account systemic ban-king crises (e.g. Beck, Demirguc-Kunt and Levine, 2006; and Schaeck and Čihak, 2006). Other studies consider bank fragility from a micro or managerial perspective and define it as the failure of an individual bank (e.g. Fungacova and Weill, 2009; and Bordo, Redish and Rockoff, 1993). There are also studies that consider fragility to be related to the risk-taking behavior of banks. These studies use the Z-index (e.g. Boyd and De Nicolo, 2006; and Berger, Klapper and Turk-Ariss, 2009) or the NPL ratios to measure risk (Jimenez, Lopez and Saurina, 2008). Macro studies mainly provide evidence for the competition-stability hypothesis while micro-based studies generally support the competition-fragili-ty hypothesis. There is also no consensus about the methods for measuring competition. Some studies simply take the concentration ratios, while others use indices such as the Herfihndahl-Hirschman Index (HHI), Lerner, Tobin’s q, and Panzar and Rosse’s (1987) H-statistic. The empirical literature does not provide conclusive evidence in favor of eit-her of the two hypotheses and the results of the individual studies are highly sensitive to the definition of fragility.
The relationship between competition and stability in banking has been investigated in many studies for the U.S. and mostly other advanced economies. However, little rese-arch has been carried out on this issue for developing economies, and previously there has been only one related study for Turkey: Tunay (2009). This is why our study is important. Tunay (2009) uses the NPL ratio as a measure of fragility and the three-bank concentra-tion ratio, the ratio of privately owned bank assets to total assets of the system, and the ratio of foreign bank assets to total assets of the system as measures of competition for Turkish banking. Employing fixed and random effects models, he estimates the relation-ship between competition and fragility for the years between 1988 and 2007. The findi-ngs of Tunay (2009) indicate that there is no statistically significant relationship between concentration and fragility. Moreover the existence of foreign banks was found to decre-ase and domestic banks were found to incredecre-ase fragility. The study provides some
dence in favor of the competition-stability hypothesis for Turkey. However, the measu-rement of competition by concentration indices – as suggested by the structure conduct hypothesis in industrial organization literature – is a controversial issue. This is because competition and concentration refer to different concepts, and previous studies show that a concentrated banking system can be more competitive than a less concentrated one but also that a less concentrated banking system can be less competitive than a concentrated system (Claessens and Laeven, 2003; and Abbasoglu, Aysan and Gunes, 2007).
The aim of this paper is to understand whether competition promotes stability or fra-gility for Turkish banks. This question is particularly important for the Turkish banking system since it has experienced intensive regulation processes that have led to a decline in the number of banks and, possibly to changes in the competitive structure especially after the year 2000, an important turning point for Turkish banking. This paper employs mainly two different risk measures to account for loan risk and overall risk measures as dependent variables: the nonperforming loans to total loans and the Z-index to measure the risk taking behaviors of banks. Firstly, we employ the Lerner index and secondly the ratio of the difference between the total revenues and total cost to the total revenues (that does not specify any restriction on inputs and outputs) as proxies for the market power of individual banks during 2001-2009. To summarize, this paper contributes to the existing literature in different ways. Primarily, it is the first study to calculate the Lerner index for Turkish banks. Second, it is the first paper that considers competition as the ability to sell products above the marginal cost and then employs this to see the effect of competition on the risk-taking behaviors of banks in Turkey.
The paper is organized as follows. The next section describes the methodology that is used to calculate the Lerner index, and the risk taking variables are introduced. Later, sample and data used in the study are presented along with the descriptive statistics. This is followed by a discussion of the empirical results, and the final section concludes the paper.
2 Methodology
Many studies consider competition as a structural phenomenon and accordingly em-ploy concentration ratios to measure competition. These studies argue that a greater con-centration creates a less competitive banking environment that leads to higher profitabi-lity (Fungacova and Weill, 2009). Accordingly, competition can be measured by con-centration indices such as the market share of the largest banks or by the HHI, which is defined as the sum of the squares of the market shares of the largest banks (Bikker and Haaf, 2000). However, it should be kept in mind that concentration and competition do not refer to the same thing.
is determined above the marginal cost the value of the Lerner index increases. That is the more market power there is, the bigger is Lerner index.
In summary, we need two things to calculate the Lerner index: the price of bank pro-duction and the marginal cost. In this study, the price of bank propro-duction is calculated as the total revenues over the total assets. The disadvantage of the Lerner index is that the marginal cost function needs to be estimated. In this paper, the information related to mar-ginal cost is obtained from the total cost function2.
A cost function specifies the relationship between cost, input prices and output level. However Berger and Humphrey (1997) state that there is no consensus on input and out-put measures in banking. Nonetheless, there are two dominant approaches on this issue: the intermediation and production approaches. The production approach evaluates banks as production units that produce services to the depositors and borrowers. In this appro-ach, the production factors such as land, labor and capital are used as inputs to produce banking services and the production is measured via the number of transactions or docu-ments processed over a given time period. However, since this data is not easy to obtain the number of accounts have often been used as a proxy for banks’ production in the pre-vious literature (Denizer et al., 2000; and Berger et al., 1997). The intermediation appro-ach on the other hand, considers deposit banks as financial intermediaries that collect de-posits from the depositors and lend to borrowers and assumes that banks collect dede-posits and other purchased funds with the assistance of labor and physical capital and as inter-mediaries turn these sources of funds into loans (Kasman, 2002).
However, Turkish deposit banks have not fulfilled their intermediation duty during the studied period and it is difficult to obtain data on the number of transactions; hence, the total loans are considered as outputs, while labor, physical capital, and borrowed funds are used as inputs.
The price of labor represents the unit price of labor and it is obtained by dividing the personnel expenses (including severance payments) by the total assets. The price of physi-cal capital is the ratio of other noninterest expenses (excluding personnel expenses and severance payments) to fixed assets. Finally, the price of funds represents the unit price of the funds and it is constructed as the ratio of interest expenses to borrowed funds and the deposit sum (Podpiera and Podpiera, 2005).
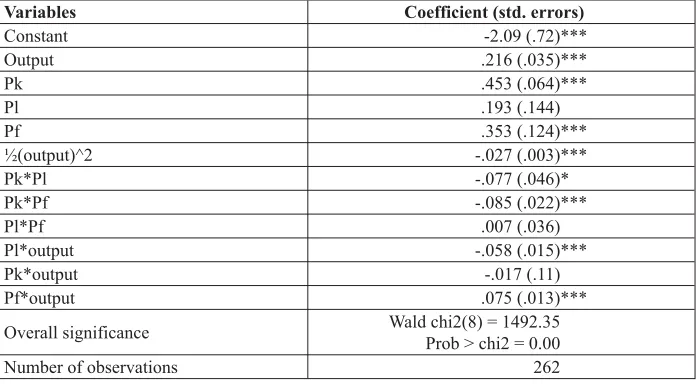
Under the cost function specification, the total cost (the sum of personnel expenses, other noninterest expenses and interest expenses) is estimated as a function of the out-put sum (total deposits, total securities, and total loans) and the three inout-put prices. Table A1 gives the estimation results of the total cost function that is built in order to obtain the marginal cost.
Calculating a Lerner index to be used as a proxy of market power is not an easy pro-cess and can possibly be subject to many misspecification biases. Firstly, it requires many assumptions on inputs and outputs, and secondly, it requires many assumptions on the calculation methods of input prices and output quantity, and finally it requires
ons on the functional form of the cost function. Mountain and Thomas (1998) show that it is better to include no factor prices than to include miss-specified factor prices. Thus, in order to calculate the market power of the individual banks in Turkey, we use an MP ratio that does not specify any inputs and outputs, as well as a functional form that is simply of the difference between the total revenues and total cost to the total revenues.
Since, the aim of this paper is to understand whether competition leads to taking hi-gher risks or not, the general empirical model for this question is:
Risk taking of banks = f(market power, control variables).
In order to measure the risk taking behaviors of banks, nonperforming loans, and Z-index are employed. The Z-index can be computed as Z = (NPA+EA) /σ(NPA), where NPA is the net profit to the assets, EA is the equity to assets ratio and σ(NPA) is the stan-dard deviation of the Net Profits to the Assets. The Z-index goes up as the profitabili-ty and capitalization increase, and decreases as the variabiliprofitabili-ty of the earnings increases. Thus, there is a tradeoff between the Z-index and the bank’s probability of failure (Ber-ger et al., 2009: 106). The Z-index increases with higher profitability and capitalization levels, and decreases with unstable earnings that are reflected by a higher standard de-viation of return on assets. In other words, it can be regarded as an inverse proxy of the bank’s risk-taking.
3 Data and descriptive statistics
The period 1999-2001 can be considered years of transformation for Turkish banks. Within these three years, the Turkish economy was hit by two severe economic crises and a destructive earthquake in the most industrialized region of the country. Furthermore, the parliament approved the new banking law (no 4389) in 1999. The Government guarantee on deposits, which had been set at 100 % for the year 1994 was restricted to 100,000 Tur-kish liras in 2000 and was further restricted to 50,000 TurTur-kish liras in 2001.
The Turkish Banking Restructuring Program was started in 2001. To build a stronger banking system after the two severe crises, this program was conducted under the con-trol of the IMF. The aim of these actions was to create a more efficient banking system. However, the restructuring program has turned out to be one of the most costly restructu-ring programs in the world (Banks in Turkey, 2001).
In Turkey, there were 81 banks operating in 1999. Over the next decade this num-ber fell drastically and as of April 2010 there are only 45 banks operating in Turkey. Of these, 32 are deposit banks and 13 are development and investment banks. Of the deposit banks, 3 are state-owned banks, 11 are privately-owned, 11 are foreign banks founded in Turkey, 6 are foreign banks having branches in Turkey, and there is one Saving and De-posit Insurance Fund3.
Banking has a distinctive place in the Turkish financial system and plays an impor-tant role in achieving financial stability in Turkey.4 Although there has been a recent in-crease in the number and size of non-banking financial institutions, the system is still do-minated by the deposit banks.
Data was drawn from the banks’ balance sheets and income statements as reported to the Banks Association of Turkey (BAT) and covers 30 deposit banks operating during the 2001-2009 period5, and the IPI data were obtained from the Turkish Central Bank (TCMB). As a measure of loan risk, the non-performing loans ratio (gross) and as a me-asure of overall bank risk Z-index are used. Table A3 gives the definitions and summary statistics of the variables employed in the empirical part of the study. The summary stati-stics show that our sample consists of very heterogeneous observations.
Two variables are employed in the study as proxies for market power. First, the Ler-ner index is derived from the marginal cost function and the price of the bank’s produc-tion as explained in methodology secproduc-tion. Second, (MP) is calculated as the differen-ce between the total revenue and total cost divided by the total revenue. Higher values of market power correspond to lower competition levels. Thus a negative coefficient is expected according to the fragility view. On the other hand, the competition-stability view expects a positive relation. The ASSETSHARE variable measures the asset share of the individual bank in the sector. Total shareholders’ equity divided by the total assets (EA) is the indicator of capital adequacy. Net profits (losses) divided by the total assets (NPA) is employed to control the effect of profitability on risk variables. Total re-venues divided by the total expenses (TRTE) variable is employed to control for mana-gerial efficiency.
In this study, the industrial production index (IPI) is used to control for the changes in the economic environment. When IPI is increasing, borrowers (firms and consumers) are considered to be earning more and to be able to repay loans more easily, thus the IPI has a negative expected relationship for NPLG, and has a positive expected sign for the empirical model for which the Z-index is the dependent variable.
4 Empirical results
The average Lerner index is calculated as 0.9674. This indicator implies that the banks in Turkey do not operate in a competitive environment, and enjoy monopoly rents. This result is consistent with Abbasoglu et al. (2007) who provide evidences for a monopo-listic competitive structure in the Turkish banking system from 2001 to 2005. With this calculation of market power, it is seen that Turkey has a less competitive banking sector than, particularly, the EU economies. In a recent study Carbo et al. (2009) calculate the average Lerner index for EU countries as 0.16.
An interesting result observed from the correlation matrix is the correlation between LERNER, MP and ASSETSHARE variables. There is a weak correlation between
ASSETS-4 Total assets of the banking system account for nearly 90 percent of the total assets of the financial sector and deposit banks held 97 percent of the total banking system assets in 2008 (Banks Association of Turkey, 2008).
HARE and the LERNER 0.08 and a 0.1 correlation between ASSETSHARE and MP. This preliminary result contradicts the structure-conduct-performance hypothesis used in in-dustrial organization theory. This hypothesis argues that as concentration increases, the banking environment becomes less competitive, which results in higher monopoly rents; accordingly, competition can be measured by the concentration indices. However, the number of studies challenging this hypothesis increased recently (Claessens and Laeven, 2003; and Abbasoglu et al., 2007).
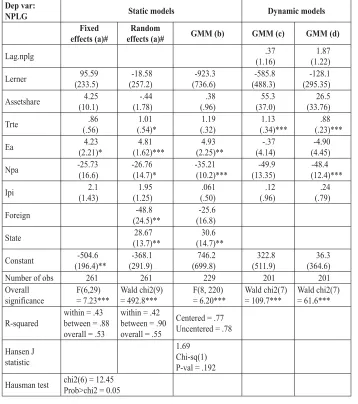
Tables A5-A8 summarize the results of the static and dynamic empirical models. Under the static models fixed-effects, random-effects and GMM models are estimated. The first two techniques assume the market power variable is exogeneous. However mar-ket power can be endogeneously determined. That is to say marmar-ket power can also be a function of level of risk. The Durbin Wu Hausman test is conducted to test for endoge-neity. Except for the first group of estimations (table A5) LERNER is found to be exo-geneously determined. For all the other remaining regressions LERNER and MP are en-dogeneous. In order to avoid the biased coefficient estimations caused by endogeneity, 2SLS or GMM techniques are applied in the literature (Berger et al., 2009; and Shaeck and Cihak, 2007). However, Baum and Schaffer (2003) indicate that if the errors are he-teroscedastic, the GMM technique will give more efficient estimates than the 2SLS. In order to test for the homoscedasticity assumption the Breusch-Pagan test employed and the errors are found to be heterosedastic. Consequently, the GMM technique can be con-sidered superior to the other static estimation techniques when endogeneity of market power proxies is present.
Under the dynamic models, two specifications of the GMM method proposed by Are-llano-Bond (1991) are used: in the first, market power variables are exogenously deter-mined, and endogeneously in the second model. In the models where the market power variables are endogenously determined, one-period lagged values of the market power variables are used as instruments. However, coefficients of the lagged dependent varia-bles are insignificant in all specifications in tavaria-bles A5-A8, which indicate the superiori-ty of the static models.
To sum, among the static models, since the market power variables are endogeneo-us and heteroscedasticity is present, the GMM technique is superior to the other specifi-cations of tables A6, A7 and A8. For models in table A5, where NPLG is the dependent and LERNER is the independent variable, the Durbin Wu Hausman endogeneity test in-dicates the absence of endogeneity. Thus random or fixed effects models are superior to static GMM. However the Hausman test is indifferent between the random and the fixed effects model at 5%. Moreover the results of the fixed and random effects models are quite similar.
and Z. Since Z can be regarded as an inverse measure of risk, these results suggest that as the market power of a bank increases the risk level of that bank increases. Thus, as mar-ket power decreases, competition creates less risky banks, and following this, the stabili-ty of the whole system can be realized. However in table A8 the static GMM model fails to find a significant relationship between MP and Z.
The positive and significant coefficient estimates of EA in random and fixed effects models of table A5 and in the static GMM model of table A6 reveal the effect of capita-lization for risk levels of banks. As shareholder equity to total assets ratio grows banks become more likely to take excessive risk. This may be due to offsetting risk by higher capitalization levels.
The negative and significant (10%) coefficient estimates of NPA in the random ef-fects model of table A5 and the static GMM model of table A6 reveals that as profitabi-lity increases banks are less likely to have higher loan risk levels. However this finding should not be considered very important since the fixed effects estimate of the coeffici-ent in table A5 is insignificant.
As for the effects of ownership structure on loan and overall risk levels of banks, the three state-owned banks are found to be more likely to have higher risk levels than pri-vate banks in all superior specifications of tables A5-A8. As for the effect of the foreign ownership, foreign banks are found less risky in the models of table A5, A6 and A7. Fi-nally, the IPI variable has no explanatory power in any of the models, which indicates loan and overall risk levels of banks are not affected by the macro economic conditions.
5 Conclusion
The aim of this paper was to examine the relationship between the market power and risk-taking behaviors of banks in Turkey between 2001 and 2009. As dependent variables, non-performing loans and Z-index are employed as measures of loan and overall risk le-vels respectively, and the market power is first measured by the Lerner index. However, calculation of the Lerner index can be subject to many misspecification biases in ban-king. Thus secondly, in addition to the standard Lerner index, the difference between the total revenues and total cost over the total revenues (which does not specify any restricti-on restricti-on inputs and outputs or a cost functirestricti-on to estimate the marginal cost) is used as anot-her proxy for the market power.
to say, the loan risk and the overall risk levels tend to be higher in better capitalized and less profitable banks.
As a proxy for macroeconomic environment, the industrial production index does not have any explanatory power on the risk-taking behaviors of banks in Turkey. Regarding the ownership structure and risk taking behaviors of banks, the three state-owned banks are found to be more likely to have higher risk levels than private banks. Additionally there is some little evidence supporting the idea that the foreign banks are less risky than the domestic ones. To sum up, our main result of the competition-stability hypothesis is in line with findings of the previous study of Tunay (2009) on Turkish banking.
Some policy suggestions can be derived from the results of the study. First of all there is a huge gap between the average market powers of EU and Turkish banking sy-stems. Banks in Turkey operate nearly in a non-competitive environment compared to the EU economies. In addition to this fact, the disadvantages of having less competition and “too big to fail” policies in banking are especially important for an emerging economy like Turkey. Thus competition should be fostered in the sector in order to have a system composed of less risky banks and a consequent lower probability of financial crisis. The current system is composed of powerful banks (with higher price-cost margins), and the entrance of smaller banks (lower price-cost margin) should be encouraged. In this way, a more competitive banking system can be created and the investment level of the econo-my might be increased with lower prices on the loan side.
APPENDIX
Table A1: Total cost function estimation results Dep. Var.: log(TC)
Variables Coefficient (std. errors)
Constant -2.09 (.72)***
Output .216 (.035)***
Pk .453 (.064)***
Pl .193 (.144)
Pf .353 (.124)***
½(output)^2 -.027 (.003)***
Pk*Pl -.077 (.046)*
Pk*Pf -.085 (.022)***
Pl*Pf .007 (.036)
Pl*output -.058 (.015)***
Pk*output -.017 (.11)
Pf*output .075 (.013)***
Overall significance Wald chi2(8) = 1492.35 Prob > chi2 = 0.00
Number of observations 262
Notes: (a) *, ** and *** denote statistical significance at 10%, 5% and 1% respectively. (b) Output implies the log of total loans.
(c) Pk, Pl and Pf stand for logs of the prices of capital, labor and funds respectively.
Table A2: List of banks used in the study
Türkiye Cumhuriyeti Ziraat Bankası A.Ş. Arap Türk Bankası A.Ş.
Türkiye Halk Bankası A.Ş. Citibank A.Ş. Türkiye Vakıflar Bankası T.A.O. Denizbank A.Ş.
Adabank A.Ş. Deutsche Bank A.Ş.
Akbank T.A.Ş. Eurobank Tekfen A.Ş. Alternatif Bank A.Ş. Finans Bank A.Ş. Anadolubank A.Ş. Fortis Bank A.Ş. Şekerbank T.A.Ş. HSBC Bank A.Ş. Tekstil Bankası A.Ş. ING Bank A.Ş. Turkish Bank A.Ş. Millennium Bank A.Ş. Türk Ekonomi Bankası A.Ş. Turkland Bank A.Ş. Türkiye Garanti Bankası A.Ş. ABN AMRO Bank N.V. Türkiye İş Bankası A.Ş. Bank Mellat
Table A3: Summary statistics
Variable Definition Obs Mean Std. dev Min Max
Nplg Loans under follow-up (gross) /
Total loans (%) 265 35.62 241.6 0 3759 Z (NPA+ EA) / std. dev(NPA) 270 2.78 2.59 -3.06 15.07
Lerner Lerner index (Price-Marginal
Cost) / Price 262 0.9674 0.096 0.021 0.995
Mp (Total Revenues-Total Cost) /
Total revenues (%) 269 0.9921 0.0025 0.971 0.9992 Assetshare Asset share in the sector (%) 270 3.214 4.78 0.0001 19.4 Npa Net profit (losses) / Total assets (%) 270 0.983 6.84 63.2 32.2 Ea Shareholders’ equity / Total assets (%) 270 18.07 16.36 -2.67 84.9 Trte Total revenues / Total expenses (%) 269 144.2 91.1 34.63 1290.8 Ipi Industrial production index 270 125 17.2 94.43 146.32
Table A4: Correlations
Nplg Z Lerner Mp Assetshare Npa Ea Trte Ipi
Nplg 1
Z 0.21 1
Lerner -0.25 -0.23 1
Mp -0.06 0.51 0.21 1
Assetshare -0.07 -0.15 0.08 0.1 1
Table A5: Estimation results: dep var=nplg and market power=Lerner
Dep var:
NPLG Static models Dynamic models Fixed
effects (a)#
Random
effects (a)# GMM (b) GMM (c) GMM (d)
Lag.nplg .37 (1.16) 1.87 (1.22) Lerner 95.59 (233.5) -18.58 (257.2) -923.3 (736.6) -585.8 (488.3) -128.1 (295.35) Assetshare 4.25 (10.1) -.44 (1.78) .38 (.96) 55.3 (37.0) 26.5 (33.76) Trte .86 (.56) 1.01 (.54)* 1.19 (.32) 1.13 (.34)*** .88 (.23)*** Ea 4.23 (2.21)* 4.81 (1.62)*** 4.93 (2.25)** -.37 (4.14) -4.90 (4.45) Npa -25.73 (16.6) -26.76 (14.7)* -35.21 (10.2)*** -49.9 (13.35) -48.4 (12.4)***
Ipi 2.1
(1.43) 1.95 (1.25) .061 (.50) .12 (.96) .24 (.79) Foreign -48.8 (24.5)*** -25.6 (16.8) State 28.67 (13.7)** 30.6 (14.7)**
Constant -504.6 (196.4)** -368.1 (291.9) 746.2 (699.8) 322.8 (511.9) 36.3 (364.6)
Number of obs 261 261 229 201 201
Overall significance F(6,29) = 7.23*** Wald chi2(9) = 492.8*** F(8, 220) = 6.20*** Wald chi2(7) = 109.7*** Wald chi2(7) = 61.6*** R-squared
within = .43 between = .88 overall = .53
within = .42 between = .90 overall = .55
Centered = .77 Uncentered = .78
Hansen J statistic
1.69 Chi-sq(1) P-val = .192
Hausman test chi2(6) = 12.45 Prob>chi2 = 0.05
Notes: *, ** and *** denote statistical significance at 10%, 5% and 1% respectively. Wooldridge test for the serial correlation indicates absence of serial correlation. Heteroscedasticity robust std. errors are presented in parentheses.
(a) FE and RE estimators that assume Lerner exogeneous. (b) GMM estimators that assumes Lerner endogeneous.
(c) differenced GMM estimator that assumes all independent variables except the lagged depen-dent variable are exogeneous.
(d) differenced GMM estimator that assumes Lerner and lagged dependent variable are endoge-neous.
Table A6: Estimation results: dep var=nplg and market power=MP
Dep var:
NPLG Static models Dynamic models Fixed effects
(a)
Random effects
(a) #GMM (b)# GMM (c) GMM (d)
Lag.nplg .05
(1.40)
1.48 (1.21)
Mp 17569.3 (14419.7) 18486.1 (12616.7) 18428.4 (7948.6)** 16528.3 (15264.4) 28139.3 (13612.2) Assetshare 1.67 (10.19) -1.76 (1.48) -1.22 (1.04) 51.1 (32.8) 34.3 (29.08) Trte .78 (.43)* .80 (.35)** .99 (.26)*** 1.03 (.40)** .80 (.31)** Ea 3.31 (2.65) 4.93 (1.72)*** 5.82 (2.29)** 2.64 (4.45) -3.36 (4.25)
Npa -28.02 (18.3) -29.1 (15.7)* -37.3 (10.4)*** -50.41 (17.7)*** -51.4 (16.4)*** Ipi 2.01 (1.24) 1.81 (1.09)* -.13 (.51) -.091 (.97) .22 (.66)
Foreign -51.8
(20.8)** -25.6 (18.1) State 31.04 (15.3)** 42.8 (14.9)***
Constant -18670.8 (12599.6) -18670.8 (12659.4) -18395.8 (7902.3)** -16629.6 (15190.4) -28028.81 (13514.9)** Number of
obs 264 264 234 205 205
R-squared
within = .43 between = .89 overall = .54
within = .42 between = .92 overall = .56
Centered = .76 Uncentered = .77
Overall significance F(6,29) = 10.98 Wald chi2(8) = 260.1*** F(8, 225) = 14.18*** Wald chi2(7) = 147.14*** Wald chi2(7) = 33.7*** Hansen J statistic 1.361 Chi-sq(1) P-val = 0.243
Notes: *, ** and *** denote statistical significance at 10%, 5% and 1% respectively. Wooldridge test for the serial correlation indicates absence of serial correlation. Heteroscedasticity robust std. errors are presented in parentheses.
(a) FE and RE estimators that assume MP exogeneous. (b) GMM estimator assume MP endogeneous.
(c) differenced GMM estimator that assumes all independent variables except the lagged depen-dent variable are exogeneous.
(d) differenced GMM estimator that assumes MP and lagged dependent variable are endogene-ous.
Table A7: Estimation results: dep var=z and market power=Lerner
Dep var: z Static models Dynamic models Fixed effects
(a)
Random
effects (a) #GMM (b)# GMM (c) GMM (d)
Lag.z -.007
(.12)
-.004 (.088)
Lerner -5.08 (3.08) -6.23 (2.24)*** -7.93 (3.56)** -4.37 (3.92) -7.16 (3.11)** Assetshare -.15 (.13) -.055 (.046) -.043 (.016)*** -.044 (.24) -.01 (.21)
Trte .01 (.002)*** .013 (.002)*** .014 (.003)*** .003 (.0009)*** .004 (.001) Ea Npa Ipi .014 (.007)* .013 (.006)** .002 (.006) -.01 (.01) -.001 (.009)
Foreign .11
(.58) .064 (.21) State -.31 (.19) -.33 (.108)***
Constant 4.67 (3.09) 5.13 (2.19)** 8.06 (3.42)** 7.89 (3.74) 9.23 2.91)*** Number of
obs 262 262 229 201 201
R-squared
within = .33 between = .58 overall = .48
within = .32 between =.79 overall = .57
Centered = .58 Uncentered = .83
Overall significance F(4,29) = 23.98*** Wald chi2(6) = 590.4*** F(6, 222) = 11.77*** Wald chi2(5) = 54.32*** Wald chi2(5) = 52.09*** Hansen J statistic 3.463 Chi-sq(1) P-val = 0.062
Notes: *, ** and *** denote statistical significance at 10%, 5% and 1% respectively. Wooldridge test for the serial correlation indicates absence of serial correlation. Heteroscedasticity robust std. errors are presented in parentheses.
(a) FE and RE estimators that assumes Lerner exogeneous. (b) GMM estimator that assume Lerner endogeneous.
(c) differenced GMM estimator that assumes all independent variables except the lagged depen-dent variable are exogenous.
(d) differenced GMM estimator that assumes Lerner and lagged dependent variable are endoge-neous.
Table A8: Estimation results: dep var=z and market power=MP
Dep var: z Static models Dynamic models Fixed effects
(a)
Random
effects (a) #GMM (b)# GMM (c) GMM (d)
Lag.z -.045
(.24)
.16 (.16)
Mp 331.5
(138.5)** 315.8 (137.2)** 152.6 (118.2) 255.1 (75.5)*** 211.8 (84.2)** Assetshare -.26 (.16) -.17 (.09)* -.128 (.032)*** -.26 (.18) -.21 (.19)
Trte .007 (.001)*** .007 (.001)*** .013 (.004)*** .0028 (.0009)*** .0026 (.0007)*** Ea Npa Ipi .010 (.008) .010 (.007) .007 (.008) -.0008 (.02) .001 (.012)
Foreign -.68
(.96) -.61 (.37)* State -.13 (.42) -.33 (.14)** Constant -327.6 (137.6)** -312.06 (136.1)** -150.8 (117.06) -249.5 (75.9)*** -207.5 (84.1)** Number of
obs 269 269 239 210 210
R-squared
within = .38 between = .30 overall = .33
within = .38 between = .40 overall = .40
Centered = .43 Uncentered = .75
Overall significance Wald chi2(6) = 331.34*** F(6, 232) = 11.91*** Wald chi2(5) = 81.02*** Wald chi2(5) = 73.09*** Hansen J statistic 0.235 Chi-sq(1) P-val = 0.628
Notes: *, ** and *** denote statistical significance at 10%, 5% and 1% respectively. Wooldridge test for the serial correlation indicates absence of serial correlation. Heteroscedasticity robust std. errors are presented in parentheses.
(a) FE and RE estimators that assume MP exogeneous. (b) GMM estimators that assumes MP endogeneous.
(c) differenced GMM estimator that assumes all independent variables except the lagged depen-dent variable are exogenous.
(d) differenced GMM estimator that assumes MP and lagged dependent variable are endogene-ous.
LITERATURE
Abbasoglu, O. F., Aysan, A. F. and Gunes, A., 2007. “Concentration, Competition, Efficiency and Profitability of the Turkish banking Sector in the Post-Crises Period” [on-line]. MPRA Paper, No. 5494. Available from: [http://mpra.ub.uni-muenchen.de/5494/1/ MPRA_paper_5494.pdf].
Arellano, M. and Bond, S., 1991. “Some Tests of Specification for Panel Data: Monte Carlo Evidence and an Application to Employment Equations”. Review of Econo-mic Studies, 58 (2), 277-297.
Baum, F. C. and Schaffer, M. E., 2003. “Instrumental Variables and GMM: Esti-mation and Testing”. The Stata Journal 3 (1), 1-31.
Beck, T., 2008. “Bank Competition and Financial Stability: Friends or Foes?” World Bank. Policy Research Working Paper, No. 4656.
Beck, T., Demirguc-Kunt, A. and Levine, R., 2006. “Bank Concentration, Compe-tition, and Crises: First Results”. Journal of Banking and Finance, 30 (5), 1581-1603.
Berger, A. N., Klapper, L. and Turk-Ariss, R., 2009. “Bank Competition and Fi-nancial Stability”. Journal of FiFi-nancial Services, 35 (2), 99-118.
Bikker, J. A. and Haaf, K., 2000. “Measures of Competition and Concentration in the Banking Industry: A Review of the Literature” [online]. Research Series Supervisi-on, No. 27. Available from: [http://www.dnb.nl/binaries/Measures%20of%20Competiti on_tcm46-145799.pdf].
Bolt, W. and Humphrey, D., 2009. “Bank Competition Efficiency in Europe: A Frontier Approach” [online]. DNB Working Papers, No. 194. Available from: [http:// www.dnb.nl/en/binaries/Working%20paper%20194_tcm47-210265.pdf].
Bordo, M. H., Redish, A. and Rockoff, H., 1993. “A Comparison of the Uni-ted States and Canadian Banking Systems in the Twentieth Century: Stability vs. Efficiency?”[online]. NBER Working Paper, No. 4546. Available from: [http://www. nber.org/papers/w4546].
Boyd, J. and De Nicolo, G., 2005. “The Theory of Bank Risk-taking and Competi-tion Revisited”. Journal of Finance, 60 (3), 1329-1343.
Boyd, J., De Nicolo, G. and Jalal, A., 2006. “Bank Risk-taking and Competition Revisited: New Theory and New Evidence”. IMF Working Paper, WP/06/297. Washin-gton: International Monetary Fund.
Boyd, J., De Nicolo, G. and Jalal, A., 2009. “Bank Competition, Risk and Asset Allo-cations”. IMF Working Paper, WP/09/143. Washington: International Monetary Fund.
Caminal, R. and Matutes, C., 2002. “Market Power and Banking Failures”. Inter-national Journal of Industrial Organization, 20 (9), 1341-1361.
Carbo, S. [et al.], 2009. “Cross Country Comparisons of Competition and Pricing Power in European Banking”. Journal of International Money and Finance, 28 (1), 115-134.
de/portal/page/portal/ifoContent/N/neucesifo/CONFERENCES/SC_CONF_2008/Regula tion%20of%20Financial%20Markets%20in%20Europe/Papers/Vives_fm08.pdf].
Christensen, L. R. and Greene, W. H., 1976. “Economies of Scale in U.S. Electric Power Generation”. The Journal of Political Economy, 84 (4), 655-676.
Cordella, T. and Yeyati, E. L., 2002. “Financial Opening, Deposit Insurance, and Risk in a Model of Banking Competition”. European Economic Review, 46 (3), 471-485.
Demsetz, R., Saidenberg, M. R. and Strahan, P. E., 1996. “Banks with Something to Lose: The Disciplinary Role of Franchise Value”. Economic Policy Review, Federal Reserve Bank of New York, (October), 1-14.
Fungacova, Z. and Weill, L., 2009. “How Market Power Influences Bank Failu-res: Evidence from Russia”. BOFIT Institute for Economies in Transition discussion pa-pers, No. 12.
Hainz, C., Weill, L. and Godlewski, C. J., 2008. “Bank Competition and Collateral: Theory and Evidence”. Bank of Finland Research Discussion Papers, No. 27.
Jimenez, G, Lopez, J. A. and Saurina, J., 2008. “How Does Competition Impact Bank Risk-taking” [online]. Working Paper, the Federal Reserve Bank of San Francis-co. Available from: [http://www.frbsf.org/publications/economics/papers/2007/wp07-23bk.pdf].
Keeley, M., 1990. “Deposit Insurance, Risk and Market Power in Banking”. Ameri-can Economic Review, 80 (5), 1183-1200.
Koskela, E. and Stenbacka, R., 2000. “Is There A Tradeoff Between Bank Compe-tition and Financial Fragility?” Journal of Banking and Finance, 24 (12), 1853-1873.
Leuvensteijn, M. [et al.], 2007. “A New Approach To Measuring Competition in the Loan Markets of the Euro Area”. DNB Working Papers, No. 143.
Martinez-Miera, D. and Repullo, R., 2008. “Does Competition Reduce the Risk of Bank Failure?” [online]. CEPR Discussion Paper, No. 6669. Available from: [ftp://ftp. cemfi.es/wp/08/0801.pdf].
Matutes, C. and Vives, X., 1996. “Competition for Deposits, Fragility, and Insuran-ce”. Journal of Financial Intermediation, 5 (2), 184-216.
Matutes, C. and Vives, X., 2000. “Imperfect Competition, Risk-taking and Regula-tion in Banking”. European Economic Review, 44 (1), 1-34.
Mishkin, F. S., 1999. “Financial Consolidation: Dangers and Opportunities”. Jour-nal of Banking and Finance, 23 (2-4), 675-691.
Mountain, D. C. and Hugh, T., 1999. “Factor price misspecification in bank cost function estimation”. Journal of International Financial Markets, Institutions and Money, 9 (2), 163-182.
Panzar, J. C. and Rosse, J. N., 1987. “Testing for ‘Monopoly’ Equilibrium”. Jour-nal of Industrial Economics, 35 (4), 443-456.
Ray, S. C., 1982. “A Translog Cost Function Analysis of U.S. Agriculture 1939-77”. American Journal of Agricultural Economics, 64 (3), 490-498.
Schaeck, K., Čihák, M. and Wolfe, S., 2006. “Are More Competitive Banking Sy-stems More Stable?” IMF Working Paper, WP/06/143. Washington: International Mo-netary Fund.
Schaeck, K. and Čihák, M., 2007. “Banking Competition and Capital Ratios.” IMF Working Paper, No. 07/216. Washington: International Monetary Fund.