Time trends in avoidable cancer mortality in Lithuania
1992–2008
Giedre Smailyte
1, 2,
Laurynas Pareigis
11 Lithuanian Cancer Registry, Institute of Oncology, Vilnius University, Vilnius, Lithuania
2 Institute for
Demographic Research, Lithuanian Social Research Centre, Vilnius, Lithuania
Background. This study was aimed to evaluate achievements of medical health care services in Lithuania by analysing time trends in avoidable cancer mortality of the whole Lithuanian population from 1992 through 2008.
Materials and methods. Data of the Lithuanian Cancer Registry for 1992–2008 were used to analyse avoidable cancer mortality trends. Mortality rates for all cancer and selected cancer sites were analysed. Age-standardised rates were calculated for both sexes. The age of the study subjects ranged between 5 and 75 years. The cor-responding population data by age, sex and year were available from the Statistics Lithuania.
Results. Cancer mortality has been decreasing continuously over time in both sex-es. The degree of reduction in all-site cancer mortality was slightly higher in women (by 1.03% per year) than in men (by 0.83% per year). Mortality avoidable by medical intervention has been continuously decreasing since 1992 in both sexes by more than 2% per year, while mortality avoidable by primary prevention decreased only in men. Cancer mortality avoidable by secondary prevention was decreasing in women and increasing in men.
Conclusions.In Lithuania, a remarkable reduction in avoidable cancer mortality over the past decade has been found. However, the rate of reduction was slower in mortality avoidable by primary or secondary prevention methods than in mortality preventable by direct medical care, indicating that there is a need to put more effort towards primary and secondary prevention.
Key words: avoidable death, cancer mortality, quality of health care
Correspondence to: Giedre Smailyte, Lithuanian Cancer Registry, Insti-tute of Oncology, Vilnius University, P. Baublio Str. 3B, LT-08406 Vilnius. E-mail: [email protected]
INTRODUCTION
Avoidable mortality is defined as untimely death that may have been prevented by the timely provision of appropriate medical intervention (1), and it is frequently used as a sta-tistical indicator of the achievements of medical health care services in order to assess the improvement of health level independently of other socioeconomic factors (2).
In the middle of 1990, Lithuania declared independ-ence. Since then, Lithuania has experienced many changes that have, directly or indirectly, affected the health care
sys-tem. Earlier studies have examined the scale of avoidable mortality in Lithuania for the period 1970–1990 (3); later, changes in avoidable cancer mortality in 1991–1999 were compared with the previous period (4). Avoidable mortal-ity in Lithuania is reported to be higher than in Western Europe (5).
The concept of ‘avoidable’ mortality has changed over time, and some problems such as the ambiguity of the defi-nition and some arbitrariness in disease selection still re-main unresolved (6, 7). In this study, selection of the list of avoidable cancer deaths is based on the classification pro-posed by Simonato et al. (8).
This study aims to evaluate the achievement of medi-cal health care services in Lithuania by analysing the time trends in avoidable cancer mortality of the whole Lithua-nian population from 1992 to 2008, based on cancer mor-tality data collected by the Lithuanian Cancer Registry.
MATERIALS AND METHODS
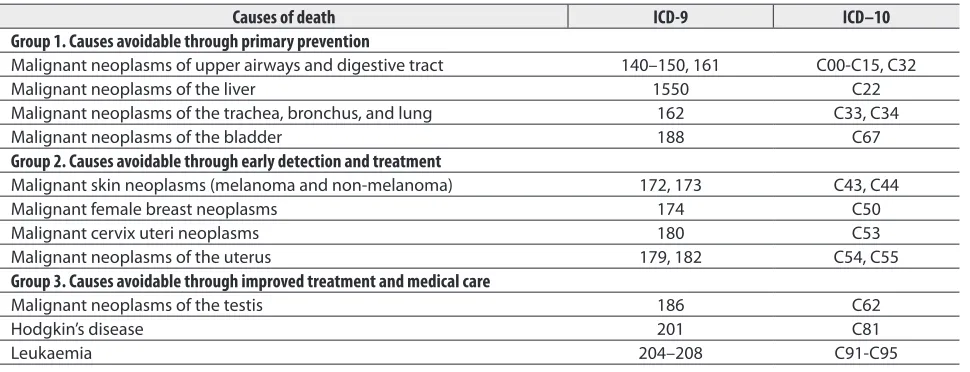
A list of avoidable deaths from cancer was compiled fol-lowing the categorization of the avoidable causes of death, proposed by Simonato et al., where the avoidable causes of death in the list were categorized into those amenable to primary prevention (group 1), those amenable to early de-tection and treatment (group 2), and those amenable to im-proved treatment and medical care (group 3). These groups were defined as:
1. Causes avoidable through primary prevention, i. e. by reducing the incidence of the disease. This category in-cludes causes whose aetiology is in part attributable to life-style factors (such as alcohol and / or tobacco consumption) and / or to occupational risk factors. It also includes deaths from injury and poisoning, which are influenced in part by legal and societal measures such as traffic safety and crime reduction policies.
2. Causes amenable to secondary prevention through early detection and treatment. This group includes the causes of death for which screening modalities have been established, such as cancer of breast and cervix, as well as causes in which death is avoidable through early detection combined with adequate treatment, such as skin cancer.
3. Causes amenable to improved treatment and medi-cal care. This group includes infectious diseases in which deaths are ‘avoidable’ largely through antibiotic treatment and immunization, as well as the causes that require med-ical and / or surgmed-ical intervention, such as hypertension, appendicitis, in which deaths are related to “complex in-teractions within the health care system, such as accurate diagnosis, transport to hospital, adequate medical and surgical care”.
Data of the Lithuanian Cancer Registry for the years 1992–2008 were used to analyse avoidable cancer mortality trends. Cancer mortality statistics are based on the under-lying causes of death as reported in the medical certificate of death by the certifying physician. Causes of death were co ded according to the International Classification of Dis-eases, 9th revision, for the period 1992–1997, and according to the International Classification of Diseases, 10th revision, for the period 1997–2008. The corresponding population data by age, sex and year were available from Statistics Lithuania. The age of the study subjects was limited to a range between 5 and 75 years.
Mortality rates for all cancer and selected cancer sites were analysed. Age-standardised rates were calculated for both sexes. Standardization was performed using the direct method (European standard population). The estimated an-nual percentage change (EAPC) was computed for trends by means of generalized linear models. Joinpoint software version 3.4.3 was used for the analysis (National Cancer In-stitute: Joinpoint Regression Program Version 2.6. Available from: URL:http://srab.cancer.gov/joinpoint/download.html).
RESULTS
The mortality rate has been decreasing continuously over time in both sexes. The degree of reduction in total can-cer mortality was slightly higher in females than in males.
Table 1. Categorisation of causes of avoidable cancer mortality (adopted from Simonato et al.)
Causes of death ICD-9 ICD–10
Group 1. Causes avoidable through primary prevention
Malignant neoplasms of upper airways and digestive tract 140–150, 161 C00-C15, C32
Malignant neoplasms of the liver 1550 C22
Malignant neoplasms of the trachea, bronchus, and lung 162 C33, C34
Malignant neoplasms of the bladder 188 C67
Group 2. Causes avoidable through early detection and treatment
Malignant skin neoplasms (melanoma and non-melanoma) 172, 173 C43, C44
Malignant female breast neoplasms 174 C50
Malignant cervix uteri neoplasms 180 C53
Malignant neoplasms of the uterus 179, 182 C54, C55
Group 3. Causes avoidable through improved treatment and medical care
Malignant neoplasms of the testis 186 C62
Hodgkin’s disease 201 C81
There were no joinpoints found in male or female data; standardised rates steadily go down on average by 0.83% (95% CI from –1.14 to –0.52) per year for males and 1.03% (95% CI from –1.40 to –0.66) for females.
Table 3 shows the time trend of avoidable cancer mortal-ity rates according to each category of medical intervention effectiveness for preventing death from cancer. Mortality avoidable by medical intervention has been continuously decreasing since 1992 in both sexes by more than 2% per year, while mortality avoidable by primary prevention de-creased only in males. Cancer mortality avoidable by sec-ondary prevention was decreasing in females and increas-ing in males.
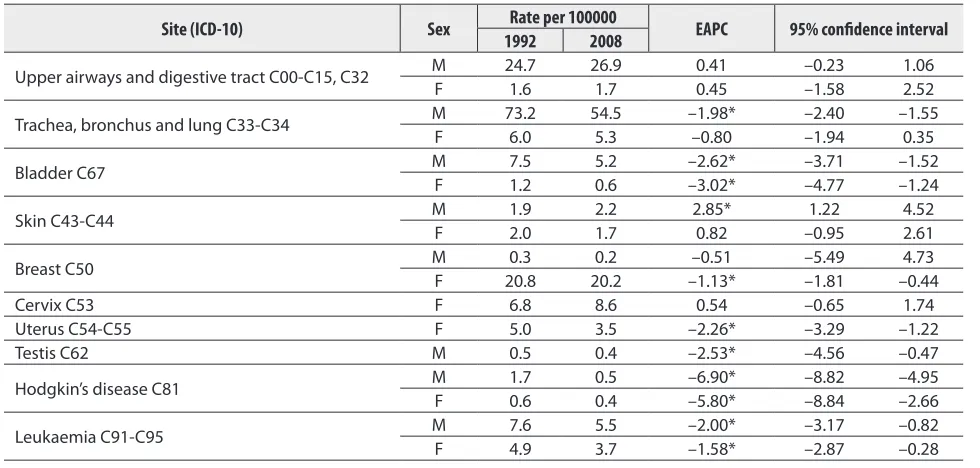
Results of the joinpoint analysis by sex and cancer site are reported in Table 3. There are differences in avoidable mortality cancer groups by individual cancer sites. In can-cer mortality avoidable by primary prevention, mortality from cancer of the upper airways and digestive tract was stable in both sexes, and lung cancer mortality was
sta-Table 2. Time trend of avoidable mortality rates by each category of intervention effectiveness for preventing death, 1992–2008
Site (ICD-10) Sex 1992Rate per 1000002008 EAPC 95% confidence interval
All sites C00-C96 M 222.9 189.7 –0.83* –1.14 –0.52
F 105.7 98.1 –1.03* –1.40 –0.66
Causes avoidable through primary prevention C00-C15, C32-C34, C67
M 105.4 86.6 –1.38* –1.77 –0.99
F 8.7 7.7 –0.68 –1.46 0.11
Causes avoidable through early detection and treatment C43-C44, C50, C53-C55
M 2.2 2.4 2.44* 1.10 3.79
F 34.6 34.0 –0.77* –1.29 –0.25
Causes avoidable through improved treatment and medical care C62, C81, C91-C95
M 9.9 6.4 –2.70* -3.54 –1.86
F 5.5 4.2 –2.10* –3.17 –1.02
* p < 0.05.
ble only in females. Mortality from trachea, bronchus and lung cancer was decreasing on average by 1.98% in males. Mortality from bladder cancer also shows diminution with EAPC of –2.62 (males) and –3.02 (females).
Mortality from melanoma and other skin cancers shows an uprising trend in males (EAPC 2.85%) and a stable trend in females. Mortality from breast cancer, the major cause of death for the female population, shows a decreasing trend by 1.13% per year over the study period. Female mortality rates from cervical cancer were stable. Mortality rates from the cancer of uterus are not in line with cervix cancer and are steadily decreasing over the whole period. The average change in mortality from uter-us cancer is –2.26%.
Being overall low, mortality rates of cancer avoidable through improved treatment and medical care are decreas-ing in Lithuania in all cancer sites studied. Mortality rates from testicular cancer are decreasing, and for the study pe-riod the EAPC is –2.53 with 95% CI from –4.56 to –0.47.
Table 3. Time trend of age- and sex-adjusted all-cause and avoidable mortality rates, 1992–2008
Site (ICD-10) Sex 1992Rate per 1000002008 EAPC 95% confidence interval
Upper airways and digestive tract C00-C15, C32 M 24.7 26.9 0.41 –0.23 1.06
F 1.6 1.7 0.45 –1.58 2.52
Trachea, bronchus and lung C33-C34 M 73.2 54.5 –1.98* –2.40 –1.55
F 6.0 5.3 –0.80 –1.94 0.35
Bladder C67 M 7.5 5.2 –2.62* –3.71 –1.52
F 1.2 0.6 –3.02* –4.77 –1.24
Skin C43-C44 M 1.9 2.2 2.85* 1.22 4.52
F 2.0 1.7 0.82 –0.95 2.61
Breast C50 M 0.3 0.2 –0.51 –5.49 4.73
F 20.8 20.2 –1.13* –1.81 –0.44
Cervix C53 F 6.8 8.6 0.54 –0.65 1.74
Uterus C54-C55 F 5.0 3.5 –2.26* –3.29 –1.22
Testis C62 M 0.5 0.4 –2.53* –4.56 –0.47
Hodgkin’s disease C81 M 1.7 0.5 –6.90* –8.82 –4.95
F 0.6 0.4 –5.80* –8.84 –2.66
Leukaemia C91-C95 M 7.6 5.5 –2.00* –3.17 –0.82
F 4.9 3.7 –1.58* –2.87 –0.28
Mortality rates from Hodgkin’s disease are going down for both sexes: EAPC for males is –6.90 and for females –5.80. Leukaemia mortality rates also show a consistent down-trend which is 2.00% per year for the male and –1.58% for the female population.
DISCUSSION
In general, avoidable mortality is declining in European countries (8). In Sweden, avoidable mortality between 1974 and 1985 declined in male and female populations (9). A study in Belgium also showed a decrease in avoidable mor-tality between 1974 and 1994 (10). All European countries, except Hungary, showed a 2.4% annual reduction in avoid-able mortality between 1980 and 1997 (11). Avoidavoid-able mor-tality in Lithuania in 1991–1999 increased as compared with 1970–1990 (4).
Avoidable cancer mortality is usually studied in broad categories of avoidable deaths. These broad categories ob-scure the potentially contradictory trend in specific groups of causes. It is thus necessary to consider in detail some components in each category. In previous studies of avoid-able mortality in Lithuania, the increasing lung and cervi-cal cancer mortality was reported for the period 1971–1990 (4); an increase of these cancer sites was also found for the period 1991–1999 (4).
During the period 1992–2008, cancer mortality in Lithuania has been decreasing. This reduction was greatly attributable to the reduction of avoidable mortality, an in-dicator reflecting the quality of medical health care ser vice. There were noticeable differences between males and fe-males in the patterns and trends of cancer mortality ac-cording to the category of medical intervention proven effective for disease prevention. These figures, while hav-ing some explanatory power, do mask considerable fluctua-tions of cancer mortality by site. Cancer mortality avoidable by medical intervention in Lithuania has been decreasing since 1992 in both sexes, although mortality rates in this group of avoidable cancer are low. In the category of mor-tality avoidable by secondary prevention, mormor-tality rates were higher in females than in males, and a reduction in mortality over the study period was observed only in females. This finding suggests that there might be an in-equality between sexes in terms of the usage of preventive medical services in Lithuania. Mortality associated with cervical cancer, which is known to be preventable by sec-ondary prevention, was not decreasing in Lithuania. Also, the delayed introduction of secondary prevention and low participation rates in cervical cancer screening programs were likely the main reasons for the stable trend. Cancer mortality avoidable by primary prevention was decreasing in male and stable in female populations. This observation is valid for lung cancer mortality, which has been
decreas-ing in males. Mortality rates in females were low; therefore, the decrease was not significant. This finding could have been the result of decreasing smoking rates or other chang-es in smoking behaviour.
To our knowledge, our study is the first to examine the contribution of medical health care services to the im-provement of the population health level, using avoidable cancer mortality as an indicator of the quality of medi-cal services in Lithuania. Any division of the indicators of avoidable mortality, used in this study, is to some extent ar-tificial. Despite this limitation, the findings of our study are valuable because they prove that the quality medical health care service significantly contributes to the prevention of untimely and unavoidable deaths. Furthermore, findings of our study can be used to facilitate further improvements in the population health level.
CONCLUSIONS
In Lithuania, a remarkable reduction in avoidable cancer mortality over the past decade has been noted. However, the rate of reduction was slower for mortality avoidable by primary or secondary prevention methods than for that preventable by direct medical care, indicating that there is a need to put more effort towards primary and secondary prevention.
ACkNOwLEDGEMENT
Financial support from the Research Council of Lithuania (grant No. SIN-14/2010) is gratefully acknowledged.
Received 2 December 2011 Accepted 20 December 2011
References
1. Rutstein DD, Berenberg W, Chalmers TC, Fishman AP, Perrin EB, Zuidema GD. Measuring the quality of medi-cal care: second revision of tables of indexes. N Engl J Med. 1980; 302: 1146.
2. Mackenbach JP, Bouvier-Colle MH, Jougla E. “Avoid-able” mortality and health services: a review of aggre-gate data studies. J Epidemiol Commun Health. 1990; 44: 106–11.
3. Gaizauskiene A, Gurevicius R. Avoidable mortality in Lithuania. J Epidemiol Commun Health. 1995; 49: 281–4.
5. Gaizauskiene A, Westerling R. A comparison of avoid-able mortality in Lithuania and Sweden 1971–1990. Int J Epidemiol. 1995; 24: 1124–31.
6. Nolte E, McKee M. Measuring the health of nations: analysis of mortality amenable to health care. BMJ. 2003; 327: 1129.
7. Nolte E, McKee M. Population health in Europe: how much is attributable to health care? World Hosp Health Serv. 2004; 40: 12–14, 40, 42.
8. Simonato L, Ballard T, Bellini P, Winkelmann R. Avoidable mortality in Europe 1955–1994: a plea for prevention. J Epidemiol Commun Health. 1998; 52: 624–30.
9. Westerling R, Smedby B. The European Community ‘avoidable death indicators’ in Sweden 1974–1985. Int J Epidemiol. 1992; 21: 502–10.
10. Humblet PC, Lagasse R, Leveque A. Trends in Belgian premature avoidable deaths over a 20-year period. J Epi-demiol Commun Health. 2000; 54: 687–91.
11. Treurniet HF, Boshuizen HC, Harteloh PP. Avoid-able mortality in Europe (1980–1997): a comparison of trends. J Epidemiol Commun Health. 2004; 58: 290–5.
Giedrė Smailytė, Laurynas Pareigis
IŠVENGIAMO MIRTINGUMO NUO VĖŽIO POkYČIAI LIETUVOJE 1992–2008 METAIS
Santrauka
Tyrimo tikslas – įvertinti sveikatos priežiūros sistemos laimėjimus
Lietuvoje mažinant išvengiamą mirtingumą pagal mirtingumo nuo vėžio pokyčius 1992–2008 metais.
Medžiaga ir metodai. Išvengiamo mirtingumo nuo vėžio
ana-lizei buvo panaudoti Lietuvos Vėžio registro duomenys apie miru-siuosius nuo vėžio 1992–2008 metais. Įvertinti bendri ir kai kurių vėžio lokalizacijų mirtingumo rodikliai. Standartizuoti mirtingumo rodikliai apskaičiuoti vyrams ir moterims. Mirtingumas vertintas 5–75 metų amžiaus grupėje. Skaičiavimams naudoti kasmetiniai Lietuvos statistikos departamento duomenys apie gyventojų skaičių pagal amžių ir lytį.
Rezultatai. Abiejų lyčių mirtingumas nuo vėžio mažėjo
nuo-sekliai. Ryškesnis mažėjimas nustatytas tarp moterų (po + 1,03 % per metus) nei tarp vyrų (po 0,83 % per metus). Mirtingumas nuo vėžio, išvengiamas dėl gerėjančio gydymo (tretinė profilaktika), nuo 1992 m. mažėjo po daugiau nei 2 % per metus tarp vyrų ir tarp moterų, o mirtingumas, išvengiamas dėl pirminės profilaktikos, mažėjo tik tarp vyrų. Mirtingumas, išvengiamas dėl antrinės profi-laktikos, mažėjo tarp moterų ir didėjo tarp vyrų.
Išvados. Lietuvoje nustatytas išvengiamo mirtingumo nuo vėžio
mažėjimas. Mirtingumo nuo vėžio, išvengiamo dėl pirminės ir antri-nės profilaktikos, mažėjimas buvo ne toks ženklus kaip mirtingumo, išvengiamo dėl gerėjančių gydymo priemonių. Šie duomenys rodo pirminės ir antrinės profilaktikos priemonių tobulinimo poreikį.
Raktažodžiai: išvengiamas mirtingumas, mirtingumas nuo