Spain Trade in View of Some Migratory and Economic Considerations
Sara Ojeda-Gonzalez
1, Antonio Mihi-Ramirez
2, Jesus Arteaga Ortiz
3, Eduardo Cuenca-Garcia
41, 2, 4University of Granada
Calle Paz, 18, 18002 Granada, Spain
E-mail. sara.ojeda@ulpgc.es, amihi@ugr.es, ecuenca@ugr.es
3University of Las Palmas de Gran Canaria
c/ Juan de Quesada, 30 35001 Las Palmas de Gran Canaria E-mail. jarteaga@ulpgc.es
http://dx.doi.org/10.5755/j01.ee.29.1.19387
The importance of trade and migration flows has become pivotal in times of frequent global crises. This paper analyzes how migration and other vital economic factors explain international trade. The methodology that is subject of our study consists of a panel data analysis of trade processes measured by export from Spain and import to Spain for 90 countries and covers the period 1998–2015 with respect to immigration and other economic variables. The results show that immigration influences international trade for both sending and receiving countries. On a more detailed level, an increase of the number of immigrants [in Spain] by one per cent results in a growth of Export [from that country] by 0.3 per cent and to a rise of Import [to that country] by 0.303 per cent, respectively. Similarly, the results confirm the measure of the "number of annual hours worked" as an excellent indicator to depict the role of employment in the most recent economic changes and developments [outlook]. We also find an indirect evidence that labour productivity is relevant for international trade what supports the existence of the “Say’s Law” in terms of Immigration processes. Besides, our paper shows how labour- intensive countries’ environment favors export [from Spain], and by contrast, capital-intensive countries’ environment facilitates import [to Spain]. Finally, the results add empirical evidence showing how the lack of technological infrastructure plays the role of a non-tariff trade barrier, whereas the membership in an integrated economic area such as EU reduces trade costs, providing incentives for exporters and importers of any particular country.
Keywords: International Trade; Migration; Labour and Capital Share; ICT Assets; Non- Tariff Barriers.
Introduction
Due to recent crises, the largest increase of international migration and the world’s trade slowdown, the debate on both trade and migration has undergone considerable and renewed interest.
Trade and migration contribute decisively to the development of any economy (Peri, 2016; Jansen & Piermartini, 2009; Borjas et al., 1996), so traditionally there have been numerous studies analyzing interactions between trade and migration and other economic considerations (Mihi-Ramirez et al., 2016; Genc et al., 2011; Hijzen & Wright, 2010; Jansen & Piermartini, 2009; Gould, 1994).
In this paper, we analyze interactions between exports, imports, migration and other relevant and novel economic factors [measures].
In general terms, trade effects [i.e. export and import effects] are asymmetric to a large extent, mainly by virtue of the existence of trade barriers (Genc et al., 2011). Moreover, it varies considerably across the countries, in particular when migration flows are considered.
Migration plays an important role in affecting and altering the developmental space which is related to migration processes ((Devadason & Subramaniam, 2016; de Haas, 2009). In that sense, migration exerts certain impact on the economic, institutional, social and cultural
characteristics of receiving and sending countries (Mihi-Ramirez et al., 2017).
Moreover, another relevant issue is the number of hours worked by any given nation, because it simply impacts on their well-being. Measuring the characteristics and dynamics of trends in the hours worked in any particular country is therefore important when monitoring economic relations between countries as well as when analyzing economic changes and developments (Greenwood, 2001).
Furthermore, there is an extensive research literature on the role that trade barriers [both tariff and non-tariff ones], play in reducing trade costs and stimulating trade (Andrews et al., 2017; Genc et al., 2011; Greenwood, 2000; Bougheas et al., 1999). Regarding non-tariff barriers, factors such as geographical distance and physical infrastructure were traditionally considered as trade costs. What is more, also other barriers could be regarded pivotal (Gould, 1994), for example the lack of technology infrastructure, as reflected by lower ICT Capital Compensation in GDP1 (ICT2 Capital Share), which is a notable example of a non-tariff barrier, because it negatively affects effortlessness in supplying goods and services to global markets and therefore increases the relative cost of getting them to market (Anderson &
1Gross Domestic Product
Wincoop, 2004). Also, the membership of an economic and well-integrated region, such as European Union (EU) might be viewed as the lack of barriers to trade, what typically exerts sort of strong impact on the balance of export and import for any given country (Andrews et al., 2017; Moise & Le Bris, 2013; Anderson & Wincoop, 2004; Bougheas et al., 1999).
In this paper, we try to show how these economic considerations can explain export and import. Therefore, when conducting our study we aim at finding an answer to the question: how migration and other economic factors affect international trade.
It is therefore appropriate to apply as a method for our study - a panel data analysis so that it more profoundly explains trade flows and its characteristics [i.e. export and import for Spain and its 90 partner-countries], covering the period 1998–2015, and regarding the role of migration processes (and more specifically immigration) and some relevant and novel economic factors i.e. Total annual hours worked, Share of Total Labour Compensation in GDP, Share of Total Capital and some trade barriers such as the lack of ICT infrastructure and membership of the integrated economic region [i.e. EU membership or its lack].
The rest of the paper is structured as follows: the next section provides theoretical framework on how migration and other economic factors may influence export and import. The following section regards methodology of our study and provides a detailed description of data that this research falls back on. In the final section we discuss our findings and more relevant conclusions [recommendations].
Theoretical Background
As a preliminary remark, what is worth underlining is that trade and migration play a critical role for the economy in the most countries, especially in export-oriented countries or those that belong to an integrated economic area as the European Union, EU, where migrations’ flows have become increasingly rife (Devadason & Subramaniam, 2016).
International trade is crucial for economic growth (Hung et al., 2004), but we shell also take into account other important factors such as migration (Peri, 2016; Hijzen & Wright, 2010).
The Heckscher-Ohlin model, shows us how higher differences in relative country’s factors endowments [i.e. migration or FDIs] serve to even out differences and therefore influence the trade exchange since they contribute to the overall balance of relative factors between countries (Hijzen & Wright, 2010; Gould, 1994; Mundell, 1957).
Furthermore, the migration systems theory posits that factors such as migration flows, export and import contribute to connect and integrate the sending and receiving countries in a relatively stable manner (Castles & Miller, 2009; Jennissen, 2004). For instance, migration has an important effect on the labour market and on the growth, with the latter leading to a significant change in trade flows in the form of an indirect impact (Sanderson & Kentor, 2008).
Moreover, the migration theory of circular cumulative causation posits that these changes occur gradually. Thus, once migration becomes operational the whole process has
a tendency to perpetuate itself. In that sense, it would be sort of a circular and cumulative process as it cycles its way to infinity (King, 2012).
In addition, several studies address issues showing that international trade could be understood either as a substitute (Schiff, 1994; Taylor, 1996) or as a complement of migration flows (Mihi-Ramirez et al., 2016; Genc et al., 2011).
Therefore, for the purpose of this research, the hypothesis 1 (H1) may now be formulated as follows: immigration affects export and import.
Among various working time indicators, statistics on total annual hours worked (TH) is the one that the best reflects new economic developments – and also increases their understanding (Greenwood, 2001). TH is the preferred measure of labour input in this study because unlike conventional measures of employment it incorporates variations in part-time and part-year employment, in annual leave, in paid sick and other types of leaves, as well as in flexible daily and weekly working schedules. Therefore, it is a more flexible measure of employment which accurately addresses the relevance of working population for the entire accounting year. What is more to the point, TH is used as a denominator in the labour productivity equation, and is calculated as an output per hour worked. Therefore, TH can be perceived as a proxy for productivity.
This perspective is potentially revelatory and innovative, but surprisingly it has received only little attention in the literature. According to the classic economic theory “supply creates its own demand” -Say's Law- (Keynes, 1936: 24). In turn, when it comes to immigrants, they can boost domestic productivity by increasing labour demand and spending their disposable incomes on local goods and services (Bodvarsson et al., 2008). But also, immigrants demand their own supply of goods and services from their origin countries and it also impacts the export and import. Moreover, skilled immigrants produce relatively more products/goods/services per person than unskilled workforce, so they contribute to a higher productivity in any given country and to the more efficient use of its factor endowments because such countries that are subject of migrants’ inflows can extract relatively more value from their resources (Borjas, 2005; Greenwood, 2001). This also impacts the terms of trade of those countries, and therefore also export and import.
This is why, the hypothesis 2 (H2) may now be formulated as follows: total annual hours worked affect export and import.
Resource endowments include, among others, labour and capital. The ‘labour share’ reflects the proportion of labour income in relation to total income. Capital resources include infrastructure and production capacity.
Therefore, for the purpose of this research, the hypothesis 3 (H3) may now be formulated as follows: ‘labour and capital share’ influence export and import [i.e. trade exchange].
Typically, barriers to trade impact the balance of export and import for a given country (Andrews et al., 2017; Anderson & Wincoop, 2004; Bougheas et al., 1999). Moreover, “the largest component of the cost of trading goods across national borders” are non-tariff barriers (Andrews et al., 2017: 1750). A lack of technology infrastructure, as reflected by lower ICT Capital Compensation in GDP (ICT Capital Share), is a notable example of a non-tariff barrier (Anderson & Wincoop, 2004; Bougheas et al., 1999) because it negatively affects effortlessness in supplying goods and services to global markets and therefore increases the relative cost of getting them to market. As a natural consequence of that prices for those products/services in countries with non-tariff barriers to trade are usually higher when compared with countries that lack no-tariff barriers [i.e. in general terms]. This, in turn, reduces country’s competitiveness on the global market and further diminishes the scale of export. Investment in technology assets can help to lower the barriers [to trade]. For example, investments in technology infrastructure (via ICT assets or higher R&D 3share in GDP /GERD4/) can increase the capital base of any particular country and reduce the price of getting its goods/services to global markets.
The hypothesis 4 (H4) may now be formulated as follows: The existence of ICT assets (measured by ICT Capital Compensation in GDP) influences export and import.
What is also worth mentioning is that the existence of a common border [i.e. single external border] between two countries is typically reflected in the gravity model and is quantified in the form of a proxy that measures and expresses
trade costs (Andrews et al., 2017; MoIse & Le Bris, 2013; Bougheas et al., 1999). In this paper, the membership to EU is viewed as a way of the reduction of trade barriers, which encourages export and import for any given country. Therefore, this qualitative information is also included as a proxy variable [in our model] so that it better explains trade exchange cost ad valorem.
Therefore, for the purpose of this research, the hypothesis 5 (H5) may now be formulated as follows: membership to EU influence exports and imports.
Methodology
This section provides a set of econometric estimates in order to better understand and explain export and import flows in destination country i.e. from and to Spain and the role that migration processes (and more specifically immigration) and some other economic factors i.e. Total annual hours worked, Share of Total Labour Compensation in GDP, Share of Total Capital Compensation in GDP technological advancement measured through ICT assets’ share in GDP at origin countries play in their performance and interpretation. The data used in this article measure and explain Export/Import from/to Spain over the period of 18 years, covering the period 1998–2015. Actually, this is the most recent period which is long enough to conduct a panel analysis, on which this empirical study is based upon.
In this article, the flows of goods and services, better known as export and import, are explained by some typical economic variables that are cautiously selected taking into account various migration theories and economic conceptual frameworks and considerations.
In the table below, you will find a description of individual variables that have been used to perform the analysis.
Table 1 Description of Individual Variables that Are Subject to the Analysis
3 Research and Developtment
4 Gross domestic expenditure on research and development
Variables Concept Previous studies that sustain
the use of these variables
EFS (Export from Spain)
Export from Spain (EFS) represents the value of all goods and other market services provided by Spain to other countries (in millions of US dollars). “They include the value of merchandise, freight, insurance, transport, travel, royalties, license fees, and other services, such as communication, construction, financial, information, business, personal, and government services. They exclude compensation of employees and investment income (formerly called factor services) and transfer payments”. Export from Spain (EFS) data were obtained from World Bank's WDI database (2017)
Andrews et al., (2017); Caleb et al., (2017); Devadason & Subramaniam, (2016); Mihi-Ramirez et al., (2016); Anderson & van Wincoop (2004); Kohli (2002).
ITS (Import to Spain)
Import to Spain (ITS) represents the value of all goods and other market services received from each country (that is subject of our study) separately (in millions of US dollars). ITS includes “the value of merchandise, freight, insurance, transport, travel, royalties, license fees, and other services, such as communication, construction, financial, information, business, personal, and government services. They exclude compensation of employees and investment income (formerly called factor services) and transfer payments”. Export from Spain (EFS) and Import to Spain (ITS) data were obtained from World Bank's WDI database (2017)
Devadason & Subramaniam, (2016); Tse et al., (2015); Bodvarsson et al., (2008); Genc
et al., (2011); Borjas et al.,
(1996).
RVS (Immigration)
The data on Immigration is collected from The Residential Variations Statistic (RVS). RVS is compiled by the Spanish Statistical Office (INE) and is “based on the exploitation of the information related to additions and deletions in terms of changes of (exterior) residences registered in the Municipal Registers (in number of persons), with a date of variation of the reference year, and reflected in the INE's census database up to and including March (inclusive) of the year following the study year” (INE, 2017).
Rapoport et al., (2017); Huete et al., (2013), Hierro & Maza, (2010); Bover & Arellano (2002); Rodriguez et al., (2002).
TH (total hours)
Total annual hours worked (in millions of hours worked). The measure of annual hours worked covers „all hours dedicated to producing the goods and services accounted for in production statistics in any given country during the accounting year”. Data were obtained from World Bank's WDI database (2017).
Zhang et al., (2017); Lui et al.,
Source: own elaboration.
Also, some data i.e. Total annual hours worked (TH), Share of ICT Capital Compensation in GDP (ICTCS), Export from Spain (EFS), Import to Spain (ITS) were transformed into logarithmic returns to better reflect the
normality and provide more accurate results (Feridun, 2007). To envision the characteristics of the data, see the table below.
Table 2 Variables Characteristics (Data Description)
vars Source n mean sd median trimmed mad min max range skew kurtosis se
EFS WBWDI 1596 2207554.93 5804170 387376.92 784986.65 510932.23 2955.88 53510400 53507444 4.85 27.98 145285
ITS WBWDI 1596 2934763.79 6595179 679780.14 1311529.8 965270.21 2.23 59906153.3 59906151 4.26 21.36 165085
RVS SNSI 1620 4837.27 12303 726.50 2134.89 965.91 0.00 196985 196985 6.36 60.44 305.69
TH TED 992 38363 54357.03 9987.8 26715.79 13089.99 297.1 266499.8 266202.70 2.06 4.17 1725.84
LS TED 1620 0.51 0.09 0.52 0.52 0.07 0.09 0.74 0.65 -1.01 1.74 0.00
CS TED 1620 0.49 0.09 0.48 0.48 0.07 0.26 0.91 0.65 1.01 1.74 0.00
ICTCS TED 1362 2.96 1.52 2.90 2.87 1.47 0.00 8.97 8.97 0.75 1.00 0.04
EU GI 1620 0.30 0.46 0.00 0.25 0.00 0.00 1.00 1.00 0.87 -1.24 0.01
Source: own elaboration.
To conduct the subsequent empirical part of this article, a longitudinal data study is assumed to be the most proper methodology (Edquist & Henrekson, 2017; Akcigit & Stantcheva, 2016; Deng & Wang, 2016; Tse et al., 2015; Najarzadeh et al., 2014; Mayda, 2009). It allows for studying Spanish export and import at the level of 90 countries. The results will later allow for verification of the main hypotheses and in particular whether there is a relationship between immigration and other economic variables (RVS) and both Export from Spain (EFS) and Import to Spain (ITS).
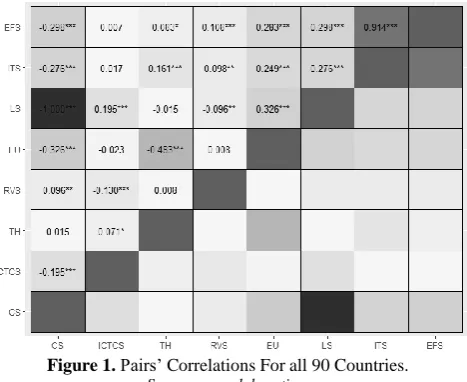
In all models (that form part of the empirical study) Export from Spain (EFS) and Import to Spain (ITS) are explained with the use of panel regressions. Countries are represented as panels and years as times (Pearlman, et al., 2017; Harris & Moffat, 2016; Gayle et al., 2015; Tambe, & Hitt, 2012; Mayda, 2009). Three alternative specifications, using pooled (OLS), fixed effects (FE) and random effects (RE) modeling have been adopted and the most appropriate are selected. To have a first look at the data, the correlation matrix at the level of all 90 countries has been computed. We can visualize the data in the
graphical form what makes it easier to understand. Moreover, asterisks reflect whether pairs’ correlations are statistically significant /see Figure 1/.
Figure 1. Pairs’ Correlations For all 90 Countries. Source: own elaboration.
Variables Concept Previous studies that sustain
the use of these variables
LS (labour share)
The share of Total Labour Compensation in GDP. “The labour share measures in the proportion of labour income relative to total income. It is calculated by using compensation of employees and mixed-income data from the national accounts”. Data were obtained from World Bank's WDI database (2017) (in percent)
Edquist & Henrekson, (2017); Hijzen & Wright, (2010); Gould (1994).
CS (capital share) The share of Total Capital Compensation in GDP, calculated as 1 minus the labour share. The data were obtained from World Bank's WDI database (2017).
Corrado et al., (2017), Edquist & Henrekson, (2017).
ICTCS (ICT assets’ compensation in GDP)
The share of ICT Capital Compensation in GDP. ICT capital assets “include computer hardware and equipment, telecommunication equipment and computer software and services. For most OECD economies, investment data on ICT assets is available through the national accounts, while for other countries it is estimated using data on total ICT by The World Economic Forum, or proxied using trade data according to the commodity flow approach. Data on this indicator is available for a smaller set of countries due to the limited availability of data on ICT assets” (OECD, 2017; World Economic Forum, 2016) (in percent)
Andrews et al., (2017); Corrado
et al., (2017); Edquist & Henrekson, (2017); Akcigit et al.,
(2016). Najarzadeh et al., (2014); Bougheas et al., (1999).
EU (whether or not belongs to the European Union)
EU membership is a dummy variable which takes the value 0 or 1 and reflects the participation of an individual country to the EU structures.
Pernica, (2017); Peri (2016); Feridun (2008); Bougheas et al.,
The only pairs of variables that are highly correlated are the Export from Spain (EFS) and Import to Spain (ITS), Labour Share (LS) and Capital Share (CS) however they were never included together in any of the performed models. Perfect positive correlation (a correlation coefficient of +1) between capital share (CS) and labour share (LS), results from the fact that that CS is calculated as 1 minus the labour share (LS). There’re no other pairs’ variables with an unusually high coefficient of correlation and therefore all selected variables can be used in the performed models. To see whether there is no collinearity in our model we check the VIF5 [for every particular model]. All the VIFs are below the value of 5 which means that there is no collinearity between exogenous variables in question (as selected predictors).
Further, the regression coefficients for the pooled model specification, the fixed effects model specification and the random effects model specification are derived. Set out below are the tables 3 and 4 which summarize the results of the performed panel regressions for both ETS and ITS, respectively.
Table 3
Panel Regression Model. Export from Spain (EFS) is Regressed on RVS, GDP, OHW, CS, ICTCS, DIS, LAN, and EU
Variables Model
OLS (pooling) FE (fixed effects) RE (random effects) RVS (Residential Variations Statistic) 0.330*** (0.02) 0.30*** (0.02) 0.346*** (0.02) TH (Total annual hours
worked in millions of hours worked) 0.321*** (0.03) 2.705*** (0.19) 0.970*** (0.103)
CS (capital share in GDP) -0.071*** (0.005)
0.017** (0.005)
0.008 (0.006) ICTCS (ICT assets’
compensation in GDP)
0.282*** (0.059) -0.06· (0.035) -0.055 (0.037) EU (EU member or not –
a dummy variable)
0.988*** (0.09) 2.595*** (0.358) CONSTANT 10.97*** (0.09) 0.367 (1.13) F test for i.e.*
p-value 114.72 0.000† Hausman Test p-value 90.004 0.000†† F-statistic 209.958 0.000 178.482 0.000 114.981 0.000
Adjusted R-squared 0.5261 0.4111 0.3772
† If the p-value is < 0.05 then the fixed effects model is a better choice †† If this number is > 0.05 then we use random effects
***, **, *, · indicates coefficient is significant at 0,1%, 1%, 5% and <10% level of significance respectively. Endogenous variable/regressand) is the Import to Spain (denoted as ITS). Hausman test is used to assess whether Fixed Effects (FE) model is better than Random Effects (RE) model. F test for individual effects
F-statistic is used to test the overall model fit. a p-value <0.05 means that all variables (jointly) explain the variability of the response variable. Numbers in parentheses are a standard error.
The following is the same study for ITS. Notice that Labour Share (LS) is used in this model instead of capital share (CS). This is due to the fact that capital (in origin countries) is more important for a country that wants to export its goods and services to another country.
5In statistics, the variance inflation factor (VIF) quantifies the severity of multicollinearity in an ordinary least squares regression analysis. It provides an index that measures how much the variance (the square of the estimate's standard deviation) of an estimated regression coefficient is increased because of collinearity.
Table 4
Panel Regression Model. Import to Spain (ITS) is Regressed on RVS, GDP, OHW, LS, ICTCS, DIS, LAN, and EU
Variables Model
OLS (pooling) FE (fixed effects) RE (random effects) RVS (Residential Variations Statistic) 0.291*** (0.02) 0.302*** (0.02) 0.342*** (0.02) TH (Total annual hours
worked in millions of hours worked) 0.623*** (0.03) 2.895*** (0.19) 1.202*** (0.1)
LS (labour share in GDP) 0.028*** (0.005)
-0.044*** (0.005)
-0.036*** (0.006) ICTCS (ICT assets’
compensation in GDP)
0.494*** (0.06) 0.036 (0.04) 0.046 (0.038)
EU (dummy) 1.08***
(0.094) 2.441*** (0.35) CONSTANT 3.423*** (0.350) 0.697 (1.057) F test for i.e.*
p-value 112.99 0.000† Hausman Test p-value 83.42 0.000†† F-statistic 250.599 0.000 212.545 0.000 142.554 0.000
Adjusted R-squared 0.56547 0.4523 0.42467
† If the p-value is < 0.05 then the fixed effects model is a better choice †† If this number is > 0.05 then we use random effects
Signif. codes: 0 ‘***’ 0.001 ‘**’ 0.01 ‘*’ 0.05 ‘·’ 0.16
The coefficients [for all models] are jointly significant as reflected in the F-stat (Prob > F = 0.0000).
To select the best model, three steps have been carried out. First, the F test (for individual effects) following the pooling OLS and the fixed effects estimations has been considered to verify whether the fixed panel specification is superior to the pooled OLS (i.e. to check which one is a better choice). Notice, that the fixed effects model specification is a better choice only when the p-value is < 0.05. Also, the Hausman (1978) test has been applied in order to decide whether the random effect model is to be accepted against the fixed effect model or not. The null hypothesis of that test says that the preferred model is the random effects vs. the alternative hypothesis which is contrary to the null hypothesis (Greene, 2008). It essentially provides an answer whether the unique errors are correlated with the regressors, with the null hypothesis (H0) assuming that they are not correlated. If the p-value for the Hausman test is >0.05 then the random effects (RE) model is a better choice.
The above-mentioned tests are conducted to arrive at the appropriate choice of proper selection (Table 5).
Table 5 Results of the Tests for Determining Proper Models’
Specifications
Pooled vs. Fixed;
F test
Pooled vs. Random
LM test
Fixed vs. Random
Hausman test
Choice of the selection
ALL 90 Prob>F = 0.000;
FE is better than OLS
chibar2(1) = 71.3
Prob>chibar2 = 0.0000
RE is better than OLS
chi2(5) = 298.43 Prob>chi2 = 0.000
FE is better than RE
FE
6 ***, **, *, · indicates coefficient is significant at 0,1 %, 1 %, 5 % and <10 % level of significance respectively. Endogenous variable/regressand) is the Export from Spain (denoted as EFS). Hausman test is used to assess whether Fixed Effects (FE) model is better that Random Effects (RE) model. F test for individual effects
The results show that the responsiveness of the outflow and inflow of goods and services from and to Spain (respectively) vary for different countries due to the above-mentioned countries’ fixed effects – as the fixed effects model specification turned out to be the most appropriate one in each case.
Findings
a. Immigration (RVS): The premise of hypothesis 1 is met. Immigration has a positive effect on both Export from Spain and Import to Spain, the results are clearly more pronounced in the case of Import to Spain, though. As it might have been expected, at the level of pooled model’s specification one-unit change in immigration (RVS) leads to a rise in Export from Spain (EFS) by 0.3 percent, and to a rise in Import to Spain (ITS) by 0.303 percent, respectively.
In this sense, a positive inflow of foreigners (newcomers) to Spain (because that’s actually what RVS expresses) can be viewed as a catalyst that enhances networking what in turn facilitates foreign trade (in this case both Export from Spain and Import to Spain). In this sense, we could come to the conclusion that these results add empirical evidence to ‘the migration systems theory’ and ‘the migration theory of circular cumulative causation’ since trade flows contribute to a connection and integration of both sending and receiving countries [over the time].
b. Total annual hours worked (TH)
Total annual hours worked (TH) exert a positive influence on both Export from Spain (EFS) and Import to Spain (ITS). The results show us that TH variable is related to the balance of trade (BoT) of any country in that the number of hours worked favors both Export from Spain (EFS) and Import to Spain (ITS).
The results of our study show that for all models’ specifications TH (at origin countries) turned out to be positively associated with export and import at the destination (i.e. in our case: Spain). Therefore, it confirms the hypothesis 2. Moreover, the coefficients were statistically significant in all cases, meaning that in reality the number of annual hours worked (TH) at origin exerts an influence on export and import in destination country (i.e. in Spain). Put differently, in numerical terms, one unit change in TH (in origin country) leads to a rise in Export from Spain (EFS) by 2.705 percent, and to a rise in Import to Spain (ITS) by 2.895 percent, respectively. Again, the impact seems to be more pronounced on the supply-side (at destination) what is consistent with the economic theory, in particular with the law of markets (better known as Say's law), which in classical economics, posits that aggregate production creates an equal quantity of aggregate demand, and hence the supply-side of the market is always a dominant force that governs the flow of goods/services on global markets.
The results provide an indirect evidence that labour productivity is pivotal for foreign trade and they also support the existence of the “Say’s Law” in terms of migration flows (i.e. Immigration in particular). As it was highlighted earlier TH is used in the labour productivity equation, calculated as output per hour worked. Therefore, TH can be perceived as a proxy for labour productivity. In view of economic considerations, the productivity plays an important role in foreign trade.
c. Share of Total Labour Compensation in GDP (LS) and Share of Total Capital Compensation in GDP (CS)
The premise of the Hypothesis 3 is also met. The results show that labour-intensive countries favor Export from Spain, and by contrast, capital-intensive countries favor Import to Spain (ITS). Put differently, one percent change in labour share (LS) at origin country results in a decline in Export from Spain (EFS) by 0.017 percent, and in a decline in Import to Spain (ITS) by 0.044 percent, respectively. In turn, one percent change in capital share (LS) at origin country leads to a rise in Export from Spain (EFS) by 0.017 percent, and to a rise in Import to Spain (ITS) by 0.044 percent, respectively. Notice, that capital share is calculated as 1 minus the labour share. The results might be interpreted through the lens of Spanish trade exchange characteristics, i.e. the structure of the Spain trade, whether it exports or not kind of minimally processed goods in relation to highly processed goods etc.
d. Share of ICT Capital Compensation in GDP (ICTCS) Our results for pooling model [OLS] show that ICT assets at origin countries favor both Exports from Spain (ETS) and Import to Spain (ITS). Also, for the pooled model specification they turned out to be positive and statistically significant, supporting the hypothesis 4. For both pooling and fixed effects models, this phenomenon turns out to be more pronounced for Import. In fact, when it comes to Export from Spain (EFS), as indicates the fixed effects model there is a slight negative association of ICTCS and EFS, which weakens the overall meaning of that finding. It can also be viewed from the perspective of an origin country (a country that wants to export its goods/services to Spain ), that ICT assets which include computer hardware and equipment, telecommunication equipment and computer software and services, are much more required to organize export to Spain than import from Spain, the latter being left over rather to Spanish entrepreneurs and exporters (resting rather on the shoulders of Spanish entrepreneurs and exporters, and hence the less pronounced or even negative association of ICTCS and EFS).
e. EU membership, the dummy variable that reflects whether or not countries are members of European Union (EU).
In view of the results, the EU membership plays a key role affecting Spanish trade exchange. In this case, EU membership might be viewed as the lack of barriers to trade that typically exert a strong impact on the balance of exports and import for any given country. Policies that restrict import or subsidize export change the relative prices of those goods, making them more or less attractive to import or export.
Conclusions
factors which without doubt exert certain influence over foreign trade [in general terms].
The results show that immigration encourages foreign trade, adding empirical evidence to the migration systems theory and the migration theory of circular cumulative causation, and it also facilitates the integration of sending and receiving countries and that it is a cumulative process over the time.
In addition, the total annual hours worked at origin country leads to a rise in export and import in destination country (i.e. Spain). It is in line with the law of markets of classical economic theory. Further, the results provide an indirect evidence that labour productivity is relevant for international trade exchange and that it also supports the existence a “Say’s Law” in view of immigration.
Also, likewise the Heckscher-Ohlin model, the resource endowments and competitiveness’ characteristics [as illustrated in this paper by the Spanish example]
determine foreign trade exchange. In this sense, the results show that labour-intensive countries favor export from Spain, and by contrast, capital-intensive countries favor import from Spain.
Furthermore, the results show empirical evidence on how the lack of technological infrastructure [reflected by ICT assets’ share in GDP] acts as a non-tariff trade barrier. The higher the ICT assets’ share in GDP [in origin country] the higher is also import from Spain. Put differently, the lack of technological infrastructure in countries of exportation to Spain implies a higher burden in supplying goods and services to Spain. Consequently, countries that invest in ICT assets, R&D, and GERD can increase their competitiveness on global markets.
Last but not least, our results show empirical evidence on how EU membership reduces the cost of international trade.
References
Akcigit, U., Baslandze, S., & Stantcheva, S. (2016). Taxation and the international mobility of inventors. The American Economic Review, 106(10), 2930–2981. https://doi.org/10.1257/aer.20150237
Anderson, J. E., & van Wincoop, E. (2004). Trade Costs. Journal of Economic Literature, 42(3), 691–751. https://doi.org/10.1257/0022051042177649
Andrews, M., Schank, T., & Upward, R. (2017). Do foreign workers reduce trade barriers? Microeconomic evidence. The world economy, 40, 1750–1774. https://doi.org/10.1111/twec.12486
Bodvarsson, O. B., Van den Verk, H. F., Lewer, J. J. (2008). Measuring Immigration's Effects on Labour Demand: A Reexamination of the Mariel Boatlif. Labour Economics 15(4), 560–574. https://doi.org/10.1016/j.labeco. 2008.04.003
Borjas, G. J., Freeman, R. B., & Katz, L. F. (1996). Searching for the Effect of Immigration on the Labour Market. The American Economic Review, 86(2), 246–251.
Borjas, G. J. (2005). The labour market impact of high-skill immigration. The American Economic Review, 95(2), 56–60. https://doi.org/10.1257/000282805774670040
Bover, O., & Arellano, M. (2002). Learning about migration decisions from the migrants: Using complementary datasets to model intra-regional migrations in Spain. Journal of Population Economics, 15(2), 357–380. https://doi.org/10.1007/s001480100066
Bougheas, S., Demetriades, P. O., Morgenroth, E. L. W. (1999). Journal of International Economics, 47, 169–189. https://doi.org/10.1016/S0022-1996(98)00008-7
Caleb, H. T., Yu, L., & Zhu, L. (2017). A Multimediation Model of Learning by Exporting: Analysis of Export-Induced Productivity Gains. Journal of Management, 43(7), 2118–2146. https://doi.org/10.1177/0149206315573998
Castles, S., & Miller, M. J. (2009). The Age of Migration: International Population Movements in the Modern World. Basingstoke: Palgrave Macmillan (4th edition).
Corrado, C., Haskel, J., & Jona Lasinio, C. (2017). Knowledge spillovers, ICT and productivity growth. Oxford Bulletin of Economics and Statistics, 79(4) 0305–9049. https://doi.org/10.1111/obes.12171
De Haas, H. (2010). Migration and Development: A Theoretical Perspective. International MigrationReview, 44: 227– 264. https://doi.org/10.1111/j.1747-7379.2009.00804.x
Devadason, E. S., & Subramaniam, T. (2016). International capital inflows and labour immigration: A heterogeneous panel application in Malaysian manufacturing industries. International Journal of SocialEconomics, 43(12),1420– 1438. https://doi.org/10.1108/IJSE-03-2015-0062
Deng, Z., & Wang, Z. (2016). Early-mover advantages at cross-border business-to-business e-commerce portals. Journal of Business Research, 69(12), 6002–6011. https://doi.org/10.1016/j.jbusres.2016.05.015
Edquist, H., & Henrekson, M. (2017). Do R&D and ICT affect total factor productivity growth differently? Telecommunications Policy, 41(2), 106–119. https://doi.org/10.1016/j.telpol.2016.11.010
Gayle, G. L., Golan, L., & Miller, R. A. (2015). Promotion, turnover, and compensation in the executive labour market. Econometrica, 83(6), 2293–2369. https://doi.org/10.3982/ECTA11020
Genc, M., Gheasi, M., Nijkamp, P. & Poot, J. (2011). The impact of immigration on international trade: a meta-analysis. Norface Migration, Discussion Paper No. 2011-20, 1–35.
Greene, W. (2008). Econometric analysis. Prentice Hall, Upper Saddle River, N.J.
Greenwood A. M. (2001). The hours that we work: the data we need, the data we get. Bulletin of Labour Statistics, Geneve.
Gould, D. M. (1994). Immigrant links to home country: empirical implications for U.S. bilateral trade flows. Review of Economics and Statistics 76, 302–316. https://doi.org/10.2307/2109884
Harris, R., & Moffat, J. (2016). The UK productivity puzzle, 2008–2012: evidence using plant-level estimates of total factor productivity. Oxford Economic Papers, 69(3), 529–549. https://doi.org/10.1093/oep/gpw057
Hausman, J. (1978). Specification tests in econometrics. Econometrica, 46, 1251–71. https://doi.org/10.2307/1913827 Hierro, M., & Maza, A. (2010). Per capita income convergence and internal migration in Spain: Are foreign-born
migrants playing an important role? Papers in Regional Science,89(1), 89–107. https://doi.org/10.1111/j.1435-5957.2009.00240.x
Hijzen, A., & Wright, P. W. (2010). Migration, trade, and wages. Journal of population economics, 23(4), 1189–1211. https://doi.org/10.1007/s00148-009-0241-z
Huete, R., Mantecon, A., & Estevez, A. (2013). Challenges in Lifestyle Migration Research: Reflections and Findings of the Spanish Crisis. Mobilities, 8(3), 331–348. https://doi.org/10.1080/17450101.2013.814236
Hung, J., Salomon, M., & Sowerby, S. (2004). International trade and US productivity. Research in International Business and Finance, 18(1), 1–25. https://doi.org/10.1016/j.ribaf.2004.02.005
National Statistics Institute. Spanish Statistical Office, INE (2017). Residential Variation Statistics. Available online http://www.ine.es/dyngs/INEbase/en/operacion.htm?c=Estadistica_C&cid=1254736177013&menu=ultiDatos&idp= 1254734710990
Jansen, M., & Piermartini, R. (2009). Temporary migration and bilateral trade flows. World Economy, 32(5), 735–753. https://doi.org/10.1111/j.1467-9701.2009.01167.x
Jennissen, R. P. W. (2004). Macro-Economic Determinants of International Migration in Europe. Amsterdam: Dutch University Press.
Lui, A. K., Ngai, E. W., & Lo, C. K. (2016). Disruptive information technology innovations and the cost of equity capital: The moderating effect of CEO incentives and institutional pressures. Information & Management, 53(3), 345–354. https://doi.org/10.1016/j.im.2015.09.009
Keynes, J. M. (1936). The general theory of employment, interest, and money. In Keynes, J.M. (2016). The general theory of employment, interest, and money. Atlantic, Atlantic Publishers & Dist.
King, R. (2012). Theories and Typologies of Migration: An Overview and a Primer. Willy Brandt Working Papers in International Migration and Ethnic Relations, Malmo University, 3 (12).
Kohli, U. (2002). Migration and Foreign Trade: Further Results. Journal of Population Economics, 15(2), 381–387. https://doi.org/10.1007/s001480100080
Mayda, A. M. (2009). International Migration: A Panel Data Analysis of the Determinants of Bilateral Flows. Journal of Population Economics, 23(4), 1249–74. https://doi.org/10.1007/s00148-009-0251-x
MoIse, E., & Le Bris, F. (2013). Trade costs - what have we learned? OECD Trade Policy Papers 150, 1–46.
Mihi-Ramirez, A., Cuenca-Garcia, E., & Miranda-Martel, M. (2016). Is there a causality between emigration and other mobility factors? A panel VAR model approach for Baltic and Scandinavian countries. Inzinerine Ekonomika-Engineering Economics, 27(3), 325–333. https://doi.org/10.5755/j01.ee.27.3.14395
Mihi-Ramirez, A., Kumpikaite-Valiuniene, V., & Cuenca-Garcia, E. (2017). An inclusive analysis of determinants of international migration. The case of European rich and poor countries. Technological and Economic Development of Economy, 3(4), 608–626. https://doi.org/10.3846/20294913.2017.1306726
Mundell, R. A. (1957). International trade and factor mobility. American Economic Review, 47(3), 321–335.
Najarzadeh, R., Rahimzadeh, F., & Reed, M. (2014). Does the Internet increase labour productivity? Evidence from a cross-country dynamic panel. Journal of Policy Modeling, 36(6), 986–993. https://doi.org/10.1016/j.j polmod.2014.10.003
OECD (2017). National Accounts Statistics. Available online http://stats.oecd.org/Index.aspx
Peri, G. (2016). Immigrants, productivity, and labour markets. The Journal of Economic Perspectives, 30(4), 3–29. https://doi.org/10.1257/jep.30.4.3
Pernica, M. (2017). Evaluation of the adequacy of government minimum wage valorization policy in the Czech Republic in 2017 in the European context. Oeconomia Copernicana, 8, 21–36. https://doi.org/10.24136/oc.v8i1.2
Rapoport, B., Steinmayr, A., & Trebesch, C. (2017). The effect of labour migration on the diffusion of democracy: evidence from the former Soviet Republic. American Economic Journal: Applied Economics, 9(3), 36–69. https://doi.org/10.1257/app.20150517
Rodriguez, V., Egea, C., & Nieto, J. A. (2002). Return migration in Andalusia, Spain. Population, Spaceand Place, 8(3), 233–254. https://doi.org/10.1002/ijpg.258
Sachs, J. D. (2016). Toward an International Migration Regime. The American Economic Review, 106(5), 451–455. https://doi.org/10.1257/aer.p20161064
Sanderson, M., & Kentor, J. (2008). Foreign Direct Investment and International Migration: A Cross-National Analysis of Less-Developed Countries. International Sociology, 23, 1985–2000. https://doi.org/10.1177/0268580908090726 Tambe, P., & Hitt, L. M. (2012). Now IT's personal: Offshoring and the shifting skill composition of the US information
technology workforce. Management Science, 58(4), 678–695. https://doi.org/10.1287/mnsc.1110.1445
Tse, C. H., Yu, L., & Zhu, J. (2015). A multimediation model of learning by exporting: Analysis of export-induced productivity gains. Journal of Management, 43(7), 2118–2146. https://doi.org/10.1177/0149206315573998
World Economic Forum (2016). The Global Information Technology Report 2016. Available online https://www.weforum.org/reports/the-global-information-technology-report-2016
World Bank's WDI database (2017). World Bank national accounts data, and OECD National Accounts data files. Available online http://databank.worldbank.org/data/home.aspx
Zhang, L., Chen, T., Yang, J., Cai, Z., Sheng, H., Yuan, Z., & Wu, H. (2017). Characterizing copper flows in international trade of China, 1975-2015. The Science of the total environment, 601, 1238. https://doi.org/10.1016/j. scitotenv.2017.05.216