Hardwood biochar and manure co-application to a calcareous soil
J.A. Ippolito
a,⇑, M.E. Stromberger
b, R.D. Lentz
a, R.S. Dungan
a aUSDA-ARS, Northwest Irrigation and Soils Research Laboratory, 3793 N. 3600E, Kimberly, ID 83341, United States b
Department of Soil and Crop Sciences, Colorado State University, Fort Collins, CO 80523-1170, United States
a r t i c l e
i n f o
Article history:
Received 1 December 2014
Received in revised form 10 May 2015 Accepted 13 May 2015
Available online xxxx
Keywords:
Biochar Manure Co-application Calcareous soil Nutrients
a b s t r a c t
Biochar may affect the mineralization rate of labile organic C sources such as manures via microbial com-munity shifts, and subsequently affect nutrient release. In order to ascertain the positive or negative priming effect of biochar on manure, dairy manure (2% by wt.) and a hardwood-based, fast pyrolysis bio-char were applied (0%, 1%, 2%, and 10% by wt.) to a calcareous soil. Destructive sampling occurred at 1, 2, 3, 4, 6 and 12 months to monitor for changes in soil chemistry, water content, microbial respiration, bac-terial populations, and microbial community structure. Overall results showed that increasing biochar application rate improved the soil water content, which may be beneficial in limited irrigation or rainfall areas. Biochar application increased soil organic C content and plant-available Fe and Mn, while a syner-gistic biochar–manure effect increased plant-available Zn. Compared to the other rates, the 10% biochar application lowered concentrations of NO3-N; effects appeared masked at lower biochar rates due to manure application. Over time, soil NO3-N increased likely due to manure N mineralization, yet soil NO3-N in the 10% biochar rate remained lower as compared to other treatments. In the presence of man-ure, only the 10% biochar application caused subtle microbial community structure shifts by increasing the relative amounts of two fatty acids associated with Gram-negative bacteria and decreasing Gram-positive bacterial fatty acids, each by1%. Our previous findings with biochar alone suggested an overall negative priming effect with increasing biochar application rates, yet when co-applied with manure the negative priming effect was eliminated.
Published by Elsevier Ltd.
1. Introduction
Biochar is a pyrolysis product that may be utilized as a soil amendment. Research has focused a great deal of attention on
bio-char application in highly weathered soil systems (e.g.,Lehmann
et al., 2003; Glaser et al., 2004; Novak et al., 2009; Hass et al., 2012; Major et al., 2012; Schomberg et al., 2012). However, the use of biochar in semi-arid and arid agricultural soils (which
com-prise over 2 billion hectares worldwide (Brady and Weil, 1999)) is a
relatively new, not extensively studied concept.
Van Zwieten et al. (2010)applied 10 Mg ha1of biochar to an
Aridisol, noting no change in soil fertility status. Yet others (Laird
et al., 2010a, 2010b; Brewer et al., 2012; Ippolito et al., 2012a, 2012b) have applied biochar (up to 40 Mg ha1) to Aridisols and Mollisols, and observed increases in soil extractable P, K, Mg, Fe,
and Ca, and decreases in NO3-N leaching. Increases in soil extracta-ble nutrient concentrations may have been due simply to biochar-borne elemental addition. However, the reduction in NO3-N leaching may have been due to nutrient retention in biochar
micropores (Kameyama et al., 2012), adsorption by biochar (Laird
et al., 2010b), biochar-induced microbial immobilization (Streubel et al., 2011; Sarkhot et al., 2012), or greater abundance
of microorganisms able to fix or denitrify N (Ducey et al., 2013).
Specific biochar effects on microbiological activity in arid and semi-arid soils have been mostly documented in laboratory
incu-bation studies. Increases in CO2evolution have been observed in
Mollisols receiving between 20 and 45 Mg biochar ha1
(Rogovska et al., 2011; Streubel et al., 2011; Smith et al., 2010)
and in Aridisols receiving 45 Mg ha1 (Smith et al., 2010).
Increases in CO2evolution have been attributed to biochar initially
containing easily degradable C compounds, and to a reduction in soil bulk density and subsequently an improvement in
microor-ganism habitat (Rogovska et al., 2011; Smith et al., 2010).
Ippolito et al. (2014)applied up to 200 Mg ha1
of biochar to an
Aridisol, also noting increases in CO2production over a 12 month
http://dx.doi.org/10.1016/j.chemosphere.2015.05.039
0045-6535/Published by Elsevier Ltd.
Abbreviations: DTPA, diethylenetriaminepentaacetic acid; EL, ester linked; FAME, fatty acid methyl ester; MRPP, multi response permutation procedure; NMS, nonmetric multidimensional scaling; PLFA, phospholipid fatty acid analysis.
⇑ Corresponding author.
E-mail address:[email protected](J.A. Ippolito).
Contents lists available atScienceDirect
Chemosphere
j o u r n a l h o m e p a g e : w w w . e l s e v i e r . c o m / l o c a t e / c h e m o s p h e r e
incubation study. Furthermore, the authors studied microbial com-munity composition, noting a shift toward more bacteria and less fungi with increasing biochar application. This shift was attributed to physiological stress favoring bacteria over fungi, biochar supply-ing labile C which favored fast growsupply-ing bacteria over fungi, or to biochar resulting in increased soil water retention and improving the microclimatic conditions favorable for bacteria over fungi. The above information suggests that biochars alone may not greatly improve nutrient retention in arid and semi-arid soils, and at excessive rates may cause shifts in microbial community composition. However, applying biochars at a proper application rate, with nutrient-rich materials such as manures, may provide some benefit in terms of improvements in soil fertility without compromising the microbial community composition.
Biochar co-application with manure has not been extensively studied, despite that manure is already commonly applied to
agri-culture soils (6.5 million hectares in the US;USDA, 2006) where
there is interest in also applying biochar. Thus, a need exists to identify the effects of biochar and manure soil co-applications. To this end, organic C sources such as manures, when added to soils, often leads to a positive priming effect due to increased microbial
activity (Sorensen, 1974) associated with supplied energy sources
and nutrient release. Furthermore, it is plausible that various rates of biochar can cause either a positive or negative priming effect of
added labile organic C sources (e.g.,Keith et al., 2011; Liang et al.,
2010; Hamer et al., 2004). Based on our previous observations
where biochar was applied alone (Ippolito et al., 2014), we
hypoth-esized that relatively low biochar application rates (e.g., 1% and 2% by wt.) would cause no effect, while an excessive biochar applica-tion (e.g., 10% by wt.) would cause a negative priming effect even in the presence of manure. Thus, a 12 month laboratory incubation study was conducted with the objective to assess the effect of bio-char–manure co-application on soil water content, nutrient con-centrations, microbial respiration, bacterial abundance, and microbial community structure in relation to priming effect.
2. Materials and methods
2.1. Biochar, manure, and soil characteristics
A hardwood biochar (<0.5-mm particle size), made from oak and hickory sawdust, supplied by Dynamotive Energy Systems Inc. (Vancouver, British Columbia, Canada) was manufactured using fast
pyrolysis at 500°C in a fluidized-bed kiln with a 5 s residence time.
The biochar ash content was determined by Hazen Laboratory (Hazen Research, Inc, Golden, CO) using a modified ASTM method
D1762-84 for wood charcoal (600°C), total C and N were
deter-mined by dry combustion (Nelson and Sommers, 1996;
Thermo-Finnigan FlashEA1112; CE Elantech Inc., Lakewood, NJ), and specific surface area was determined from isotherms fitted to
the Brunauer, Emmett, and Teller (BET) equation (Brunauer et al.,
1938). Biochar pH and EC were determined on a saturated paste
extract (Thomas, 1996; Rhoades, 1996), NO3-N and NH4-N content
using a 2 M KCl extract (Mulvaney, 1996), and organic N content
as difference between total and inorganic N. Biochar total metal con-centrations were determined by HClO4–HNO3–HF–HCl digestion (Soltanpour et al., 1996) followed by elemental analysis using a PerkinElmer inductively coupled plasma-optical emission spec-trometer Optima 8300 (PerkinElmer; Waltham, MA).
Dairy cattle solid manure was collected from a pen at a local open-lot dairy, and contained 55.3% solids. Total C and N, total ele-mental concentrations, NO3-N and NH4-N, and pH and EC were determined as previously described.
Soil (0–30 cm) was obtained from the edge of a field located
1.7 km southwest of Kimberly, Idaho (42°310N, 114°220W; mean
elevation of 1190 m; annual precipitation of 251 mm). The soil, classified as Portneuf (coarse-silty, mixed, superactive, mesic
Durinodic Xeric Haplocalcid; USDA-NRCS, 2013), was air-dried,
passed through a 2-mm sieve, and then analyzed for pH (Thomas, 1996) and EC (Rhoades, 1996) using a 1:1 soil:deionized water extract, total elements, and NH4-N and NO3-N as previously described. The sieved soil was also pulverized and analyzed for
inorganic C using a modified pressure-calcimeter method
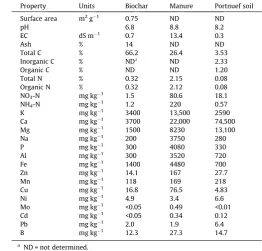
(Sherrod et al., 2002) and total C and N as mentioned above. Soil organic C was determined by difference between total and inor-ganic C. Biochar, manure, and soil characteristic data are presented inTable 1.
2.2. Soil–biochar incubation
The effect of hardwood biochar and manure application to the Portneuf soil was investigated during a 12 month incubation study. Biochar was applied and thoroughly mixed by hand into soil at 0, 1,
2, and 10% (0, 20, 40, and 200 Mg ha1; wt:wt). The 10%
applica-tion rate was chosen to help identify upper level soil detriments by biochar application. Manure was then added to all soils at a rate of 2% (by wt.). Soil–biochar–manure mixtures (300 g total) were
placed in 8 cm8 cm8 cm plastic pots using 4 replicates per
treatment. Pots were lined with plastic liners to prevent leaching,
placed in a growth chamber (22°C; 30% humidity) and watered
twice weekly with reverse osmosis water to 80% of field capacity. Field capacity was determined for each biochar–manure soil mix-ture prior to the experiment by lining four pots with cheesecloth, filling the pots with 300 g soil, saturating with reverse osmosis water, and allowing to freely drain over a 48 h period. Within the growth chamber, pots were separated by month and then random-ized within each month. Pots were destructively sampled at 1, 2, 3, 4, 6, and 12 month intervals.
During monthly destructive sampling, a soil subsample was
removed, placed in a ziplock storage bag, and stored in a80°C
freezer for microbial analysis. The remainder of soils were ana-lyzed for NO3-N and NH4-N as previously described, as well as
Table 1
Properties and total elemental analysis of the hardwood biochar, manure, and Portnuef soil.
Property Units Biochar Manure Portnuef soil
Surface area m2 g1
0.75 ND ND
pH 6.8 8.8 8.2
EC dS m1 0.7 13.4 0.3
Ash % 14 ND ND
Total C % 66.2 26.4 3.53
Inorganic C % NDa
ND 2.33
Organic C % ND ND 1.20
Total N % 0.32 2.15 0.08
Organic N % 0.32 2.12 0.08
NO3-N mg kg1 1.5 80.6 18.1
NH4-N mg kg1 1.2 220 0.57
K mg kg1
3400 13,500 2590
Ca mg kg1
3700 22,000 74,500
Mg mg kg1
1500 8230 13,100
Na mg kg1
200 3750 280
P mg kg1 300 4080 330
Al mg kg1 300 3520 720
Fe mg kg1
1400 4480 700
Zn mg kg1
14.1 167 27.7
Mn mg kg1
118 169 218
Cu mg kg1
16.8 76.5 4.83
Ni mg kg1
4.9 3.4 6.6
Mo mg kg1 <0.05 0.49 <0.01
Cd mg kg1 <0.05 0.34 0.12
Pb mg kg1
2.0 1.9 6.4
B mg kg1
12.3 27.3 14.7
a
ND = not determined.
for diethylenetriaminepentaacetic acid (DTPA; i.e. available)
extractable Fe, Zn, Mn, and Cu (Loeppert and Inskeep, 1996).
Substrate-induced soil respiration rates were determined by thor-oughly mixing 50 g of moist soil with 0.5 g of glucose, 0.01 g of K2HPO4, and 0.075 g of NH4Cl in 100 mL air tight mason jars. A vial containing 5 mL of 1 M NaOH was placed inside each jar to capture
respired CO2, and the jars were sealed. After 24 h the vials were
removed, excess BaCl2was added to the NaOH, several drops of
phenolphthalein indicator were added, and the NaOH was titrated
to a clear endpoint with 1 M HCl (Dungan et al., 2003). Duplicate
measurements were made on all soils. Soil water content was determined on all samples to convert the above soils data to a dry weight basis. Soils were then air-dried, passed through a 2-mm sieve, and a subsample was pulverized and analyzed for total, inorganic, and organic C as previously mentioned. Soils from months 1, 6, and 12 were also analyzed for gravimetric water con-tent by using a pressure plate extractor at matric pocon-tentials of 0,
10, 33, 100, and 300 kPa (Dane and Hopmans, 2002;
Reynolds and Topp, 2008) in a constant temperature room
(22°C). Soils were packed to a bulk density of 1.00 g cm3 into
4.7-cm diameter1.8-cm tall metal rings. To keep the soil within
the rings, a nylon sheet (6
l
m mesh opening) was secured to thebottom of each ring with a rubber band. Soils within the rings were saturated in a plastic tub with a water level of approximately 1.5 cm for about two days. Soils were then transferred to a pressure pot, matric potentials were established over time (from 0 to
300 kPa), and after water ceased to be emitted from the side of
the pressure pot at each potential, the samples were removed and weighed for soil moisture content.
Soils preserved in the80°C freezer were analyzed for bacterial
counts (n= 3) using 0.5 g of soil (dry wt.) and an UltraClean Soil
DNA Isolation Kit (MO BIO laboratories, Inc., Carlsbad, CA)
follow-ing manufacturer’s instructions. After extraction, 5
l
L of DNA wasused in a 30
l
L quantitative PCR (qPCR) reaction mixture withuni-versal primers and probe (100 nM each) to estimate the concentra-tion of 16S rDNA copy numbers in each sample as described by
Nadkarni et al. (2002). The qPCR was performed with a Bio-Rad (Hercules, CA) multicolor iQ5 real-time PCR detection system.
Purified DNA from Escherichia coli (ATCC 11775) was used as a
standard to calculate gene copy numbers.
Frozen soils from the control and 10% biochar rate treatments, and from incubation periods of 2, 6, and 12 months, were analyzed for microbial community structure according to fatty acid methyl ester (FAME) profiles. Prior to analysis, replicate 4 from each bio-char rate within the 2-month incubation treatment had been sac-rificed for other analyses; therefore only three replicate soils were analyzed from the 2-month incubation period, whereas four replicates were analyzed for the 6- and 12-month incubation peri-ods. Microbial FAMEs were extracted following the ester-linked
(EL) FAME procedure described bySchutter and Dick (2000), where
3 g soil were extracted with 0.2 M KOH during a 37°C, 1 h-long
incubation with periodic mixing, followed by addition of 1 M acetic acid to neutralize the pH of the tube contents. Soil FAMEs were partitioned into an organic phase by addition of hexane, which was removed from the aqueous phase after centrifugation at
480gfor 10 min. After the addition of an internal standard (20
l
gof 19:0), samples were analyzed by gas chromatography (Agilent 6890 gas chromatograph, Agilent Technologies, Inc., Palo Alto, CA) at the University of Delaware (Newark, DE) using the Microbial ID (Newark, DE) Eukary method and peak naming table. Biomarkers of specific functional groups were assigned according to Frostegård and Bååth (1996) and Schutter and Dick (2000). Bacterial biomarkers were the sum of i15:0, a15:0, 15:0, i16:0, 16:1x9c, 16:1x7c, i17:0, a17:0, 17:0 cy, 17:0, and 19:0 cy. FAMEs 18:2x6c and 18:1x9c were used as the indicators of sapro-phytic fungi.
2.3. Statistical analyses
The experimental design was a split plot with time design, with statistical analysis performed using the Proc GLM model, SAS
soft-ware version 9.2 (SAS Institute, 2008). Soil water content statistical
analysis was performed only within individual months 1, 6, or 12.
We utilized an
a
= 0.05, and calculated a Fisher’s Protected LeastSignificant Difference (LSD;Steel and Torrie, 1980) when
signifi-cance was observed within treatments or between time intervals. Multivariate analyses of microbial community FAMEs were con-ducted with the PC-ORD statistical package (version 6, MjM Software, Gleneden Beach, OR). Due to the non-normal distribution of the FAME data set, relative % molar concentrations of FAMEs were analyzed by non-metric multidimensional scaling (NMS) with the SØrensen distance measure; NMS is a non-parametric, multivariate technique that ordinates each community in two- or three-dimensional space so that community similarities and dis-similarities can be visualized. Between-community distances are preserved as well as possible in the reduced dimensional space, compared to the actual between-community distances in multi-variate space where the number of dimensions is equivalent to
the number of dependent variables, or FAMEs in this case (Borg
and Groenen, 2005). Multi response permutation procedure (MRPP) tests were conducted to determine if predefined groups of microbial communities (based on biochar rate, incubation time, or biochar rate within an incubation time) were significantly
dif-ferent from each other (
a
= 0.05).3. Results and discussion
3.1. Interpretation of statistical analysis
Biochar, co-applied with manure, typically caused an increase in the soil constituent of concern, and the effect decreased over
time; the opposite was observed for soil NO3-N (Figs. 1 and 2). In
the presence of manure, the effect of biochar on soil properties was, in most instances, modified by time (i.e., significant effects of biochar and time). Significant treatment x time interactions occurred for most variables; however, the impact of the interaction on soil variables was not as strong as the impact of either biochar application rate or time. For example, changes in a soil variable over time may have been slightly delayed at the greatest biochar treatment, as compared to the lower biochar treatments, by only
about one month (e.g. Fe;Fig. 1A). Yet the final, year-long effect
of time on a soil variable was consistent across all biochar treat-ments. Meaning, we did not observe long-lasting deviations in temporal trends based on biochar application rate. Thus, interac-tion effects are presented in the results, but the discussion mostly focuses on the main effects of treatment and time.
3.2. Soil water content
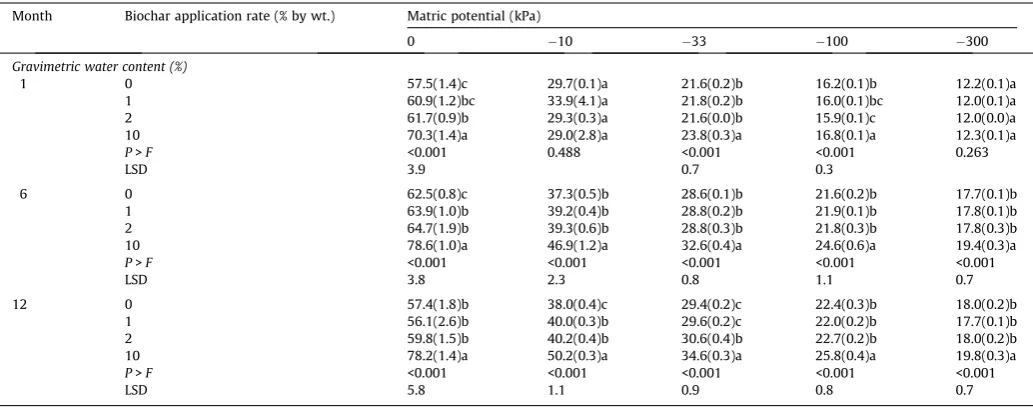
Biochar applied at 10% (by wt.) increased gravimetric soil water
content from saturation to300 kPa, and the response was
consis-tent from month 1 to 6 to 12 (Table 2). This was similar to results
observed byIppolito et al. (2014)who applied up to 10% biochar
alone. Results were also similar to other studies where lower
bio-char rates (0.4–2%) were applied alone (Case et al., 2012; Liu et al.,
2012; Novak et al., 2012; Streubel et al., 2011). Biochar porosity likely increased the water content, similar to that observed by
Sun et al. (2013), Bruun et al. (2012), and Novak et al. (2012). The increase in soil water content due to biochar application alone may be of value to crop producers who experience sporadic rainfall
or solely rely upon irrigation (Novak et al., 2012), with benefits
potentially realized over the long-term (Spokas et al., 2012) as bio-chars are fairly recalcitrant to degradation.
The soil water response to biochar application was less notice-able at lower biochar rates, likely due to a masking effect of the 2%
manure application (i.e.40 Mg ha1
). In support of this finding,
Rasoulzadeh and Yaghoubi (2010)noted an increase in soil water
content at field capacity (33 kPa) over a control when cattle
man-ure was applied at 30 Mg ha1; a greater soil water content was
observed when the application rate was increased to 60 Mg ha1.
Arriaga and Lowery (2003) found a similar soil water retention response following 10 years of cattle manure application at an
annual loading rate of15 Mg ha1. However, few other studies
have studied changes in soil water content with co-application of
biochar and other organic amendments.Liu et al. (2012)studied
the effect of biochar (0, 5, 10, and 20 Mg ha1
) co-applied with a
mixture of composted green waste, wood, and soil
(32.5 Mg ha1); co-application at 20 Mg biochar ha1 doubled
water holding capacity as compared to the control.
In comparing manure alone with biochar + manure treatments (Table 2), we noted that water retention for both increased with time, yet the increase was consistently greater for soils amended with >1% biochar than for manure-only treatments. For example,
at a soil matric potential of 10 kPa, water retention for
manure-only increased 1.3between months 1 and 12, compared
to a 1.7increase for the 10% biochar treatment (Table 2). This
suggests that the water-associated benefits from both amend-ments require time to develop, and that the physical changes induced in manure-amended soils with regards to increased water retention differed from those of biochar.
3.3. Soil chemical characteristics
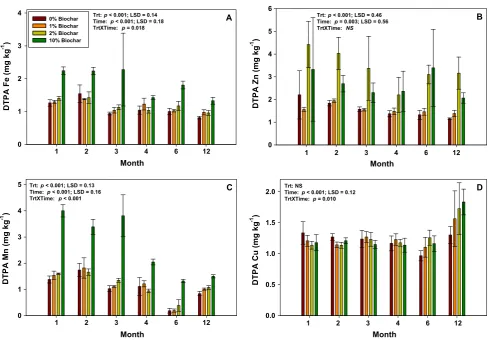
The effect of biochar and manure co-application, and time since co-application, on DTPA extractable Fe, Zn, Mn, and Cu are
pre-sented inFig. 1. The 10% biochar application rate, co-applied with
2% manure, significantly increased DTPA-extractable Fe and Mn over the other three treatments. This was likely due to biochar-borne Fe and Mn being in readily available forms, as
shown by Ippolito et al. (2014). Although decreases in soil pH
can increase metal extractability, no significant treatment effect
on soil pH was observed (data not shown). Lentz and Ippolito
(2012)observed an increase in Mn availability when biochar was applied to the same soil under field conditions. The 2% and 10% bio-char rates caused an increase in extractable Zn as compared to the control and 1% biochar rate. A synergistic effect between biochar and manure may have caused the increase in extractable soil Zn at the higher (2% and 10%) as compared to the lower (0% and 1%) biochar application rates. The increasing Zn concentration with the 2% and 10% biochar + 2% manure application is important because DTPA-extractable Zn concentrations less than about
1.5 mg kg1are considered marginal for certain crops such as corn
and potatoes (Davis and Westfall, 2009; Davis et al., 2009;
Espinoza et al., 2006). Treatment responses were not observed for extractable soil Cu. Over time, available Fe, Zn, and Mn concen-trations tended to decrease likely due to mineral forms changing from more to less available, as previously observed when biochar
was applied alone (Ippolito et al., 2014). In the current study,
avail-able soil Cu content was greater in month 12 as compared to the other months. Although Cu is known to form strong associations
Month
1 2 3 4 6 12
1 2 3 4 6 12 1 2 3 4 6 12
1 2 3 4 6 12
DTPA Fe (mg kg
-1 )
0 1 2 3 4
0% Biochar 1% Biochar 2% Biochar 10% Biochar
A Trt: p < 0.001; LSD = 0.14
Time: p < 0.001; LSD = 0.18 TrtXTime: p = 0.018
Month
DTPA Zn (mg kg
-1 )
0 1 2 3 4 5 6
B Trt: p < 0.001; LSD = 0.46
Time: p = 0.003; LSD = 0.56 TrtXTime: NS
Month
DTPA Mn (mg kg
-1 )
0 1 2 3 4
5 Trt: p < 0.001; LSD = 0.13 C Time: p < 0.001; LSD = 0.16
TrtXTime: p < 0.001
Month
DTPA Cu (mg kg
-1 )
0.0 0.5 1.0 1.5
2.0 Trt: NSTime: p < 0.001; LSD = 0.12 D TrtXTime: p = 0.010
Fig. 1.The effect of increasing biochar application rate (by wt.), applied with a constant rate of manure (2% by wt.), and time since application on diethylenetriamine-pentaacetic acid (DTPA) extractable soil (A) iron, (B) zinc, (C) manganese, and (D) copper. Error bars represent one standard error of the mean (n= 4). Trt = biochar treatment. Time = time since biochar application. TrtXTime = the interaction between treatment and time.
with organic phases, manure mineralization may have lead to the increased Cu content in month 12.
Increasing biochar application caused an increase in soil organic
C content (Fig. 2A) because biochar is mostly C (66.2%;Table 1).
Within each biochar treatment, the organic C content was similar across all sampling periods. After 12 months of incubation, the soil organic C content for the 1%, 2%, and 10% biochar rates were 143%, 181%, and 530% greater than the control; results were similar to
Month
1 2 3 4 6 12
1 2 3 4 6 12 1 2 3 4 6 12
1 2 3 4 6 12
Organic C (%)
0 2 4 6 8 10 12
0% Biochar 1% Biochar 2% Biochar 10% Biochar
Trt: p < 0.001; LSD = 0.25 Time: p = 0.032; LSD = 0.30 TrtXTime: p = 0.005
A
Month
Soil NO
3
-N (mg kg
-1 )
0 50 100 150 200 250
B Trt: p < 0.001; LSD = 10.4
Time: p < 0.001; LSD = 12.8 TrtXTime: p < 0.001
Month
Respired CO
2
(mg g
-1 24h
-1 )
0 1 2 3 4 5
C Trt: p = 0.003; LSD = 0.17
Time: p < 0.001; LSD = 0.21 TrtXTime: NS
Month
Log 16S rRNA gene copies (g
-1
dry soil)
0 2 4 6
8 D
Trt: p = 0.018; LSD = 0.36 Time: p < 0.001; LSD = 0.44 TrtXTime: p = 0.009
Fig. 2.The effect of increasing biochar application rate (by wt.), applied with a constant rate of manure (2% by wt.), and time since application on soil (A) organic C, (B) NO3-N, (C) substrate-induced respired CO2, and (D) bacterial population. Error bars represent one standard error of the mean (n= 4). Trt = biochar treatment. Time = time since biochar application. TrtXTime = the interaction between treatment and time.
Table 2
Biochar + manure (2% by wt.) amended Portneuf soil mean (n= 4) percent gravimetric soil water content for soils incubated for either 1, 6, or 12 months. Values inside parenthesis indicate one standard error of the mean. Within a column and a given month, values followed by the same letters are not significantly different ata= 0.05, as determined by Fisher’s protected LSD.
Month Biochar application rate (% by wt.) Matric potential (kPa)
0 10 33 100 300
Gravimetric water content (%)
1 0 57.5(1.4)c 29.7(0.1)a 21.6(0.2)b 16.2(0.1)b 12.2(0.1)a
1 60.9(1.2)bc 33.9(4.1)a 21.8(0.2)b 16.0(0.1)bc 12.0(0.1)a
2 61.7(0.9)b 29.3(0.3)a 21.6(0.0)b 15.9(0.1)c 12.0(0.0)a
10 70.3(1.4)a 29.0(2.8)a 23.8(0.3)a 16.8(0.1)a 12.3(0.1)a
P>F <0.001 0.488 <0.001 <0.001 0.263
LSD 3.9 0.7 0.3
6 0 62.5(0.8)c 37.3(0.5)b 28.6(0.1)b 21.6(0.2)b 17.7(0.1)b
1 63.9(1.0)b 39.2(0.4)b 28.8(0.2)b 21.9(0.1)b 17.8(0.1)b
2 64.7(1.9)b 39.3(0.6)b 28.8(0.3)b 21.8(0.3)b 17.8(0.3)b
10 78.6(1.0)a 46.9(1.2)a 32.6(0.4)a 24.6(0.6)a 19.4(0.3)a
P>F <0.001 <0.001 <0.001 <0.001 <0.001
LSD 3.8 2.3 0.8 1.1 0.7
12 0 57.4(1.8)b 38.0(0.4)c 29.4(0.2)c 22.4(0.3)b 18.0(0.2)b
1 56.1(2.6)b 40.0(0.3)b 29.6(0.2)c 22.0(0.2)b 17.7(0.1)b
2 59.8(1.5)b 40.2(0.4)b 30.6(0.4)b 22.7(0.2)b 18.0(0.2)b
10 78.2(1.4)a 50.2(0.3)a 34.6(0.3)a 25.8(0.4)a 19.8(0.3)a
P>F <0.001 <0.001 <0.001 <0.001 <0.001
LSD 5.8 1.1 0.9 0.8 0.7
that observed by other researchers (e.g. Rogovska et al., 2011; Bolan et al., 2012). It has been previously noted that some biochar-added C is available for microorganisms or biochar appli-cation can stimulate the degradation of easily degradable
com-pounds present in the natural soil organic C (Hamer et al.,
2004;Wardle et al., 2008).
3.4. Soil microbiological responses
In the presence of manure, biochar addition at the 10% rate altered soil microbial N cycling and respiration activities, but did not greatly affect bacterial abundance or microbial community structure. Soil NO3-N concentrations were significantly lower at the 10% biochar application rates as compared to the other rates (Fig. 2B), at most sampling times, likely due to microbial immobi-lization and less net mineraimmobi-lization/nitrification. Biochar contained
little NO3-N (Table 1) and the C:N ratio was207:1, much greater
than the assumed approximately 35:1 minimum ratio when
immobilization response is observed (Borchard et al., 2012).
However, at the 0%, 1%, and 2% biochar rates, immobilization was less prevalent most likely due to the 2% manure application
sup-plying available N (Table 1).
Over time, soil NO3-N increased with all biochar rates when applied with a 2% manure rate, likely because of mineralization
and nitrification of manure N.Lentz and Ippolito (2012)applied
biochar and manure at 22.4 and 42 Mg ha1, respectively, to the
same soil in a field study. The authors noted a decrease in soil
NO3-N within the first year following co-application, followed by
a slight increase in NO3-N likely due to mineralization. In a labora-tory incubation study where biochar was applied without manure,
Ippolito et al. (2014)showed that the 10% biochar application rate dramatically lowered soil NO3-N concentrations and prevented
NO3from accumulating over time, which suggested that excessive
applications would not be suitable for crop growth. In the current study the 10% biochar application rate, co-applied with a 2% man-ure application rate, likely allowed for some net mineralization and nitrification of manure N but limited excessive soil NO3-N accumu-lation as compared to the 0%, 1%, and 2% biochar treatments. Thus, mixing biochar with manure, at the appropriate rates during land application, could potentially benefit producers who utilize
man-ure yet observe increasing soil NO3-N pollution; co-application
may lead to more efficient N fertilizer use (Kameyama et al.,
2012; Kammann et al., 2011; Chan et al., 2007).
Biochar increased microbial respiration activity only at the 1% application rate as compared to other rates when averaged over
all months (Fig. 2C). It is interesting to note that the 10% biochar
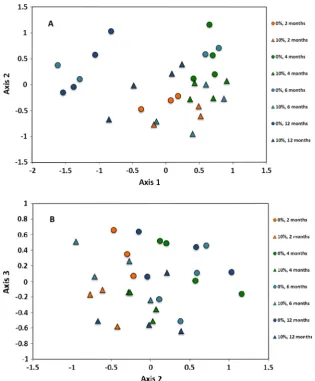
rate added 10 times as much biochar-borne C as compared to the 1% rate, yet respiration did not significantly increase over the 1% Fig. 3.The effect of increasing biochar application rate (% by wt.), applied with a constant rate of manure (2% by wt.), and time since application on soil microbial community FAME profiles, as determined by non-metric multidimensional scaling (NMS). Community profiles are displayed in multi-dimensional space, with Axis 1 vs. 2 in (A) and Axis 2 vs. 3 in (B).
biochar treatment. In general, CO2production was least at month 1, rose to a maximum at month 2, and then decreased to an inter-mediate level through the rest of the incubation period. These
find-ings were similar to that ofRogovska et al. (2011)who added up to
2% biochar to soil and showed increased CO2emissions over
con-trols. Others have observed increased (Dempster et al., 2012;
Quilliam et al., 2012) and decreased (Spokas et al., 2009) respira-tion rates associated with increasing biochar applicarespira-tion rates.
Averaged over all months, the bacterial abundance decreased with the 1% biochar application as compared to the control or other
biochar rates (Fig. 2D). Contrary to our findings, others (Lehmann
et al., 2011; Cantrell et al., 2012) have suggested that biochar addi-tion may increase bacterial numbers, possibly due to increases in macro- (e.g., K) or micro-nutrient availability or soil pH. Bacterial concentrations were maximized in months three and four;
Ippolito et al. (2014)found a similar response when biochar was applied alone.
In the presence of manure, 10% biochar application caused only
subtle shifts in the microbial community structure (Fig. 3A and B).
These shifts were mainly attributed to greater percentages of two fatty acids associated with Gram-negative bacteria (17:1x8c and 17:0 cy) and less percentages of four Gram-positive bacterial fatty acids (i15:0, a15:0 i16:0, and i17:0). Similar to this study,
Pietikäinen et al. (2000)found the FAMEs 17:1x8c and 17:0 cy were enriched within a biochar and in soil humus underlying the biochar, respectively. In the current study, the sum of the two Gram-negative bacterial FAMEs was 1.6% in control soil vs. 2.9% in the 10% biochar rate soil, whereas the sum of the Gram-positive FAMEs were 13.6% in control soil and 12.5% in 10%
biochar rate soil. Although small (1% change for each group of
FAMEs), the differences based on biochar rate were statistically sig-nificant. Within each incubation period, the separation of microbial community structures based on biochar rate was evident across
three dimensions or axes, as shown inFig. 3A and B. However,
the greatest separation of communities occurred along Axis 1 and was due to the effect of long incubation periods on control soil
microbial communities (Fig. 3A). Shifts in community FAME
pro-files during the incubation were due to changes in a few FAMEs. First, the relative proportion of i17:1x9c, a biomarker for
anaero-bic sulfate reducers (Vestal and White, 1989), increased over time,
from 3.2% at 2 months, 3.7% at 4 months, 4.0% at 6 months, and finally 4.4% at 12 months. The changes between 2 and 4 months, and 4 to 12 months, were statistically significant. In addition, the ratio of FAMEs 19:0 cy-to-18:1x7c increased significantly over time, from 0.22 at 2 months to 0.37 at 12 months. This ratio is uti-lized as an indicator of environmental stress, as bacteria synthesize cyclopropane fatty acids (e.g., 19:0 cy) from their monounsatu-rated precursors (e.g., 18:1x7c) when starved of labile substrates,
or exposed to heat, desiccation, or low pH (Grogan and Cronan,
1997). Thus, it appears that the long incubation period required a
physiological adaptation of bacteria, presumably due to exhaustion of labile carbon substrates and oxygen availability.
The FAME data suggest a greater impact of incubation time than biochar co-applied with manure on microbial community struc-ture, which contrasts with results found in a related incubation
study where biochar was applied alone (Ippolito et al., 2014). In
that study, biochar applied at a 10% rate caused a significant reduc-tion of fungal FAMEs and increased the 19:0 cy-to-18:1x7c over that of control soil, and these effects were sustained over time.
Based on those results,Ippolito et al. (2014)concluded that biochar
applied at a 10% rate had excessive negative impacts on a calcare-ous soil’s microbial community. However, when co-applied with 2% manure as in this study, these effects were not observed. The relative proportion of fungal FAMEs was unchanged by biochar (31.3% in control and 30.8% in 10% biochar treatment), as was the 19:0 cy-to-18:1x7c ratio (0.33 in control and 0.27 in biochar
treatment). Thus, manure appeared to moderate the impact of a high application rate of biochar, so that only subtle effects were detected on bacterial populations.
4. Conclusions
Biochar co-application with manure to calcareous soil had sev-eral beneficial effects on soil properties. Co-application improved the soil water status, which would be considered beneficial in areas where irrigation or rainfall is limited. When co-applied with manure, a positive synergistic increase in soil-extractable Zn con-tent occurred, which could also be beneficial in Zn-deficient cal-careous soils. Previous research suggested that a biochar rate of 10% could be considered excessive and cause significant reductions in soil NO3-N concentrations and shifts in microbial community structure; a 10% biochar application should be avoided. However, when 10% biochar was applied with 2% manure as in the current study, biochar reduced excess soil NO3-N accumulation concentra-tions and thus may benefit producers by leading to more efficient N use. Furthermore, biochar–manure co-application lessened the shifts in microbial community structure, and thus co-application may help reduce significant shifts in ecosystem services associated solely with biochar application. Based on the above conclusions, we accepted our hypothesis that, in the presence of manure, lower biochar application rates (i.e., 1% and 2% by wt.) would not cause a negative priming effect, and we rejected our hypothesis that greater biochar application rates (i.e., 10% by wt.) would cause a negative priming effect. The combination of soil water and nutrient improvements, in conjunction with no major shift in microbial community composition, may actually have beneficial ecosystem services in arid and semi-arid environments.
Acknowledgements
This publication is based on work supported by the US Department of Agriculture, Agriculture Research Service. The authors thank all parties responsible for biochar manufacturer, characterization, and laboratory analyses.
References
Arriaga, F.J., Lowery, B., 2003. Soil physical properties and crop productivity of an eroded soil amended with cattle manure. Soil Sci. 168, 888–899.
Bolan, N.S., Kunhikrishnan, A., Choppala, G.K., Thangarajan, R., Chung, J.W., 2012. Stabilization of carbon in composts and biochars in relation to carbon sequestration and soil fertility. Sci. Tot. Environ. 424, 264–270.
Borchard, N., Wolf, A., Laabs, V., Aeckersberg, R., Scherer, H.W., Moeller, A., Amelung, W., 2012. Physical activation of biochar and its meaning for soil fertility and nutrient leaching – a greenhouse experiment. Soil Use Manage. 28, 177–184.
Borg, I., Groenen, P., 2005. Modern Multidimensional Scaling: Theory and Applications, second ed. Springer-Verlag, New York, NY, pp. 207–212.
Brady, N.C., Weil, R.R., 1999. The Nature and Properties of Soils, 12th ed. Prentice Hall, Upper Saddle River, NJ, p. 86.
Brewer, C.E., Hu, Y., Schmidt-Rohr, K., Loynachan, T.E., Laird, D.A., Brown, R.C., 2012. Extent of pyrolysis impacts on fast pyrolysis biochar properties. J. Environ. Qual. 41, 1115–1122.
Brunauer, S., Emmett, P.H., Teller, E., 1938. Adsorption of gases in multimolecular layers. J. Am. Chem. Soc. 60, 309–319.
Bruun, E.W., Ambus, P., Egsgaard, H., Hauggaard-Nielsen, H., 2012. Effects of slow and fast pyrolysis biochar on soil C and N turnover dynamics. Soil Biol. Biochem. 46, 73–79.
Cantrell, K.B., Hunt, P.G., Uchimiya, M., Novak, J.M., Ro, K.S., 2012. Impact of pyrolysis temperature and manure source on physicochemical characteristics of biochar. Bioresour. Technol. 107, 419–428.
Case, S.D.C., McNamara, N.P., Reay, D.S., Whitaker, J., 2012. The effect of biochar addition on N2O and CO2emissions from a sandy loam soil – the role of soil
aeration. Soil Biol. Biochem. 51, 125–134.
Chan, K.Y., Van Zwieten, L., Meszaros, I., Downie, A., Joseph, S., 2007. Agronomic values of greenwaste biochar as a soil amendment. Aust. J. Soil Res. 45, 629– 634.
Dane, J.H., Hopmans, J.W., 2002. Pressure plate extractor. In: Dane, J.H., Topp, G.C. (Eds.), Methods of Soil Analysis, Part 4 – Physical Methods. Soil Science Society of America, Madison, Wisconsin, pp. 688–690.
Davis, J.G., Westfall, D.G., 2009. Fertilizing corn. Colorado State University Extension Fact Sheet No. 0.538. <http://www.ext.colostate.edu/pubs/crops/00538.pdf> (verified 10.05.15).
Davis, J.D., Davidson, R.D., Essah, S.Y.C., 2009. Fertilizing potatoes. Colorado State University Extension Fact Sheet No. 0.541. <http://www.ext.colostate.edu/pubs/ crops/00541.html> (verified 10.05.15).
Dempster, D.N., Gleeson, D.B., Solaiman, Z.M., Jones, D.L., Murphy, D.V., 2012. Decreased soil microbial biomass and nitrogen mineralization with Eucalyptus biochar addition to a coarse textured soil. Plant Soil 354, 311–324.
Ducey, T.F., Ippolito, J.A., Cantrell, K.B., Novak, J.M., Lentz, R.D., 2013. Addition of activated switchgrass biochar to an aridic subsoil increases microbial nitrogen cycling gene abundances. Appl. Soil Ecol. 65, 65–72.
Dungan, R.S., Ibekwe, A.M., Yates, S.R., 2003. Effect of propargyl bromide and 1,3-dichoropropene on microbial communities in an organically amended soil. FEMS Microbiol. Ecol. 43, 75–87.
Espinoza, L., Slaton, N., Mozaffari, M., 2006. Understanding the numbers on your soil test report. University of Arkansas Cooperative Extension FSA2118. <http:// www.uaex.edu/Other_Areas/publications/PDF/FSA-2118.pdf> (verified 10.05.15).
Frostegård, A., Bååth, E., 1996. The use of phospholipid fatty acid analysis to estimate bacterial and fungal biomass in soil. Biol. Fertil. Soils 22, 59–65.
Glaser, B., Guggenberger, G., Zech, W., 2004. Identifying the pre-Columbian anthropogenic input on present soil properties of Amazonian dark earths (Terra Preta). In: Glaser, B., Woods, W.I. (Eds.), Amazonian Dark Earths: Explorations in Space and Time. Springer Verlag, New York, pp. 145–158.
Grogan, D.W., Cronan Jr., J.E., 1997. Cyclopropane ring formation in membrane lipids of bacteria. Microbiol. Mol. Biol. Rev. 61, 429–441.
Hamer, U., Marschner, B., Brodowski, S., Amelung, W., 2004. Interactive priming of black carbon and glucose mineralization. Org. Chem. 35, 823–830.
Hass, A., Gonzalez, J.M., Lima, I.M., Godwin, H.W., Halvorson, J.J., Boyer, D.G., 2012. Chicken manure biochar as liming and nutrient source for acid Appalachian soil. J. Environ. Qual. 41, 1096–1106.
Ippolito, J.A., Laird, D.A., Busscher, W.J., 2012a. Environmental benefits of biochar. J. Environ. Qual. 41, 967–972.
Ippolito, J.A., Novak, J.M., Busscher, W.J., Ahmedna, M., Rehrah, D., Watts, D.W., 2012b. Switchgrass biochar affects two Aridisols. J. Environ. Qual. 41, 1123– 1130.
Ippolito, J.A., Stromberger, M.E., Lentz, R.D., Dungan, R.S., 2014. Hardwood biochar influences calcareous soil physicochemical and microbiological status. J. Environ. 43, 681–689.
Kameyama, K., Miyamoto, T., Shiono, T., 2012. Influence of sugarcane bagasse-derived biochar application on nitrate leaching in calcaric dark red soil. J. Environ. Qual. 41, 1131–1137.
Kammann, C.I., Linsel, S., Gobling, J.W., Koyro, H., 2011. Influence of biochar on drought tolerance ofChenopodium quinoaWilld and on soil–plant relations. Plant Soil 345, 195–210.
Keith, A., Singh, B., Singh, B.P., 2011. Interactive priming of biochar and labile organic matter mineralization in a smectite-rich soil. Environ. Sci. Technol. 45, 9611–9618.
Laird, D.A., Fleming, P., Davis, D.D., Horton, R., Wang, B., Karlen, D.L., 2010a. Impact of biochar amendments on the quality of a typical Midwestern agricultural soil. Geoderma 158, 443–449.
Laird, D.A., Fleming, P., Wang, B., Horton, R., Karlen, D.L., 2010b. Biochar impact on nutrient leaching from a Midwestern agricultural soil. Geoderma 158, 436–442.
Lehmann, J., da Silva, J.P., Steiner, C., Nehls, T., Zech, W., Glaser, B., 2003. Nutrient availability and leaching in an archaeological Anthrosol and a Ferralsol of the central Amazon basin: fertilizer, manure and charcoal amendments. Plant Soil 249, 343–357.
Lehmann, J., Rillig, M.C., Thies, J., Masiello, C.A., Hockaday, W.C., Crowley, D., 2011. Biochar effects on soil biota – a review. Soil Biol. Biochem. 43, 1812–1836.
Lentz, R.D., Ippolito, J.A., 2012. Biochar and manure affects calcareous soil and corn silage nutrient concentrations and uptake. J. Environ. Qual. 41, 1033–1043.
Liang, B., Lehmann, J., Sohi, S.P., Thies, J.E., O’Neill, B., Trujillo, L., Gaunt, J., Solomon, D., Grossman, J., Neves, E.G., Luizão, F.J., 2010. Black carbon affects the cycling of non-black carbon in soil. Org. Geochem. 41, 206–213.
Liu, J., Schulz, H., Brandl, S., Miehtke, H., Huwe, B., Glaser, B., 2012. Short-term effect of biochar and compost on soil fertility and water status of a Dystic Cambisol in NE Germany under field conditions. J. Plant Nutr. Soil Sci. 175, 698–707.
Loeppert, R.H., Inskeep, W.P., 1996. Iron. In: Sparks, D.L. (Ed.), Methods of Soil Analysis, Part 3 – Chemical Methods. Soil Science Society of America, Madison, Wisconsin, pp. 639–664.
Major, J., Rondon, M., Molina, D., Riha, S.J., Lehmann, J., 2012. Nutrient leaching in a Colombian savanna Oxisol amended with biochar. J. Environ. Qual. 41, 1076– 1086.
Mulvaney, R.L., 1996. Nitrogen – inorganic forms. In: Sparks, D.L. (Ed.), Methods of Soil Analysis, Part 3 – Chemical Methods. Soil Science Society of America, Madison, Wisconsin, pp. 1123–1184.
Nadkarni, M.A., Martin, F.E., Jacques, N.A., Hunter, N., 2002. Determination of bacterial load by real-time PcR using a broad-range (universal) probe and primer set. Microbiology 148, 257–266.
Nelson, D.W., Sommers, L.E., 1996. Total carbon, organic carbon, and organic matter. In: Sparks, D.L. (Ed.), Methods of Soil Analysis, Part 3 – Chemical Methods. Soil Science Society of America, Madison, Wisconsin, pp. 975–977.
Novak, J.M., Lima, I., Xing, B., Gaskin, J.W., Steiner, C., Das, K.C., Ahmedna, M., Rehrah, D., Watts, D.W., Busscher, W.J., Schomberg, H., 2009. Characterization of designer biochar produced at different temperatures and their effects on a loamy sand. Ann. Environ. Sci. 3, 195–206.
Novak, J.M., Busscher, W.J., Watts, D.W., Amonette, J.E., Ippolito, J.A., Lima, I.M., Gaskin, J., Das, K.C., Steiner, C., Ahmedna, M., Rehran, D., Schomberg, H., 2012. Biochars impact on soil moisture storage in an Ultisol and two Aridisols. Soil Sci. 177, 310–320.
Pietikäinen, J., Kiikkila, O., Fritze, H., 2000. Charcoal as a habitat for microbes and its effect on the microbial community of the underlying humus. Oikos 89, 231– 242.
Quilliam, R.S., Marsden, K.A., Gertler, C., Rousk, J., DeLuca, T.H., Jones, D.L., 2012. Nutrient dynamics, microbial growth and weed emergence in biochar amended soil are influenced by time since application and reapplication rate. Agric. Ecosys. Environ. 158, 192–199.
Rasoulzadeh, A., Yaghoubi, A., 2010. Effect of cattle manure on soil physical properties on a sandy clay loam soil in North-West Iran. J. Food Agric. Environ. 8, 976–979.
Reynolds, W.D., Topp, G.C., 2008. Soil water desorption and imbibition: tension and pressure techniques. In: Carter, M.R., Gregorich, E.G. (Eds.), Soil Sampling and Methods of Analysis, second ed. CRC Press, Boca Raton, Florida, pp. 981–997.
Rhoades, J.D., 1996. Electrical conductivity and total dissolved solids. In: Sparks, D.L. (Ed.), Methods of Soil Analysis, Part 3 – Chemical Methods. Soil Science Society of America, Madison, Wisconsin, pp. 417–435.
Rogovska, N., Laird, D., Cruse, R., Fleming, P., Parkin, T., Meek, D., 2011. Impact of biochar on manure carbon stabilization and greenhouse gas emissions. Soil Sci. Soc. Am. J. 75, 871–879.
Sarkhot, D.V., Berhe, A.A., Ghezzehei, T.A., 2012. Impact of biochar enriched with dairy manure effluent on carbon and nitrogen dynamics. J. Environ. Qual. 41, 1107–1114.
SAS Institute, 2008. SAS/STAT user’s guide. Version 9.2. SAS Inst., Cary, NC.
Schomberg, H.H., Gaskin, J.W., Harris, K., Das, K.C., Novak, J.M., Busscher, W.J., Watts, D.W., Woodroof, R.H., Lima, I.M., Ahmedna, M., Rehrah, D., Xing, B., 2012. Influence of biochar on nitrogen fractions in a Coastal Plain soil. J. Environ. Qual. 41, 1087–1095.
Schutter, M.E., Dick, R.P., 2000. Comparison of fatty acid methyl ester (FAME) methods for characterizing microbial communities. Soil Sci. Soc. Am. J. 64, 1659–1668.
Sherrod, L.A., Dunn, G., Peterson, G.A., Kolberg, R.L., 2002. Inorganic carbon analysis by modified pressure-calcimeter method. Soil Sci. Soc. Am. J. 66, 299–305.
Smith, J.L., Collins, H.P., Bailey, V.L., 2010. The effect of young biochar on soil respiration. Soil Biol. Biochem. 42, 2345–2347.
Soltanpour, P.N., Johnson, G.W., Workman, S.M., Jones Jr., J.B., Miller, R.O., 1996. Inductively coupled plasma emission spectrometry and inductively coupled plasma-mass spectrometry. In: Sparks, D.L. (Ed.), Methods of Soil Analysis, Part 3 – Chemical Methods. Soil Science Society of America, Madison, Wisconsin, pp. 91–139.
Sorensen, L.H., 1974. Rate of decomposition of organic matter in soil as influenced by repeated air drying-rewetting and repeated additional of organic material. Soil Biol. Biochem. 6, 287–292.
Spokas, K.A., Koskinen, W.C., Baker, J.M., Reicosky, D.C., 2009. Impacts of woodchip biochar additions on greenhouse gas production and sorption/degradation of two herbicides in a Minnesota soil. Chemosphere 77, 574–581.
Spokas, K.A., Cantrell, K.B., Novak, J.M., Archer, D.W., Ippolito, J.A., Collins, H.P., Boateng, A.A., Lima, I.M., Lamb, M.C., McAloon, A.J., Lentz, R.D., Nichols, K.A., 2012. Biochar: a synthesis of its agronomic impact beyond carbon sequestration. J. Environ. Qual. 41, 973–989.
Steel, R.G.D., Torrie, J.H., 1980. Principles and Procedures of Statistics: A Biometrical Approach, second ed. McGraw-Hill, New York.
Streubel, J.D., Collins, H.P., Garcia-Perez, M., Tarara, J., Granatstein, D., Kruger, C.E., 2011. Influence of contrasting biochar types on five soils at increasing rates of application. Soil Sci. Soc. Am. J. 75, 1402–1413.
Sun, Z., Moldrup, P., Elsgaard, L., Arthur, E., Bruun, E.W., Hauggaard-Nielsen, H., de Jonge, L.W., 2013. Direct and indirect short-term effects of biochar on physical characteristics of an arable sandy loam. Soil Sci. 178, 465–473.
Thomas, G.W., 1996. Soil pH and soil acidity. In: Sparks, D.L. (Ed.), Methods of Soil Analysis, Part 3 – Chemical Methods. Soil Science Society of America, Madison, Wisconsin, pp. 475–490.
USDA, 2006. Manure use for fertilizer and for Energy. Report to Congress. <http:// www.ers.usda.gov/media/377385/ap037b_1_.pdf> (verified 10.05.15). USDA-NRCS, 2013. Soil extent mapping tool. <http://www.cei.psu.edu/soiltool/
semtool.html> (verified 10.05.15).
Van Zwieten, L., Kimber, S., Morris, S., Chan, K.Y., Downie, A., Rust, J., Joseph, S., Cowie, A., 2010. Effects of biochar from slow pyrolysis of paper mill waste on agronomic performance and soil fertility. Plant Soil 327, 235–246.
Vestal, R.D., White, D.C., 1989. Lipid analysis in microbial ecology. Quantitative approaches to the study of microbial communities. Bioscience 39, 535–541.
Wardle, D.A., Nilsson, M.C., Zackrisson, O., 2008. Fire-derived charcoal causes loss of forest humus. Science 320, 629.