O R I G I N A L R E S E A R C H
Open Access
Quantification of myocardial blood flow
with
82
Rb: Validation with
15
O-water using
time-of-flight and point-spread-function
modeling
Mary Germino
1,4*, Jim Ropchan
2, Tim Mulnix
2, Kathryn Fontaine
2, Nabeel Nabulsi
2, Eric Ackah
3, Herman Feringa
3,
Albert J. Sinusas
3, Chi Liu
1,2and Richard E. Carson
1,2Abstract
Background:We quantified myocardial blood flow with82Rb PET using parameters of the generalized Renkin-Crone model estimated from82Rb and15O-water images reconstructed with time-of-flight and point spread function
modeling. Previous estimates of rubidium extraction have used older-generation scanners without time-of-flight or point spread function modeling. We validated image-derived input functions with continuously collected arterial samples. Methods:Nine healthy subjects were scanned at rest and under pharmacological stress on the Siemens Biograph mCT with82Rb and15O-water PET, undergoing arterial blood sampling with each scan. Image-derived input functions were estimated from the left ventricle cavity and corrected with tracer-specific population-based scale factors determined from arterial data. Kinetic parametric images were generated from the dynamic PET images by fitting the one-tissue compartment model to each voxel’s time activity curve. Mean myocardial blood flow was determined from each subject’s15O-waterk2images. The parameters of the generalized Renkin-Crone model were estimated from these water-based flows and mean myocardial82RbK1estimates.
Results:Image-derived input functions showed improved agreement with arterial measurements after a scale correction. The Renkin-Crone model fit (a= 0.77,b= 0.39) was similar to those previously published, thoughbwas lower.
Conclusions:We have presented parameter estimates for the generalized Renkin-Crone model of extraction for82Rb PET using human82Rb and15O-water PET from high-resolution images using a state-of-the-art time-of-flight-capable scanner. These results provide a state-of-the-art methodology for myocardial blood flow measurement with82Rb PET.
Keywords:Myocardial blood flow, Rubidium-82 PET, Image-derived input function, TOF PET
Background
Cardiac perfusion PET with 82Rb is clinically useful for diagnosing coronary artery disease [1–4]. Quantification of myocardial blood flow (MBF) and coronary flow reserve (CFR) can be obtained from82Rb PET but relies on accurately modeling the extraction fraction of rubid-ium by myocardial tissue, which is nonlinearly related to
flow as described by the generalized Renkin-Crone model [5–8]. Uncertainty in the extraction model parameters causes much of the uncertainty in MBF [9].
Several groups have reported generalized Renkin-Crone model parameters for rubidium using canine or human MBF data from microspheres [10],13N-ammonia [5, 11], and 15O-water [12, 13]. Most of these studies used older-generation PET systems with 2D or reduced-dose 3D acquisitions. To our knowledge, no extraction fraction estimations have been made using scanners with time-of-flight (TOF) capabilities; for 82Rb PET, such systems provide better signal-to-noise ratios than non-* Correspondence:[email protected]
1Biomedical Engineering, Yale University, New Haven, CT, USA 4PET Center, Yale School of Medicine, PO Box 208048, New Haven, CT
06520-8048, USA
Full list of author information is available at the end of the article
TOF systems [14, 15] and parametric images with lower standard error. Further, when point spread function (PSF) modeling is included in reconstruction, MBF esti-mates from82Rb PET may be higher [16]; however, such calculations were performed using an extraction model [11] derived from non-TOF, non-PSF images. Presotto et al. [17] demonstrated the quantitative superiority of PSF + TOF for dynamic cardiac reconstructions using a thorax/heart phantom filled with either18F alone or 18F and 13N (to simulate dynamically varying contrast), in both static and moving configurations.
Errors in the input function, another critical component of kinetic modeling, can substantially bias kinetic param-eter estimates [18]. For practical reasons, image-derived input functions (IDIFs) are widely used in cardiac PET. IDIFs estimated from blood pool regions of cardiac images have been validated against the gold standard of arterial samples in dogs [5, 19] but not recently in humans with 82
Rb PET.
A recent study of five extraction model fits and three IDIF estimation methods demonstrated that these choices substantially influence MBF estimates [20]. In this work, we reexamined extraction fraction estimation in humans with paired rest and stress studies with 82Rb and 15 O-water acquired on a state-of-the-art system, the Siemens Biograph mCT, and reconstructed images with TOF and PSF modeling. We augmented this high-quality image data with continuously sampled arterial measurements for input function validation. From these data, we provided new parameter estimates of the generalized Renkin-Crone model for rubidium extraction.
Methods Subjects
Nine healthy subjects (five male) with no known cardiac abnormalities were studied. This study was approved by the Yale University Human Investigation Committee; all subjects signed an informed consent form. The average age was 28.4 ± 6.2 years, and average BMI was 24.7 ± 3.9 kg/m2. Subjects abstained from caffeine for 12 h pre-imaging, and from food for 4–6 h. Before scanning, an intravenous line for tracer administration and an arterial line for blood sampling were placed.
Data acquisition
PET scans were acquired on the Biograph mCT 1104 (Siemens Healthcare, Knoxville, TN) at rest and under pharmacological stress with82Rb and15O-water for each subject. For seven subjects, the scan sequence was:82Rb rest; 15O-water rest; 15O-water stress; and 82Rb stress. For the remaining subjects, the 82Rb stress acquisition was performed directly after the82Rb rest acquisition. A 1-h interval separated each stress scan from the follow-ing acquisition, with confirmation that heart rate and
blood pressure had returned to baseline. Low-dose CT attenuation correction scans were acquired before each rest scan and after each stress scan. Pharmacological stress was induced with 0.4 mg of regadenoson, injected over 30 s, 1 min before tracer injection. The 82Rb injec-tions were performed with the CardioGen-82 (Bracco Diagnostics, Princeton, NJ) system with an infusion rate of 50 mL/min, duration of 18 ± 4 s, and mean ± SD dose of 663 ± 82 MBq. 15O-water infusions with mean dose 690 ± 136 MBq were delivered over 20 s. Dosing was independent of body weight.
Arterial blood sampling and data analysis
Arterial blood was drawn from the radial artery for 7 min per scan at 4 mL per minute for seven of nine subjects and radioactivity measured with a cross-calibrated radioactivity monitor (PBS-101, Veenstra Instruments, Joure, The Netherlands). One subject chose not to have the arterial line. In another subject, the arterial line was not successfully placed. Because IDIFs were corrected with population-based scale fac-tors, these subjects’ image data were not excluded. Because the 1.25-mL infusion line for 82Rb was not flushed, residual activity remained at end-of-elution. This unshielded activity contributed to the back-ground signal detected by the radioactivity monitor, visible in the initial portion of the 82Rb arterial read-ings before the input function peak (when measure-ments should be 0). To model this background signal, a decaying exponential with the 82Rb decay constant was fit to the raw count data for each acquisition, between end-of-elution and the rise of the input func-tion peak. This fitted curve was subtracted from the arterial measurements (see Additional file 1, page 1). Apart from removal of the background signal, 82Rb and 15O-water data were processed analogously. Corrections were applied for sensitivity, decay, and external dispersion. Sensitivity was measured by cross-calibration with phantom measurements per iso-tope. To correct for time delay between the left ventricle (LV) and the arterial sampling site, each acquisition’s time shift was estimated by maximizing the correlation between the corrected arterial samples and the LV time activity curve (TAC).
Image reconstruction
corresponding attenuation correction CT images, and manually realigned and re-reconstructed as necessary. Images were transformed to short-axis orientation.
Kinetic modeling
The one-tissue compartment model
CTð Þ ¼t K1e−k2t⊗CAð Þt ð1Þ
was used to describe the kinetics in the myocardium tis-sue, whereK1is the myocardial influx rate constant,k2is
the efflux rate constant, and CT(t) is the tissue TAC [11, 21,22]. Tissue TACs were converted from Bq/mL to Bq/g with an assumed tissue density of 1.05 g/mL. The arterial input functionCA(t) was estimated from either the arterial
samples or the images (described below).
Partial volume, motion effects, and arterial blood volume were accounted for with one or two additional parameters:
VA, for the LV cavity spillover and arterial blood volume, and, optionally, VRV, for the right ventricle (RV) cavity spillover:
CPET;myoð Þ ¼t ð1−VA−VRVÞCTð Þ þt VACAð Þt
þVRVCRVð Þt ð2Þ
Equation 2 was fit to each voxel TAC using the basis function method [23] and a weighted least squares (WLS) criterion, with weights based on noise equivalent counts.15O-waterK1images were registered to the cor-responding 82Rb K1 images for each subject/condition using rigid 3D versor transforms optimized by the Mattes mutual information metric. Thek2,VA, and VRV images were realigned using the same transforms. Left ventricular myocardium volumes-of-interest (VOIs) with approximate thickness of 4 mm were automatically determined for each subject’s rest and stress scans from
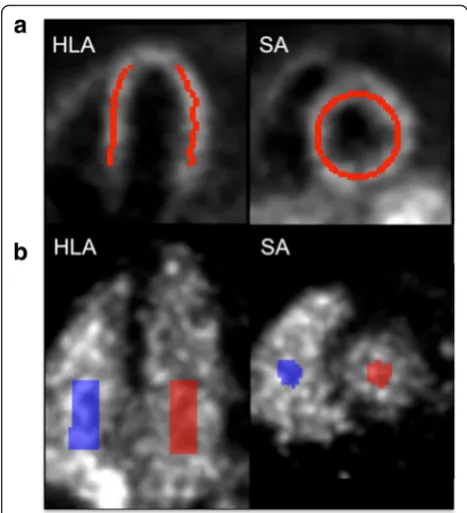
K1images, using in-house software (Fig. 1a). Model fits were performed both as three-parameter (without VRV) and four-parameter fits.
Input function estimation
IDIFs were estimated from fixed-volume (6.5 mL) cy-lindrical VOIs manually placed towards the base of the LV and atrium blood pools of each image (Fig. 1b). The resulting TACs were compared to the measured arterial input functions (AIFs) with regard to peak concentration, tail concentration, and area under the curve (AUC). For comparisons, AIFs were resampled to the image times by averaging values within each frame. Peaks were computed as the maximal activity of each TAC. Tail activity was computed as the aver-age concentration over 1 min starting at 2 min, 40 s post-injection. Percent difference in each metric was computed for corresponding pairs of IDIFs and AIFs and averaged across subjects.
With a sufficiently small LV VOI, activity is often assumed to be fully recovered [10–12]; alternatively, IDIFs are sometimes corrected for partial-volume effects. For instance, [13] assumed the LV cavity TAC is a partial-volume mixture of 85 % arterial blood and 15 % myocardial tissue. We investigated partial-volume cor-rection (PVC) methods using the AIF as the gold standard.
To assess IDIF PVC, the “true” tissue TAC CT was estimated from a mean global myocardium TAC using the AIF in Eq. 1 and 2 (omitting the VRVterm). First, a one-parameter model was investigated, where the LV recovery coefficient β was estimated from the LV TAC
CPET,LVand AIF:
CPET;LVð Þ ¼t βCAð Þ þt ð1−βÞCTð Þt : ð3Þ
An alternative two-parameter model did not constrain the sum of the coefficients to 1:
CPET;LVð Þ ¼t β1CAð Þ þt β2CTð Þt : ð4Þ
The sumβ1 +β2 might be <1 if partial-volume mixing occurs with signal outside the heart (e.g., the lung).
To perform scale correction, the parameter βs is esti-mated from:
Fig. 1aExample myocardium volume of interest (VOI), overlaid on aK1image in horizontal long axis (HLA) and short axis (SA).
CPET;LVð Þ ¼t βSCAð Þt : ð5Þ
This correction was used by [5], with tracer-independent βs≈0.90 estimated from canine
82 Rb and 13
N-ammonia PET and well counter measurements of arterial samples.
An alternative scale correctionβAUC was estimated as the ratio of the IDIF AUC to the AIF AUC:
Z T
0
CPET;LVð Þt dt¼βAUC
Z T
0
CAð Þt dt ð6Þ
where T is the duration of the dynamic acquisition. While individually estimated βAUCcannot outperformβs in terms of weighted sum-of-squared residuals (WSS) (βsminimizes WSS by design), a population-basedβAUC might give better kinetic parameter concordance.
Parameters for the one-parameter PVC, two-parameter PVC, and scaling models (Eq. 3, 4, and 5, respectively) were estimated via WLS for each acquisi-tion. Model fits were compared byFtests. The82RbK1 estimates and 15O-water k2 estimates from AIFs were compared to those fromβAUC scale-corrected IDIFs by linear Deming regression, which models error in both variables, and by the Lin concordance coefficient [24], which provides a measure of absolute agreement between two estimates.
MBF estimation
Using myocardial VOIs (Fig. 1a), MBF was estimated from the mean myocardial 15O-water k2 values, cor-rected with a partition coefficient of p= 0.91 mL/g (MBF =k2p) [25]. Finally, the parameters aand b of the generalized Renkin-Crone model [5, 7, 8]
K1¼MBF⋅ð1−ae−b=MBFÞ ð7Þ
were estimated from the mean myocardial 82Rb K1
values and 15O-water MBF. In this model,b reflects the basal permeability-surface area (PS) product and a accounts for MBF-dependent PS changes. Fits used weighted orthogonal distance regression [26] to account for errors in both variables, with weights set to the reciprocals of the variance of voxel values in the myocar-dium VOIs. There were two datapoints per subject (rest and stress). Renkin-Crone parameters were independ-ently estimated from mean kinetic parameters using (1) uncorrected IDIFs, (2) scale-corrected IDIFs, and (3) AIFs. Analyses were also performed without the VRV
term and separately for the lateral and septal walls.
Results Hemodynamics
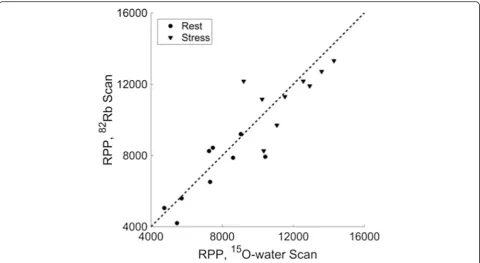
Figure 2 compares rate-pressure products (RPPs) for each pair of82Rb and15O-water scans. Mean (±standard
deviation) absolute percent difference between82Rb and 15
O-water RPP was 12 ± 9 % at rest and 11 ± 9 % under pharmacological stress. Two subjects had RPPs with greater than 20 % difference between 82Rb and 15 O-water scans at rest, and two subjects had RPPs with greater than 20 % difference between82Rb and15 O-water scans under pharmacological stress. No significant group differences between 82Rb and 15O-water RPPs were found for rest (p= 0.40) or stress (p= 0.44).
IDIF validation
Table 1 gives means and standard deviations of the per-cent differences (across seven subjects) in peak activity, tail activity, and AUC of uncorrected IDIFs with respect to AIFs. The peaks of the 82Rb IDIFs were underesti-mated by 13 and 19 % (rest, stress) compared to the AIFs, with smaller bias in AUC. An ideal IDIF might be expected to have a higher peak value, since no correc-tion for internal-body dispersion was applied to the AIFs. Mean percent differences for all15O-water metrics were within ±10 %. These results suggest that IDIF cor-rection could be beneficial for 82Rb kinetic modeling, due to poorer resolution from larger positron range and higher myocardium-to-blood-pool contrast.
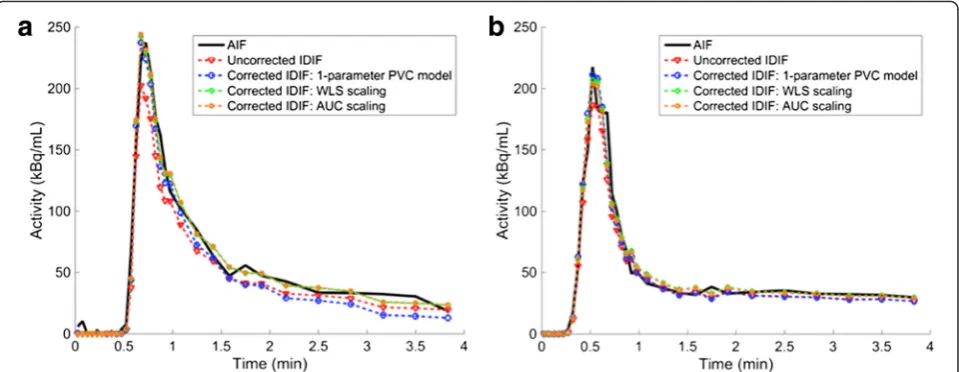
The mean and standard deviation of the parameter β from the one-parameter PVC model (Eq. 3) was 0.87 ± 0.09 (0.86 ± 0.12) for82Rb (15O-water), which are similar to the 0.85 assumed by [13]. However, the tails of 82Rb IDIFs corrected by this method were consistently under-estimated (−54 ± 29 %) compared to the AIFs; neither the two-parameter PVC model (Eq. 4) nor scaling model (Eq. 5) demonstrated this deficiency (Fig. 3a). For 15 O-water IDIFs, there was no apparent qualitative difference among correction methods (Fig. 3b).
Using the two-parameter PVC method, the mean and standard deviation of β1+β2 (Eq. 4) were 0.85 ± 0.10 (0.98 ± 0.10) for 82Rb (15O-water). This indicates that while a partial-volume mixture model of arterial blood and myocardium tissue may be sufficient for water, rubidium could require a different model of recovery-diminishing effects.
The mean and standard deviation of the scaling par-ameter βs (Eq. 5) was 0.83 ± 0.09 (0.94 ± 0.10) for 82Rb (15O-water). The scaling parameter βAUC (Eq. 6) was 0.92 ± 0.12 (0.97 ± 0.10) for82Rb (15O-water). Additional file 1: Table S1 gives mean estimated correction parame-ters by tracer and condition.
acquisitions, the two-parameter model was not superior to either one-parameter model (Eqs. 3 and 5).
The AUC scale correction (Eq. 6) cannot be compared to scaling with βs by F-test, since the WSS of the AUC scale correction will always be at least that of theβs cor-rection. With the βs correction, the difference in IDIF peak compared to AIF peak was 1 ± 17 % (3 ± 17 %) for 82
Rb (15O-water); the difference in AUC becomes 10 ± 15 % (3 ± 10 %) for82Rb (15O-water). With theβAUC cor-rection, the difference in peaks becomes −9 ± 16 % (0 ± 17 %) for 82Rb (15O-water); the difference in AUC becomes 0 ± 13 % (0 ± 10 %) for82Rb (15O-water). Though βs correction provides better peak agreement, βAUC correction improves the peak agreement while also improving AUC agreement.
Based on these results, AUC-based scaling correction was adopted. All IDIFs were corrected by multiplication
with the reciprocal of the average βAUC per tracer (1.09 for 82Rb, 1.03 for 15O-water). Eleven of 1482Rb and 10 of 14 15O-water IDIFs had better agreement (lower WSS) with the AIF after scaling, with an average decrease in WSS of 18 ± 23 and 3 ± 16 %, respectively.
Parametric images
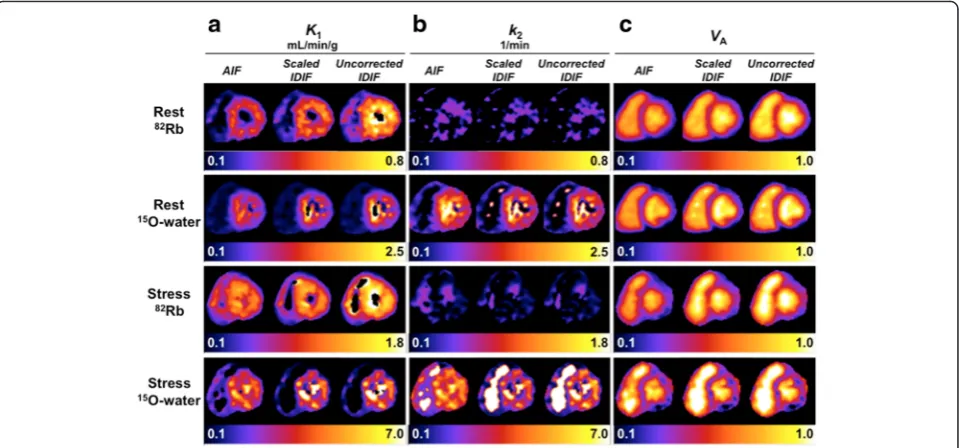
Example parametric images for one subject from the three-parameter fit are shown in Fig. 4, using each of: AIF, scaled IDIF, and uncorrected IDIF (Additional file 1: Figure S4 shows parametric images with and without the
VRV term).K1is an estimate of MBF for 15O-water and nonlinearly related to MBF for 82Rb due to incomplete extraction, so myocardial K1 (Fig. 4a) is lower for 82Rb than 15O-water (note different display scales). Naturally, stress values exceed rest values for both tracers. Because we studied healthy subjects, K1 is relatively uniform in Fig. 2Rate-pressure products (RPP) for82Rb scans versus15O-water scans. Thedashed lineis the identity line. Rest RPP was measured immediately before scan start. Stress RPP is averaged over 4 min post-injection
Table 1Comparison of uncorrected IDIFs to AIFs
AUC Peak Tail
% difference mean ± SD % difference mean ± SD % difference mean ± SD
82
Rb Rest −11 ± 12 −13 ± 9.2 −7.1 ± 18
Stress −6.0 ± 13 −19 ± 18 2.6 ± 23
15
O-water Rest −5.1 ± 10 −8.4 ± 14 −5.4 ± 9.0
Stress −1.2 ± 9.9 2.4 ± 18 −3.5 ± 7.8
the myocardium. The LV cavity is more blurred in the
K1images at stress than at rest for both tracers, presum-ably due to greater motion during stress. K1images are noisiest for 15O-water stress, where higherk2 results in greater correlation between K1 and VA, posing a more difficult estimation problem. The noisy 82Rb k2 images (Fig. 4b) show poor delineation of the myocardium due to minimal tracer washout, as rubidium is trapped by viable myocardial tissue. In contrast, 15 O-water freely diffuses in and out of tissue, so k2is pro-portional to MBF, and the k2 images mirror the K1 images. In the blood pool, k2 values are very noisy since k2 has minimal effect on model fits with K1≈0. Since the VRV term was not included here, both the RV and LV blood pools are distinctly visible in the
VA images (Fig. 4c). VA is overestimated from images using the uncorrected IDIF as compared to the AIF or scaled IDIF. The 15O-water VA images are slightly sharper than the 82Rb VA images, particularly near the septum, which may be explained by the poorer resolution of 82Rb.
For this subject, the 82Rb K1 images from corrected IDIFs showed qualitatively better agreement with those from AIFs than those using uncorrected IDIFs (Fig. 4a). Because corrected IDIFs were generated using a population-based correction factor, not all scans had comparable improvement in agreement between cor-rected IDIF- and AIF-based images. The IDIF correction factor was closer to unity for 15O-water than 82Rb, so 15
O-water K1 images were less affected by IDIF correc-tion. The IDIF correction had virtually no impact onk2 parametric images (Fig. 4b), as K1 and VA compensate changes in input function scale.
Table 2 lists mean myocardial parameter estimates across subjects (using subject-specific regions) for the uncorrected IDIFs, scaled IDIFs, and AIFs (three-param-eter fit; see Additional file 1: Table S2 for four-param(three-param-eter results). Standard deviations as a percent of the mean are similar between tracers for K1. The VA estimates, which account for both fractional blood volume and partial-volume effects, are lower for 15O-water than 82
Rb, presumably due to the better resolution of 15O. The K1data agreed better between the scaled IDIF and AIF estimates than between the uncorrected IDIF and AIF estimates;k2estimates were similar for all IFs.
This study’s mean82Rb rest and stress K1and k2 esti-mates using scaled IDIFs were comparable to those reported by [11]. The VA estimates were approximately 20 % lower than those in [11], likely attributable to IDIF correction and the improved resolution of this study’s images.
Figure 5a, b shows the good concordance between cor-rected IDIF- and AIF-based 82Rb K1 and 15O-water k2 mean myocardial estimates, respectively. Regression slopes (±standard error) for both82RbK1and15O-waterk2were close to 1.0 (1.06 ± 0.23 and 1.05 ± 0.36, respectively), and both intercepts were nearly 0 (0.025 ± 0.12 and -0.027 ± 0.51, respectively). The concordance correlation coefficient was 0.84 for both 82Rb K1 and 15O-water k2. Datapoints with poorer concordance may indicate subject motion, particularly during stress acquisitions, which affects the accuracy of IDIFs.
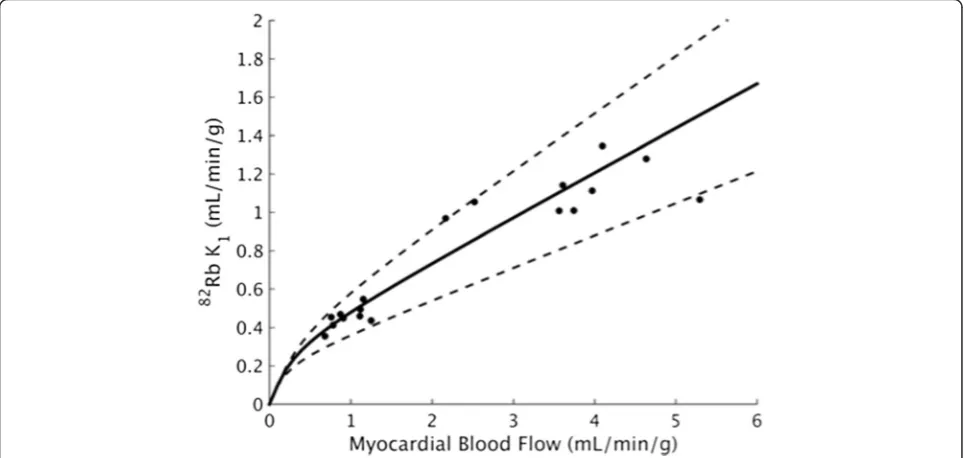
Extraction fraction parameter estimates
Figure 6 shows the Renkin-Crone model fits based on three-parameter kinetic model fits using scaled IDIFs;
Fig. 3Arterial input functions (AIFs) and image-derived input functions (IDIFs) corrected using parameters estimated for these scans from a typicala
82
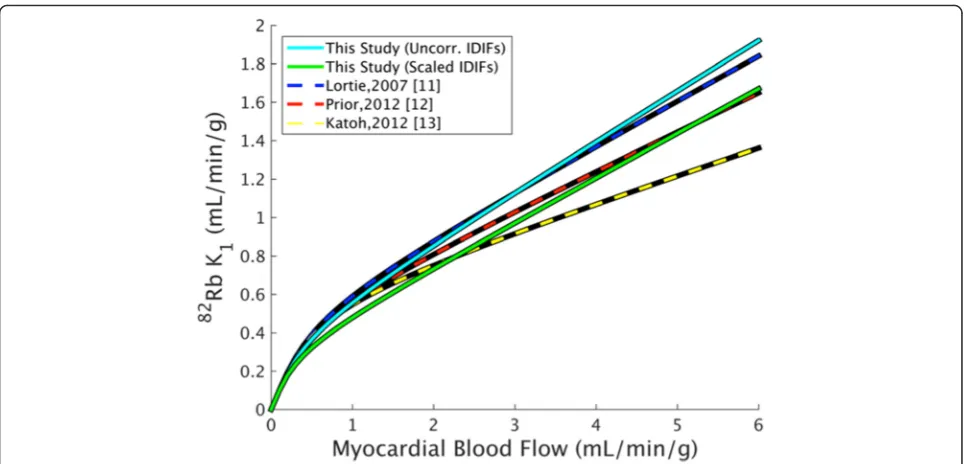
Table 3 gives corresponding parameter estimates. TheVRV term did not greatly impact Renkin-Crone fits estimated from global myocardial parameters, though omitting it resulted in greater differences between separate septal and lateral regional fits (Additional file 1: Figure S8). Figure 7 and Table 3 compare this study’s extraction model param-eter estimates (with and without IDIF correction) to several previously published fits. This study’s a estimates are in reasonable agreement with that of the six compari-son studies. Though the parameter b estimated using uncorrected IDIFs agrees with previous estimates, IDIF correction results in reducedb. The standard error of the
estimates ofaandbof this study were similar to or lower than those previously published.
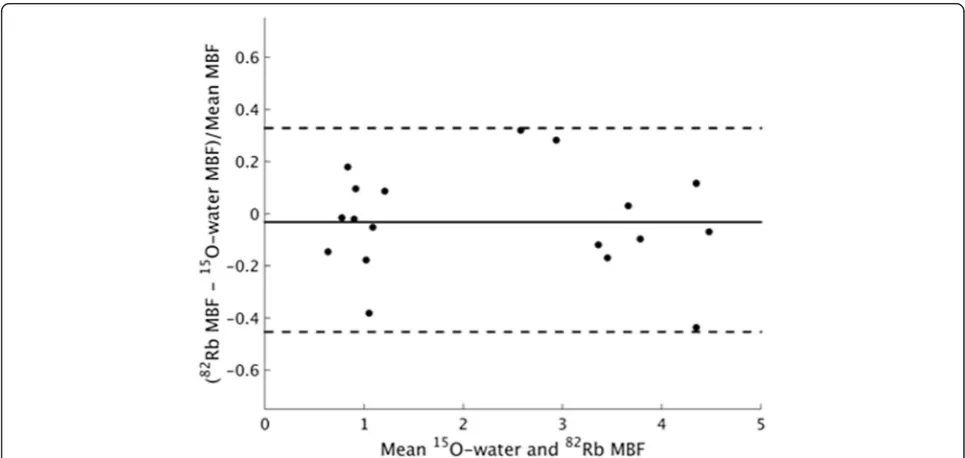
MBF estimated from 15O-water k2 (82Rb K1) was 0.96 ± 0.20 (0.91 ± 0.19) at rest and 3.73 ± 0.96 (3.59 ± 0.55) under pharmacological stress (Table 4). These flows are consistent with previously published mea-surements in healthy controls [27]. A Bland-Altman analysis shows no systematic bias between 82Rb and 15
O-water flows (p= 0.51 for paired ttest; Fig. 8). The reproducibility coefficient, defined as 1.96 times the standard deviation of the differences between the water and rubidium-based MBFs, normalized to the mean of
Fig. 4Short-axis parametric images for one subject’s15O-water and82Rb rest and stress scans, generated with different input functions.aK1 parametric images,bk2parametric images, andcVAparametric images. Background outside the heart has been omitted for display.AIFarterial sample-based input function,IDIFimage-derived input function. Right ventricle spillover correction term (VRV) not included
Table 2Mean kinetic parameter estimates from three-parameter fit (withoutVRV)
AIF Scaled IDIF Uncorrected IDIF
K1(mL/min/g) mean ± SD Rest
82
Rb 0.43 ± 0.09 0.45 ± 0.05 0.53 ± 0.06
H2 15
O 0.87 ± 0.21 0.86 ± 0.15 0.91 ± 0.16
Stress 82Rb 0.99 ± 0.19 1.11 ± 0.13 1.30 ± 0.17
H2 15
O 3.43 ± 1.62 3.53 ± 0.85 3.68 ± 0.89
k2(1/min) mean ± SD Rest
82
Rb 0.11 ± 0.05 0.13 ± 0.04 0.13 ± 0.04
H2 15
O 1.10 ± 0.31 1.05 ± 0.22 1.05 ± 0.22
Stress 82Rb 0.21 ± 0.06 0.23 ± 0.08 0.23 ± 0.08
H2 15
O 3.76 ± 1.24 4.10 ± 1.06 4.10 ± 1.06
VAmean ± SD Rest
82
Rb 0.32 ± 0.05 0.37 ± 0.04 0.40 ± 0.05
H2 15
O 0.29 ± 0.08 0.33 ± 0.05 0.34 ± 0.06
Stress 82Rb 0.31 ± 0.06 0.40 ± 0.06 0.44 ± 0.06
H2 15
O 0.27 ± 0.06 0.27 ± 0.06 0.28 ± 0.06
each water-rubidium pair, was 39 %. While this study used15O-water MBF estimated fromk2,K1-based flows were similar (Additional file 1: Figures S7 and S8).
Discussion
This study estimated Renkin-Crone extraction model parameters for rubidium using state-of-the-art 82Rb and 15
O-water TOF PET images with PSF reconstruction. IDIF estimation was validated with continuously sam-pled arterial blood measurements (AIFs).
Armstrong et al. [16] provided a comparison of reconstructions with TOF and PSF to standard
reconstructions; they reported an average increase in MBF of 10–14 % in advanced reconstructions com-pared to standard OSEM, which is consistent with im-proved recovery of signal in the myocardium. Because that study used only82Rb, extraction could not be esti-mated from the advanced reconstructions.
The PSF modeling used here was not isotope-specific. Because 15O and 82Rb have poorer resolution than 18F, the PSF modeling will provide only partial resolution recovery. Though the employed reconstruction should provide better resolution than reconstruction without PSF modeling, there is further room for improvement.
Fig. 5aComparison of mean myocardial82RbK1values using scale-corrected IDIFs vs. AIF.bComparison of mean myocardial15O-waterk2 values. Parameters were estimated with the three-parameter model (omitting right ventricle spillover term). Thesolid linesandequationsrepresent fits from Deming regression. Thedashed lineis the identity line.AIFarterial sample-based input function,IDIFimage-derived input function
Resolution modeling in PET reconstruction can produce ringing artifacts that significantly impact quantification [28]. These effects are most often detectible in simulation and phantom studies with well-defined object borders. Here, because of the additional blurring incurred by uncompensated cardiac and respiratory motion and mod-est Gaussian filtering applied pre-modeling, Gibbs-like artifacts were not observed.
While PSF modeling and TOF can provide improved resolution, the primary benefit in this application is reduced noise in the parametric images. For representative maps of the standard error of82Rb K1and 15O-water k2, see Additional file 1: Figure S9.
In 3D PET with high injected activities, inaccurate corrections for detector deadtime can impact the
accuracy of reconstructed activity in early frames. A pre-vious patient study on the Biograph mCT suggests that doses of82Rb <1110 MBq can avoid significant detector saturation [29]. The doses used in the present study were on average ~60 % of this, and none exceeded it. Based on the peak singles rates, the average peak dead-time was 35 ± 8 % (32 ± 7 %) for82Rb (15O-water).
PET image resolution is affected by positron range, detector resolution, smoothing in the reconstruction, and motion. Poor resolution affects quantification of myocardial activity and IDIFs. To minimize the impact of these effects on IDIFs, VOIs are typically small and central in the blood cavity where spill-in and spill-out are presumed insignificant. IDIF accuracy is important to kinetic modeling results; simulations show that a
Table 3Renkin-Crone parameter estimates from this and published studies
Renkin-Crone parameter estimates
Species Flow measurement Kinetic model Input function correction a± SE b± SE
This study Human 15O-water 1TCM None 0.74 ± 0.03 0.51 ± 0.09
Scaling 0.77 ± 0.03 0.39 ± 0.06
Yoshida 1996 [5] Dog 13N-ammonia Retention Scaling 0.85 ± 0.03 0.45 ± 0.08
Lortie 2007 [11] Human 13N-ammonia 1TCM None 0.77 ± 0.05 0.63 ± 0.17
Lautamaki 2009 [10] Dog Microspheres 1TCM None 0.89 0.68
Prior 2012 [12] Human 15O-water 1TCM None 0.80 ± 0.04 0.59 ± 0.14
Katoh 2012 [13] Human 15O-water 1TCM 2-parameter partial-volume correction 0.86 0.54
Renaud 2013 [30] Human 13N-ammonia Retention None 0.92 0.74
IDIFimage-derived input function,SEstandard error
10 % error in the IF peak can bias82RbK1estimates by up to 25 % [18]. Thus, verification of IDIF accuracy is highly important.
IDIFs had lower correspondence with AIFs for rubidium than water, particularly in terms of peak activity. Unlike water, rubidium is retained in myocardial tissue, causing the tail of the blood pool TAC to fall below that of the myocardium TAC (water IDIFs will have matched activity in the tails of the LV cavity and myocardium TACs). When 82
Rb images are degraded by motion and resolution ef-fects, expected consequences for IDIFs are reduced peak activity (spill-out from LV cavity) and increased tail activ-ity (spill-in from myocardium). Though prior publications’ images [11, 12] were likely of poorer resolution than this study’s, their IDIFs were uncorrected. In the current study, we primarily observed reduced peak activity in82Rb IDIFs, with differences in tail activity inconsistent with a strict model of geometric PVC (Eq. 3). In Katoh et al. [13], LV TACs were corrected using a PVC model; that model overcorrected the tails of our 82Rb IDIFs. A mismatch between82Rb IDIFs and AIFs was better described using a
two-parameter model (Eq. 4), which provides for signal mixing with background regions. The simpler scale factor correction (Eq. 5), which recovers activity from an un-specified combination of resolution degradation effects, gave comparable results. For half the 82Rb acquisitions, the AUC-based scale factor βAUC (Eq. 6) was approximately equal to the scan-specificβs(Eq. 5). For the rest,βAUCwas markedly higher thanβs; in these cases, the IDIF more greatly underestimated the AIF peak, with lower error in the tail. When βs is used to correct these cases, though the average peak error is reduced to ~0, the average AUC is overestimated, because tail activity is overestimated.
We chose scaling IDIFs based on AUC matching as more appropriate than WLS-based scaling. For15O-water, the differences between the two methods were small. 82
Rb, however, is more sensitive to the input function AUC, as its uptake is approximately irreversible. For such tracers, tissue activity is directly proportional to the input function AUC, so errors in the AUC propagate into the parameter estimates.
Given our AIF measurements and anticipating that population-based IDIF correction is most practical for scans without arterial sampling, we used mean tracer-dependent scale factors to correct IDIFs. However, the optimal correction factor is scan-dependent, conditional on variations in VOI size and placement, heart size, breathing pattern, and subject motion. Further investiga-tion is required to assess generalizability to other scanners and reconstruction algorithms. Using AIFs for modeling does not guarantee accurate parameter estimates, as error
Table 4Extraction-corrected population estimates of
myocardial blood flow, mean (±standard deviation)
82Rb MBF (mL/min/g) 15O-water MBF
(mL/min/g)
Uncorrected IDIF Rest 0.92 ± 0.19 0.96 ± 0.20
Stress 3.65 ± 0.64 3.73 ± 0.96
Scaled IDIF Rest 0.91 ± 0.19 0.96 ± 0.20
Stress 3.59 ± 0.55 3.73 ± 0.96
IDIFimage-derived input function,MBFmyocardial blood flow
in myocardial TACs not addressed by the partial-volume fractionsVAandVRV(Eq. 2) could induce bias. Body and respiratory motion are likely principal sources of error. One limitation this study shares with previous publica-tions is that no motion compensation was incorporated.
The Renkin-Crone model fits obtained in this study are similar to previously published fits, though ourbestimate is lower, primarily a reflection of lower82RbK1estimates in this study compared to others, from the IDIF correction that was applied. With uncorrected IDIFs, extraction parameters obtained in this study closely match those previously published by Lortie [11]. Because scaling correction impacts82Rb K1 but not 15O-waterk2, scaled IDIFs resulted in a decrease in the b parameter of the Renkin-Crone model. For most previous studies, there was no gold standard measurement of the input function, and therefore, no basis for IDIF correction. Katoh et al. [13] used partial-volume corrected IDIFs, which explains the better agreement between their extraction model and that from corrected IDIFs in this study, compared to the Lortie model. The a parameter of the Renkin-Crone model is less sensitive to IDIF correction and reported values vary less across the literature.
Some differences in Renkin-Crone fits can also be ex-plained by the flow estimation method. For instance, [11] used 13N-ammonia to measure MBF, which has a lower extraction fraction than15O-water and will hence under-estimate MBF. Using unweighted ODR to fit the data instead of weighted ODR resulted in higher parameter es-timates (Additional file 1: Figure S10). Average MBFs were similar regardless of IDIF correction because water-based flows were unaffected by IDIF scaling and extraction pa-rameters were estimated separately for each case. There-fore, accurate flows can be determined for 82Rb with or without IDIF correction, if extraction parameters have been estimated from data processed similarly. This sug-gests that modeling choices could have greater impact on extraction fraction estimates than TOF and PSF modeling, though TOF/PSF-based kinetic parameters have lower standard error.
Conclusions
We have presented parameter estimates for the generalized Renkin-Crone model of extraction for 82Rb PET using human82Rb and15O-water PET from high-resolution im-ages from a state-of-the-art TOF-capable scanner with PSF reconstruction. The image-derived input functions were validated against direct arterial measurements, and a scale correction improved the accuracy of IDIFs. With this IDIF correction, MBF should be estimated from 82Rb K1using the Renkin-Crone parameters reported here. These results provide a state-of-the-art methodology for MBF measure-ment with 82Rb PET, though further validation will be
necessary in patients with coronary artery disease with infarcts and ischemia.
Additional file
Additional file 1:Figures S1–S10 and Tables S1–S2. (PDF 2.93 mb)
Abbreviations
AIF, arterial input function; IDIF, image-derived input function; LV, left ventricle; MBF, myocardial blood flow; PSF, point spread function; PVC, partial-volume correction; RPP, rate-pressure product; RV, right ventricle; TAC, time activity curve; TOF, time-of-flight; VOI, volume of interest; WLS, weighted least squares
Funding
This work was supported by Siemens Medical Solutions and NIH grants 1S10OD010322-01 and 1F31EB018720-01. This publication was made possible by CTSA Grant Number UL1 TR000142 from the National Center for Advancing Translational Science (NCATS), a component of the National Institutes of Health (NIH). Its contents are solely the responsibility of the authors and do not neces-sarily represent the official view of NIH.
Availability of data and materials
The data supporting the conclusions of this article are included within the article (and its additional files).
Authors’contributions
JR and NN performed synthesis of15O-water. CL, AS, RC, EA, and HF designed the imaging protocol and assisted in image acquisition. MG, TM, and KF performed data processing and analysis. MG, RC, AS, KF, CL, and TM prepared the manuscript. All authors read and approved the final manuscript.
Competing interests
The authors declare that they have no competing interests.
Consent for publication
Not applicable.
Ethics approval and consent to participate
All procedures performed in studies involving human participants were in accordance with the ethical standards of the Yale University Human Investigation Committee and with the 1964 Helsinki declaration and its later amendments or comparable ethical standards. All participants signed a consent form.
Author details
1Biomedical Engineering, Yale University, New Haven, CT, USA.2PET Center,
Diagnostic Radiology, School of Medicine, Yale University, New Haven, CT, USA.3Yale Cardiovascular Research Center, Section of Cardiovascular
Medicine, Department of Internal Medicine, Yale University, New Haven, CT, USA.4PET Center, Yale School of Medicine, PO Box 208048, New Haven, CT
06520-8048, USA.
Received: 11 March 2016 Accepted: 30 June 2016
References
1. Grover-McKay M, Ratib O, Schwaiger M, Wohlgelernter D, Araujo L, Nienaber C, et al. Detection of coronary artery disease with positron emission tomography and rubidium 82. Am Heart J. 1992;123:646–52. 2. Parkash R, Ruddy T, Kitsikis A, Hart R, Beauschene L, Williams K, et al.
Potential utility of rubidium 82 PET quantification in patients with 3-vessel coronary artery disease. J Nucl Cardiol. 2004;11:440–9.
3. Sampson UK, Dorbala S, Limaye A, Kwong R, Di Carli MF. Diagnostic accuracy of rubidium-82 myocardial perfusion imaging with hybrid positron emission tomography/computed tomography in the detection of coronary artery disease. J Am Coll of Cardiol. 2007;49:1052–8.
emission tomography facilitate detection of multivessel coronary artery disease? J Nucl Cardiol. 2012;19:670–80.
5. Yoshida K, Mullani N, Gould KL. Coronary flow and flow reserve by PET simplified for clinical applications using rubidium-82 or nitrogen-13-ammonia. J Nucl Med. 1996;37:1701–12.
6. Mullani NA, Goldstein RA, Gould KL, Marani SK, Fisher DJ, O’Brien HA, et al. Myocardial perfusion with rubidium-82. I. Measurement of extraction fraction and flow with external detectors. J Nucl Med. 1983;24:898–906. 7. Renkin EM. Transport of potassium-42 from blood to tissue in isolated
mammalian skeletal muscles. Am J Physiol. 1959;197:297.
8. Crone C. The permeability of capillaries in various organs as determined by use of the‘indicator diffusion’method. Acta Physiol Scand. 1963;58:292–305. 9. Moody J, Murthy V, Lee B, Corbett J, Ficaro E. Variance estimation for myocardial
blood flow by dynamic PET. IEEE Trans Med Imag. 2015;34:2343–2353. 10. Lautamäki R, George RT, Kitagawa K, Higuchi T, Merrill J, Voicu C, et al.
Rubidium-82 PET-CT for quantitative assessment of myocardial blood flow: validation in a canine model of coronary artery stenosis. Eur J Nucl Med Mol Imaging. 2009;36:576–86.
11. Lortie M, Beanlands RS, Yoshinaga K, Klein R, DaSilva JN. Quantification of myocardial blood flow with 82Rb dynamic PET imaging. Eur J Nucl Med Mol Imaging. 2007;34:1765–74.
12. Prior JO, Allenbach G, Valenta I, Kosinski M, Burger C, Verdun FR, et al. Quantification of myocardial blood flow with 82Rb positron emission tomography: clinical validation with 15O-water. Eur J Nucl Med Mol Imaging. 2012;39:1037–47.
13. Katoh C, Yoshinaga K, Klein R, Kasai K, Tomiyama Y, Manabe O, et al. Quantification of regional myocardial blood flow estimation with three-dimensional dynamic rubidium-82 PET and modified spillover correction model. J Nucl Cardiol. 2012;19:763–74.
14. Tipnis S, Hu Z, Gagnon D, O’Donnell J. Time-of-flight PET for Rb-82 cardiac perfusion imaging. J Nucl Med. 2008;49:74.
15. DiFilippo F, Brunken R. Benefit of time-of-flight reconstruction for cardiac PET of obese patients [Abstract]. J Nucl Med Soc Nuclear Med. 2013;54:405. 16. Armstrong IS, Tonge CM, Arumugam P. Impact of point spread function
modeling and time-of-flight on myocardial blood flow and myocardial flow reserve measurements for rubidium-82 cardiac PET. J Nucl Cardiol. 2014;21:467–74.
17. Presotto L, Gianolli L, Gilardi M, Bettinardi V. Evaluation of image reconstruction algorithms encompassing time-of-flight and point spread function modelling for quantitative cardiac PET: phantom studies. J Nucl Cardiol. 2015;22:351–63.
18. Meyer C, Peligrad D-N, Weibrecht M. Assessment of input function distortions on kinetic model parameters in simulated dynamic 82 Rb PET perfusion studies. Nucl Instrum Meth A. 2007;571:199–202.
19. Weinberg I, Huang S, Hoffman E, Araujo L, Nienaber C, McKay MG, et al. Validation of PET-acquired input functions for cardiac studies. J Nucl Med. 1988;29:241–7.
20. Murthy VL, Lee BC, Sitek A, Naya M, Moody J, Polavarapu V, et al. Comparison and prognostic validation of multiple methods of quantification of myocardial blood flow with 82Rb PET. J Nucl Med. 2014;55:1952–8.
21. Coxson PG, Huesman RH, Borland L. Consequences of using a simplified kinetic model for dynamic PET data. J Nucl Med. 1997;38:660. 22. Bergmann S, Fox K, Rand A, McElvany K, Welch M, Markham J, et al.
Quantification of regional myocardial blood flow in vivo with H215O. Circulation. 1984;70:724–33.
23. Lodge MA, Carson RE, Carrasquillo JA, Whatley M, Libutti SK, Bacharach SL. Parametric images of blood flow in oncology PET studies using [15O] water. J Nucl Med. 2000;41:1784–92.
24. Lawrence I, Lin K. A concordance correlation coefficient to evaluate reproducibility. Biometrics. 1989;45:255–68.
25. Iida H, Kanno I, Takahashi A, Miura S, Murakami M-t, Takahashi K, et al. Measurement of absolute myocardial blood flow with H215O and dynamic positron-emission tomography. Strategy for quantification in relation to the partial-volume effect. Circulation. 1988;78:104–15.
26. Boggs PT, Donaldson JR, Schnabel RB. Algorithm 676: ODRPACK: software for weighted orthogonal distance regression. ACM Trans Math Softw. 1989; 15:348–64.
27. Sdringola S, Johnson NP, Kirkeeide RL, Cid E, Gould KL. Impact of unexpected factors on quantitative myocardial perfusion and coronary flow reserve in young, asymptomatic volunteers. JACC Cardiovasc Imaging. 2011; 4:402–12.
28. Tong S, Alessio AM, Thielemans K, Stearns C, Ross S, Kinahan PE. Properties and mitigation of edge artifacts in PSF-based PET reconstruction. Nucl Sci IEEE Trans. 2011;58:2264–75.
29. Tout D, Tonge CM, Muthu S, Arumugam P. Assessment of a protocol for routine simultaneous myocardial blood flow measurement and standard myocardial perfusion imaging with rubidium-82 on a high count rate positron emission tomography system. Nucl Med Commun. 2012;33:1202–11. 30. Renaud JM, DaSilva JN, Beanlands RS. Characterizing the normal range of
myocardial blood flow with 82rubidium and 13 N-ammonia PET imaging. J Nucl Cardiol. 2013;20:578–91.
Submit your manuscript to a
journal and benefi t from:
7Convenient online submission
7Rigorous peer review
7Immediate publication on acceptance
7Open access: articles freely available online
7High visibility within the fi eld
7Retaining the copyright to your article