R E S E A R C H A R T I C L E
Open Access
Quantitative mapping of trace elements
in agate using LA-ICP-MS
Chan-Soo Park
1, Hyung Seon Shin
1, Keewook Yi
1, Hana Cho
1and Yoonsup Kim
2*Abstract
Background:Laser ablation inductively coupled plasma mass spectrometry (LA-ICP-MS) is an optimized technique for the quantitative mapping of trace elements on geological materials. Agate is an aggregate of microcrystalline silica showing a variety of colorful bands due to the species and concentrations of transition metals and is thus an appropriate sample to test the availability, efficiency, and detection limit of LA-ICP-MS trace element mapping. Methods:Two fortification agate samples selected for elemental mapping are characterized by the colorful and bluish banding layers, respectively. The colorful agate sample consists mainly of two growth zones varying in color from pale orange-red brown to gray tones, whereas the blue agate sample simply shows alternating blue and white bands. Two different types of mineral inclusions, Fe oxide/hydroxide and hollandite (Ba(Mn4+6 Mn
3+
2 )O16), were identified in the inner and outer halves of the former sample, respectively. The distribution patterns of eight trace elements in these samples, including Al, Co, Cr, Cu, Fe, Mn, Ni, and Ti, were investigated, using both electron microprobe and LA-ICP-MS.
Results:Aluminum and Fe are the most abundant trace elements in both agate samples up to 5000 ppm although their concentrations in the colorful agate sample are an order of magnitude higher than those in the blue agate sample. The concentrations of other elements in the agate samples are several parts per million levels. The quantitative maps of the colorful agate sample have shown that Fe was mainly distributed in the inner half, but Al, Cu, and Mn in the outer half. In particular, Fe and Mn were primarily concentrated as small spots. On the other hand, the oscillatory zoning patterns are apparent in the quantitative maps of the blue agate sample, showing a correlative relationship between Al and Ti but an antithetic relationship between Al and Fe. The Al and Fe distribution patterns of the colorful agate sample are reproduced in the Al Kαand Fe KαX-ray maps, but not clear in blue agate.
Conclusions:Quantitative elemental maps using LA-ICP-MS are privileged to visualize trace elements distributions.
Keywords:LA-ICP-MS, Quantitative mapping, Trace element distribution, Agate
Background
Inductively coupled plasma mass spectrometry (ICP-MS) has become the most widely accepted analytical technique for simultaneously measuring a range of trace elements at variable concentration levels (Durrant 1999; Günther and Heinrich 1999; Günther et al. 2000; Sylvester 2001a; Heinrich et al. 2003). Laser ablation (LA) system is powerful and versatile for in situ microsampling of solid materials including geological samples particularly when it is attached to ICP-MS (e.g., Jackson et al. 1992; Norman
et al. 1996, Günther et al. 1997; Jeffries et al. 1998; Niemax 2001; Heinrich et al. 2003; Günther and Hattendorf 2005; Large et al. 2009; Koenig et al. 2009; Ulrich et al. 2009). The development and application of laser ablation induct-ively coupled plasma mass spectrometry (LA-ICP-MS) have grown with a dramatic rate, and in situ analyses for elemental abundances and isotopic compositions are now performed routinely in numerous laboratories worldwide.
In addition to LA-ICP-MS, both ion and electron mi-croprobes are commonly used for in situ analysis of trace elements (Müller et al. 2003). An electron micro-probe has advantages of the smallest sampling volume and well-established data reduction procedures as well * Correspondence:[email protected]
2Department of Earth and Environmental Sciences, Chungbuk National
University, Cheongju 362-763, Republic of Korea
Full list of author information is available at the end of the article
as quantitative calibration methods, but extreme care is required for elements at very low abundances. In many cases, even long counting times coupled with a detailed background characterization may not achieve the re-quired sensitivity of a trace element (Müller et al. 2003). Ion microprobe has the main strength on both high sen-sitivity and small sampling volume. However, the severe matrix effect in this technique commonly prevents us from quantitative analyses in the absence of appropriate standard materials (Hinton 1990). LA-ICP-MS analyses combine the strength of the above techniques: relatively straightforward calibration procedures with a low detec-tion limit. A glass reference sample is applicable to the quantitative analyses of trace elements for different types of materials with acceptable uncertainties. However, LA-ICP-MS has relatively poorer spatial resolution and requires relatively larger sampling volumes than both electron and ion microprobes (Woodhead et al. 2007).
The quantitative mapping of trace elements in geo-logical samples has been facilitated by LA-ICP-MS (Treble et al. 2003; Fairchild et al. 2006; Montagna et al. 2007). It is also possible with other microanalytical tech-niques such as ion microprobe, proton-induced X-ray emission (PIXE), and synchrotron X-ray fluorescence (Woodhead et al. 2007; Ulrich et al. 2009). In contrast to the above methods, LA-ICP-MS trace element mapping is the only technique performing at low limits of detec-tion for a wide range of elements in a relatively short ac-quisition time. The application of quantitative element distribution maps using LA-ICP-MS has been acceler-ated with the development of analytical protocol and easy-to-use software such as Iolite (Woodhead et al. 2007; Ulrich et al. 2009).
Agate is an aggregate of various forms of microcrystal-line silica, mainly chalcedony, and is generally formed by chemical precipitation in rock cavities (Götze et al.
2001). Chalcedony occurs commonly in a
semi-transparent or translucent state, with waxy luster, and varies widely in color, in contrast to colorless, transpar-ent microcrystalline quartz (Polk 2012). Transition metals incorporated during the precipitation color agates (Götze et al. 2001; Möckel et al. 2009). The species and concentration of transition metals in agate are com-monly reflected by its rhythmic color banding (Heaney and Davis 1995). The shade of color is further modified when these elements work in combination. Thus, agate is an appropriate sample to test the availability, effi-ciency, and detection limit of LA-ICP-MS trace element mapping. In this study, the distribution patterns of trace elements in two agates were investigated, using LA-ICP-MS, for demonstrating (1) the advantages of LA-ICP-MS trace element mapping through a correlation between the colors and concentrations of trace elements in the agate samples and (2) the analytical uncertainties and
detection limits on the analyses of trace elements best optimized in the study.
Sample descriptions
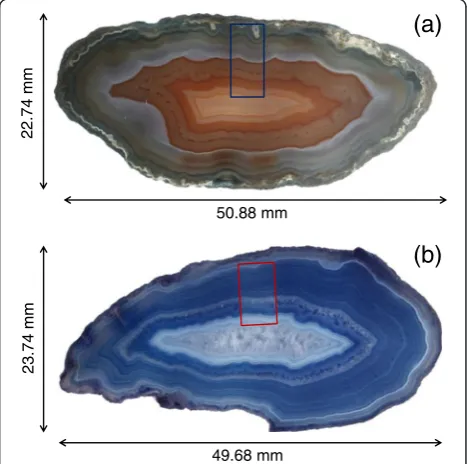
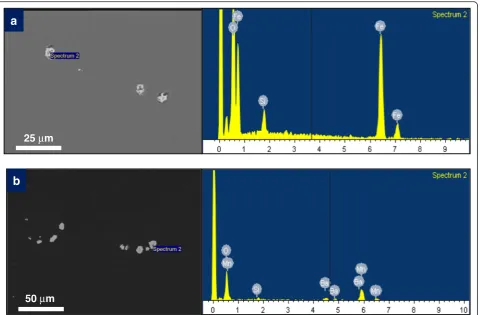
Two fortification agate samples were selected for elem-ental mapping because of their sub-radial growth to-wards the center. Both samples are oval in shape with approximately 50-mm-long major axes and are charac-terized by the colorful and bluish banding layers, re-spectively. The colorful agate sample is mainly divided into two growth zones: the inner and outer halves on the basis of ~0.2-mm-thick white band (Fig. 1a). The inner half shows varying colors, from pale orange to red brown whereas the outer half is generally composed of color bands in gray tones. On the other hand, the blue agate sample simply shows alternating blue and white bands (Fig. 1b). Using an optical microscope, numerous small mineral inclusions were observed in the inner and outer halves of the former sample. Two different types of mineral inclusions were identified under scanning electron microscopy. In the inner half, Fe oxide/hydrox-ide is mainly distributed as clusters of oriented crystal-lites (up to 10 μm long) (Fig. 2a) whereas mineral inclusions in the outer half are mainly ~10-μm-long hol-landite (Ba(Mn4+6 Mn3+2 )O16) (Fig. 2b). On the other hand, no mineral inclusions were observed in the blue agate
50.88 mm
m
m
4
7.
2
2
(a)
49.68 mm
m
m
4
7.
3
2
(b)
sample. The ablated area of each sample is represented by an open rectangle (Fig. 1a, b)
Methods
Qualitative mapping was carried out, using a Shimadzu 1600 electron microprobe equipped with wavelength-dispersive spectrometers (WDS) at the Jeonju branch of Korea Basic Science Institute (KBSI), by measuring in-tensities of the Al Kα, Co Kα, Cr Kα, Cu Kα, Fe Kα, Mn Kα, Ti Kα, and Ni Kα characteristic X-ray lines consid-ered as potential chromophores in agate (Table 1). The analytical conditions were under the instrumental settings
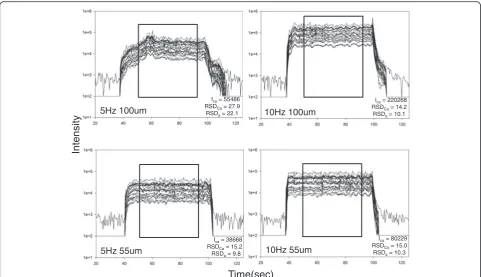
at 15 keV accelerating voltage, 1μm beam size, and 20 nA current with 50 ms dwell time per pixel. Quantitative mapping was carried out, using a New Wave UP213 Nd:YAG laser ablation system attached to a Thermo X Series 2 quadrupole ICP-MS in the ICP-MS laboratory of KBSI. A series of parallel line scans was combined to image trace elemental maps. This method was superior to a mosaic of spot analyses because no interpolation be-tween the spot analyses was necessary. Moreover, down-hole fractionation was minimized in the method, and acquisition time was significantly saved. The 10-Hz repeti-tion rate and 55-μm spot size of laser beam were used be-cause the stability and intensity of ion signals as well as spatial resolution of images were best optimized at the condition (Fig. 3). Lines were scanned at 10 μm/s speed with 60-μm spacing between adjacent line scans. The common quadrupole and imaging parameters used in the study are listed in Table 2.
NIST612 SRM glass was used as the external standard and 29Si as the internal standard assuming stoichiomet-ric quartz. The oxidation rate was monitored using the ThO+/Th+ratios of the external standard and was main-tained below 1 % during the analyses. The data reduc-tion and image processing of chemical data were conducted with Iolite software (Hellstrom et al. 2008;
25 µm
50 µm
b
a
Fig. 2Back-scattered electron images ofaFe oxide/hydroxide andbhollandite inclusions in agate, together with the corresponding EDS spectra
Table 1The correlation between the chemical composition and color of agate bands
Chemical composition Color
Iron oxide Red, brown, black, green
Manganese Pink, violet, black
Chromium Green, yellow, red
Titanium Blue
Cobalt Red
Nickel Green
Ulrich et al. 2009; Paton et al. 2011). The main advan-tage of this software is its capability to render line scans into quantitative element distribution images. Outlier re-jection was applied to each line scan based on a 2σ threshold. The dwell times for each trace element were 10 ms per analyte.
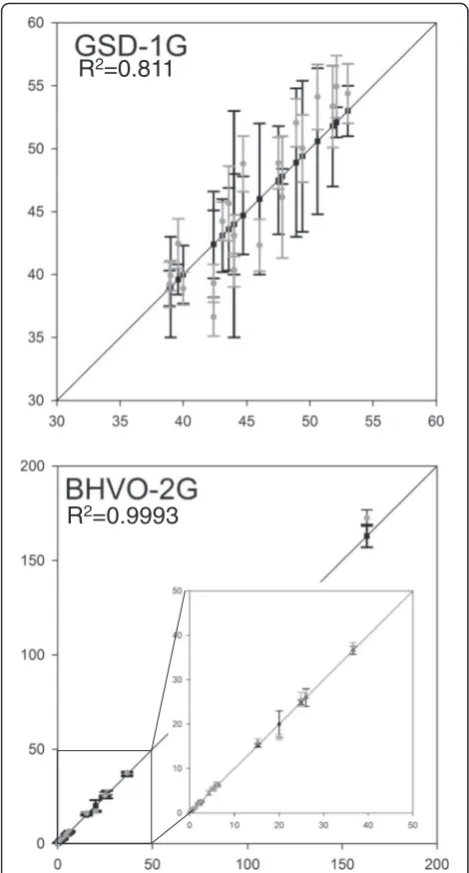
The accuracy of line analyses was estimated against two USGS microchemical standard materials (GSD-1G and BHVO-2G), using the above analytical conditions. The former reference material has a relatively constant concentration level (~54 ppm) for all trace elements,
whereas the latter has a range of concentrations of trace elements from 0.3 up to 163 ppm. Concentrations of 20 trace elements were measured within 20 % error esti-mates, with respect to the reference values of GSD-1G and BHVO-2G (Fig. 4). In the case of GSD-1G, the RSD values were calculated within 5 % in almost all the ele-ments. For BHVO-2G, however, the RSD values has in-creased with decreasing concentrations of the trace elements: the RSD values less than 5.5 % for trace ele-ments over 10 ppm, the RSD range of 5.9~8.9 % for trace elements between 4 and 10 ppm, and the RSD range of 10~20 % for trace elements less than 4 ppm. The coefficient of determination (R2) for a linear rela-tionship between the measured and reference concentra-tions of GSD-1G and BHVO-2G was calculated as 0.811 and 0.9993, respectively.
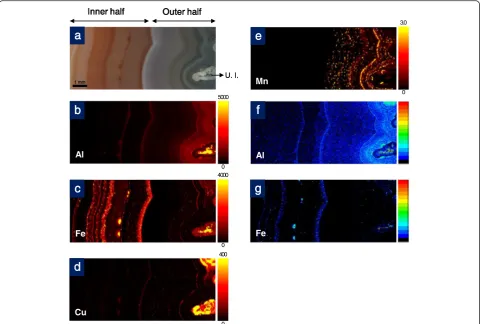
Results Colorful agate
Aluminum and Fe were the most abundant trace ele-ments in the colorful agate sample, up to 5000 and 4000 ppm, respectively, whereas Cu, Mn, and Co were minor, less than 200, 3, and 5 ppm, respectively. The heterogeneous distribution of trace elements in the sam-ple was shown in four quantitative maps of Al, Fe, Cu, and Mn (Fig. 5). Aluminum concentration was particu-larly high in the outer half characterized by grayish color 5Hz 100um
Ica= 55486
RSDCa= 27.9
RSDa= 22.1 10Hz 100um
Ica= 220268
RSDCa= 14.2
RSDa= 10.1
5Hz 55um
Ica= 38668
RSDCa= 15.2
RSDa= 9.8 10Hz 55um
Ica= 80229
RSDCa= 15.0
RSDa= 10.3
yti
s
n
et
nI
Time(sec)
Fig. 3Signal intensities and signal stabilities depending on the experimental conditions (repetition and spot size) during line scanning. NIST 612 glass was used for determining the optimal measurement conditions
Table 2LA-ICP-MS instrument settings
RF power (W) 1200
Ar nebulizer flow (L/min) 0.73
Ar auxiliary gas (L/min) 0.85
Ar cooling gas (L/min) 13.5
Laser wavelength (nm) 213
He carrier gas (L/min) 0.70
ThO+/Th+(%) <1
Repetition rate (Hz) 10
Energy density (J/cm2) 11
Dwell time (ms) 10
Scan speed (μm) 10
(Fig. 5a, b). The element was also concentrated at nar-row bands and small spots in the middle part although it was generally absent in the inner half. On the other hand, several Fe-rich bands as well as many Fe-rich small spots were observed in the inner half (Fig. 5a, c). The distribution of Cu and Mn in the sample was simi-lar to that of Al although these elements were concen-trated mainly as small spots (Fig. 5d, e). In the X-ray maps, only Al and Fe showed the heterogeneous elem-ental distribution of colorful agate sample (Fig. 5f, g). Their distribution patterns resembled those of equivalent quantitative maps, but the boundaries of narrow bands
and the overall background levels were blurred and in-creased, respectively.
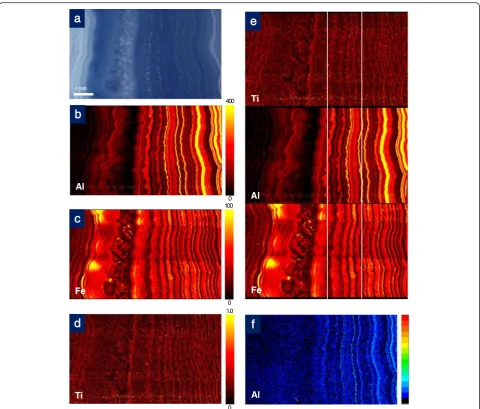
Blue agate
Aluminum and Fe were also the most abundant trace el-ements in the blue agate sample, up to 400 and 100 ppm, respectively, whereas Mn and Ti were minor, less than 15 and 1 ppm, respectively. Heterogeneous elemental distribution was observed in the Al, Fe, and Ti quantitative maps of the blue agate sample (Fig. 6). All the elements were concentrated as narrow bands oscil-lating their concentrations (Fig. 6b–d). The oscillatory zoning pattern of Al was consistent with that of Ti, but was antithetic to that of Fe (Fig. 6e). In the X-ray map, only Al showed the heterogeneous elemental distribu-tion of the blue agate sample (Fig. 6f ). Although the resolution of image was much poorer, its distribution pattern resembled that of equivalent quantitative map particularly in the outer part of the sample, but not in the inner part (Fig. 6b, f ).
Discussion
Aluminum was the most abundant trace element in both agate samples and also showed the widest variation in concentration ranging from several thousands of parts per million to hundreds of parts per million, with sharp boundaries between the compositionally distinct bands (Figs. 5b and 6b). The compositional variation and rhyth-mic banding of Al in the samples are typical for silica pre-cipitation at low temperatures below 300 °C (Rusk et al. 2011). Agates commonly contain considerable amounts of mineral and fluid inclusions possibly responsible for their different coloration (Götze et al. 2001). The quantitative Fe and Mn elemental maps and microscopic images of the colorful agate sample clearly showed spot-shaped numeral mineral inclusions definitely changing from Fe oxide/hy-droxide in the inner half to Mn-bearing hollandite in the outer half (Fig. 5c, e). The distribution of Fe ions was highlighted in either Fe oxide/hydroxide inclusions or chalcedony structure as a substitute for Si4+particularly in the inner half (Fig. 5c), whereas that of Mn ions was mainly restricted to hollandite inclusions in the outer half (Fig. 5e). The distribution patterns indicate that the valence state of Mn remained tri- and tetra-valent during the silica precipitation of outer half and further suggest that redox conditions and/or fluid compositions might change significantly between two distinct growth zones (Barnaby and Rimstidt 1989; Götze et al. 2012). The change is also reflected by the different coloration of two growth zones in the colorful agate sample from pale orange-red brown to gray in combination with Cu and Co (Table 1; Fig. 5). On the other hand, the blue agate sample does not show conspicuous mineral inclusions. Aluminum, Fe, and Ti ions were distributed in the sample as a
R
2=0.811
R
2=0.9993
replacement for Si4+. The oscillatory zoning patterns of Al, Fe, and Ti were apparent in the sample (Fig. 6b–d). Such fluctuations of trace element concentrations might be asso-ciated with abundance of microcrystalline quartz (Götze et al. 2001). The partitioning of trace elements into chalced-ony stronger than that into microcrystalline quartz might result in the concentration of transition metals at bluish bands.
The quantitative maps of trace elements in two agate samples show several lines of advantages on the LA-ICP-MS mapping technique. The quantitative Mn and Ti maps of colorful and blue agate samples, respectively, suggest that the compositional zonation of trace ele-ments can be observed with their concentrations down to several parts per million levels (Figs. 5e and 6d). Ana-lytical time spent for the quantitative mapping was ca. 18 h. Moggi-Cecchi et al. (2002) suggested that long counting times and special operating conditions are re-quired to obtain X-ray distribution maps for trace ele-ments below 1000 ppm. The maps can further be semi-quantified by electron microprobe spot analyses. Rusk et al. (2008) lowered the detection limits of
semi-quantitative maps of trace elements down to several tens of parts per million levels, but the amount of time spent for the mapping was ca. 90 h on the 500 × 500 pixel map size. The qualitative Al Kαand Fe KαX-ray maps of the colorful agate sample have reproduced the distribution patterns of trace elements similar to their quantitative maps (Fig. 5b, c, f, g), but the reproduction failed in other qualitative maps. Based upon the qualitative Al Kα X-ray map of the blue agate, the detection limits of qualitative mapping in the study were around 100–200 ppm (Fig. 6b, f ), and it took 15 h for a common electron microprobe equipped with four WDS to map the distribution of eight trace elements in the blue agate sample with 500 × 500 pixel resolution. The potential limitations of laser ab-lation imaging that have commonly been mentioned lie in (1) its destructive nature with respect to other microsam-pling methods (Woodhead et al. 2007) and (2) its rela-tively large beam size resulting in relarela-tively low spatial resolution (Ulrich et al. 2009). The ablated depth of agates has been minimized to ca. 5μm in the study by a series of parallel line scans. It is also noted that the presence and distribution of ~10-μm-long mineral inclusions were well
5000
Al
0
b
Fe
4000
0
c
Cu
400
0
d
Mn
3.0
0
e
Al
f
Fe
g
1 mm
a
Inner half Outer half
U. I.
identified in the quantitative maps (Fig. 5c, e) although their size is much smaller than the beam size of laser ablation.
Conclusions
The quantitative distribution maps of trace elements in two agate samples were acquired by a series of equally long line scan and a subsequent merging of line scans with Iolite software. These maps have particularly shown the fluctuations and concentrations of trace elements in the agate samples which cannot be visualized by conventional spot analysis. The colorful agate sample showed a vari-ation of trace elements from Fe-rich inner half to Mn-rich outer half. The quantitative maps of the blue agate sample showed a correlative distribution relationship between Al
and Ti, but an antithetic distribution relationship between Al and Fe. The distribution patterns resulted mainly from alternating microcrystalline quartz-rich and chalcedony bands. The detection limits of quantitative maps in the study were estimated as several parts per million levels with the RSD values of ca. 10 %, whereas those of X-ray qualitative maps as 100–200 ppm. These results clearly demonstrate that LA-ICP-MS can provide valuable data for interpretations of compositional variations in associ-ation with microstructures, chemical/physical phase boundaries, and geological and environmental heteroge-neous samples.
Competing interests
The authors declare that they have no competing interests. Al
400
0
b
Fe
100
0
c
a
Al
f
Ti
1.0
0
d
1 mmTi
Al
Fe
e
Fig. 6The optical image, quantitative maps, and qualitative X-ray maps of the blue agate sample.aPhotomicrograph of ablated area.
Authors’contributions
CSP and YK designed the experiment, and drafted the manuscript. Sample preparation and image processing were carried out by HC. Quantitative mapping was carried out by CSP and HSS, and qualitative mapping by KY. All the authors read and approved the final manuscript.
Acknowledgements
This work was supported by KBSI grant (T33612) to C.-S. Park. We thank anonymous reviewers for their constructive comments and suggestions.
Author details
1Division of Environmental & Material Sciences, Korea Basic Science Institute,
Cheongju 363-883, Republic of Korea.2Department of Earth and
Environmental Sciences, Chungbuk National University, Cheongju 362-763, Republic of Korea.
Received: 15 November 2015 Accepted: 6 December 2015
References
Barnaby RJ, Rimstidt JD. Redox conditions of calcite cementation interpreted from Mn and Fe contents of authigenic calcite. Geol Soc Am Bull. 1989;101: 795–804.
Durrant SF. Laser ablation inductively coupled plasma mass spectrometry: achievements, problems, prospects. J Anal At Spectrom. 1999;14:1385–403. Fairchild IJ, Smith CL, Baker A, Fuller L, Spötl C, Mattey D, et al. Modification and
preservation of environmental signals in speleothems. Earth Sci Rev. 2006;5: 105–53.
Götze J, Tichomirowa M, Fuchs H, Pilot J, Sharp ZD. Geochemistry of agates: a trace element and stable isotope study. Chem Geol. 2001;175:523–41. Götze J, Schrön W, Möckel R, Heide K. The role of fluids in the formation of
agates. Chemie der Erde. 2012;72:283–6.
Günther D, Hattendorf B. Solid sample analysis using laser ablation inductively coupled plasma mass spectrometry. Trends in Anal Chem. 2005;24:255–65. Günther D, Heinrich CA. Enhanced sensitivity in laser ablation-ICP mass
spectrometry using helium-argon mixtures as aerosol carrier—plenary lecture. J Anal At Spectrom. 1999;14:1363–8.
Günther D, Frischknecht R, Heinrich CA, Kahlert HJ. Capabilities of an argon fluoride 193 nm excimer laser for laser ablation inductively coupled plasma mass spectrometry microanalysis of geological materials. J Anal At Spectrom. 1997;12:939–44.
Günther D, Horn I, Hattendorf B. Recent trends and developments in laser ablation-ICP-mass spectrometry. Fresenius’J Anal Chem. 2000;368:4–14. Heaney PJ, Davis AM. Observation and origin of self-organized textures in agates.
Science. 1995;269:1562–5.
Heinrich CA, Pettke T, Halter WE, Aigner-Torres M, Audetat A, Günther D, et al. Quantitative milti-element analysis of minerals, fluid and melt inclusions by laser-ablation inductively-coupled-plasma mass-spectrometry. Geochim Cosmochim Acta. 2003;67:3473–96.
Hellstrom J, Paton C, Woodhead J, Hergt J. Iolite: software for spatially resolved LA-(quadrupole and MC)-ICP-MS analysis. In: Sylvester P, editor. Laser ablation ICP–MS in the earth sciences: current practices and outstanding issues. Short course series. vol 40. Ottawa: Mineralogical Association of Canada; 2008. p. 343–8.
Hinton RW. Ion microprobe trace element analysis of silicates: measurement of multi element glasses. Chem Geol. 1990;83:11–25.
Jackson SE, Longerich HP, Dunning GR, Fryer BJ. The application of laser-ablation microprobe-inductively coupled plasma-mass-spectrometry (LAM-ICP-MS) to in situ trace-element determinations in minerals. Can Mineral. 1992;30:1049–64. Jeffries TE, Jackson SE, Longerich HP. Application of a frequency quintupled Nd:
YAG source (lambda_213 nm) for laser ablation inductively coupled plasma mass spectrometric analysis of minerals. J Anal At Spectrom. 1998;13:935–40. Koenig AE, Rogers RR, Trueman CN. Visualizing fossilization using laser
ablation-inductively coupled plasma-mass spectrometry maps of trace elements in Late Cretaceous bones. Geology. 2009;37:511–4.
Large R, Danyushevsky L, Hollit C, Maslennikov V, Meffre S, Gilbert S, et al. Gold and trace element zonation in pyrite using a laser imaging technique: implications for the timing of gold in orogenic and Carlin-style sediment-hosted deposits. Econ Geol. 2009;104:635–68.
Möckel R, Götze J, Sergeev SA, Kapitonov IN, Adamskaya EV, Goltsin NA, et al. Trace-element analysis by laser ablation inductively coupled plasma mass
spectrometry (LA-ICP-MS): a case study for agates from Nowy Kościoł, Poland. J Siberian Federal Univ Eng Tec. 2009;2:123–38.
Moggi-Cecchi V, Cipriani C, Rossi P, Ceccato D, Rudello V, Somacal H. Trace element contents and distribution maps of chalcopyrite: a micro-PIXE study. Per Mineral. 2002;71:101–9.
Montagna P, McCulloch M, Mazzoli C, Silenzia S, Odorico R. The non-tropical coral Cladocora caespitosa as the new climate archive for the Mediterranean: high-resolution (weekly) trace element systematics. Quart Sci Rev. 2007;26: 441–62.
Müller A, Wiedenbeck M, Van den Kerkhof AM, Kronz A, Simon K. Trace elements in quartz: a combined electron microprobe, secondary ion mass
spectrometry, laser-ablation ICP-MS, and cathodoluminescence study. Eur J Mineral. 2003;15:747–63.
Niemax K. Laser ablation—reflections on a very complex technique for solid sampling. Fresn J Anal Chem. 2001;370:332–40.
Norman MD, Pearson NJ, Sharma A, Griffin WL. Quantitative analysis of trace elements in geological materials by laser ablation ICP-MS: instrumental operating conditions and calibration values of NIST glasses. Geostd Newsl. 1996;20:247–61.
Paton C, Hellstrom J, Paul B, Woodhead J, Hergt J. Iolite: freeware for the visualisation and processing of mass spectrometric data. J Anal At Spectrom. 2011;22:112–21.
Polk P. Collecting rocks, gems and minerals: identification, values and lapidary uses. Fort Collins: Krause Publications; 2012.
Rusk B, Lowers H, Reed M. Trace elements in hydrothermal quartz: relationships to cathodoluminescent textures and insights into hydrothermal processes. Geology. 2008;36:547–50.
Rusk B, Koenig A, Lowers H. Visualizing trace element distribution in quartz using cathodoluminescence, electron microprobe, and laser ablation-inductively coupled plasma-mass spectrometry. Am Mineral. 2011;96:703–8. Sylvester P. Laser-ablation-ICP MS in the earth sciences—principles and
applications. Ottawa: Mineralogical Association of Canada; 2001. Treble P, Shelley JMG, Chappell J. Comparison of high resolution sub-annual
records of trace elements in a modern (1911–1992) speleothem with instrumental climate data from southwest Australia. Earth Planet Sci Lett. 2003;216:141–53.
Ulrich T, Kamber BS, Jugo PJ, Tinkham DK. Imaging element-distribution patterns in minerals by laser ablation-inductively coupled plasma-mass spectrometry (LA-ICP-MS). Can Mineral. 2009;47:1001–12.
Woodhead JD, Hellstrom J, Hergt JM, Greig A, Maas R. Isotopic and elemental imaging of geological materials by laser ablation inductively coupled plasma-mass spectrometry. Geostd Geoanal Res. 2007;31:313–43.
Submit your manuscript to a
journal and benefi t from:
7Convenient online submission
7Rigorous peer review
7Immediate publication on acceptance
7Open access: articles freely available online
7High visibility within the fi eld
7Retaining the copyright to your article