R E S E A R C H A R T I C L E
Open Access
Physicochemical study of extractants for
extraction of rare earth element
R. Giri and G. Nath
*Abstract
Background:In nuclear technology, the solvent extraction is an important step for recovery of rare earth materials, purification, radionuclide production, and preparation of nuclear reactor materials. Tributyl phosphate (TBP) and toluene are taken as extractant and diluent, respectively, for study of extraction efficiency for rare earth element like CeO2. Methods:In the present paper, idea of ultrasonic sound theory is intensively applied to study the physicochemical property of extractants and diluent pair.
Results:The experimental value of ultrasonic velocity, measured density, molar volume, and viscosity are used for computation of acoustical parameters and their excess values. The variations of physical and acoustical parameter are discussed in terms of molecular interactions. The prepared samples are treated for extraction of CeO2by separating the
organo-aqueous phase. The recovery of this reactor material with the help of this ultrasonic technique has been explained in terms of nature and extent of intermolecular interactions present in the binary mixture.
Conclusions:The ultrasonic treatment for the recovery of this material provides an optimum value of the binary mixture for recovery of CeO2.
Keywords:Solvent extraction, Rare earth element (REE), TBP, Ultrasonic velocity, Acoustic parameter
Background
The reprocessing of spent nuclear fuels is one of the key processes in the nuclear fuel cycle. As the conventional method suffers from many drawbacks in reprocessing of
nuclear fuel from the view point of cost and
minimization of waste, the development of a new process involving cost-effectiveness coupled with minim-izing waste amount is a great challenge for the next gen-eration reprocessing. Liquid-liquid extraction was one of the most promising methods of separating REE’s mater-ial. The repeated use of different organic solvents for this process results in severe corrosion to the equip-ment, and usage of lots of volatile organic solvents may lead to severe environmental pollution. The real pictur-isation of the role of extractant-diluent pair (EDP) is not still well defined in spite of work by many workers in this field (Laxmi et al. 2015; Thirumaran and Jayakumar 2009; Liu et al. 2016; Mahapatra et al. 2014; Mastumiya et al. 2014; Bhatanagar et al. 2010; Joshi et al. 2010; Patel and Parsania 2010; Palani and Kalavathy 2011; Sakthipandi et al. 2012; Srivastava et al. 2014; Aswar and
Chudhary 2014; Giri and Nath 2015). Thus, an optimal concentration or range of concentration of extractants with particular diluents is a serious concern in the solvent extraction or purex process. Thus, the aim of the present investigation is to make an attempt to find an optimum concentration of EDP used for extraction process. The accurate concentration of EDP and their variation with different physical factors can be well studied by the propa-gation of ultrasonic wave in the concerned medium.
To understand the basic process with the help of some fundamental parameter with easier way, another method called ultrasonic irradiation is more effective and effi-cient in this regard. The high frequency and short wave-length of ultrasonic wave makes it possible to interact with the atoms and materials of the concerned medium without any destruction of the medium or individual property of component. Tributyl phosphate (TBP) has been extensively used as a solvent in nuclear industry for fuel reprocessing due to its excellent chemical resist-ance and physical properties which results in better sep-aration than other solvents. The extracting power of TBP is mainly due to presence of phosphoryl group which form solvates with the metal ions. The diluent-like toluene improves the physical properties of TBP by * Correspondence:[email protected]
Veer Surendra Sai University of Technology, Burla Sambalpur, Odisha 768018, India
lowering its density and viscosity for better phase separ-ation. Hence, it is important to study various physical properties of TBP in presence of diluent. In applications of liquid-liquid extraction processes for recycling of used nuclear fuel, the aqueous phase co-exists with an organic extracting phase which consists of a mixture of an extracting agent and a diluent. Cerium is a member of the lanthanide series of metals and is the most abundant of the rare earth elements in the earth’s crust. When present in compounds, cerium exists in both the triva-lent (Ce3+) and the tetravalent (Ce4+) state. Cerium is found in nature along with other lanthanide elements in the minerals like alanite, bastnasite, monazite, cerite, and samarskite; however, only bastnasite and monazite are important sources commercially. Because of its unique stability in the tetravalent state, cerium can be separated out from the other rare earth elements through oxidation (forming CeO2) followed by variable solubility filtration.
Methods
Materials and instruments
High purity and analytical grade samples of TBP (AR > 98 %), toluene (AR > 99 %), HNO3 (AR > 15.5 mol/L),
and CeO2 (AR > 99 %) procured from CDH chemicals
were used as received. The binary mixture were pre-pared on percentage basis (w/w) by mixing known mass of toluene in appropriate masses of TBP and measuring their masses with the help of a high-precision electronic
balance of (WENSAR, PGB 100, with accuracy
±0.001 g). The densities of all mixture as well as pure li-quid were measured by a specific gravity bottle cali-brated with deionized double-distilled water of density 0.9960 × 10³kg/m3at 303.15 K. The precision of density measurement was within ± 0.0001 kg/m3. The ultrasonic velocity in the mixtures as well as in the component liq-uids were measured at 303.15 K (calibrated up to ±0.01 m/s) by a single-crystal variable-path multifre-quency ultrasonic interferometer operating at different frequencies 1–4 MHz (Mittal Enterprises, New Delhi, Model-M-81S). The temperature of the mixture was maintained constant within ±0.01 K by circulation of
water from thermostatically regulated constant
temperature water bath (B-206) through the water-jacketed cell. Viscosities of the mixtures were measured by Redwood apparatus (MAC, #RWV-5271 was precise up to ±0.0001 Nsm−2).
Experimental procedure
Different concentrations of extractant were prepared by dissolving various amounts of TBP in toluene. All sam-ples were stored in ground-glass stopper bottles to pre-vent the evaporation. The concentrations of extractant were studied and optimized by ultrasonic method in terms of existence of different intermolecular interaction
explaining the various acoustic parameters with their de-viated values. The ultrasonic velocity of the pure liquids and their freshly prepared mixtures of (TBP-toluene) were measured using multifrequency ultrasonic interfer-ometer operating at different frequencies (1–4 MHz). The working principle used in the measurement of vel-ocity of sound through medium was based on the accur-ate determination of the wavelength of ultrasonic waves of known frequency produced by quartz crystal in the measuring cell. The temperature of the solution was controlled by circulating water at a desired temperature through the jacket of a double-walled cell.
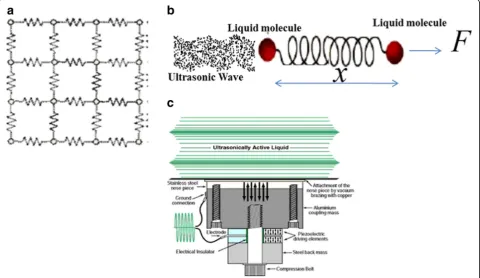
For extraction, equal volumes of two phases, organic and aqueous phases, were equilibrated in a separatory funnel by using magnetic stirrer at 200 rpm for 10 min as shown in Fig. 1. Organic phase was equilibrated by adding TBP with toluene of different mole fractions, and aqueous phase was created by adding cerium oxide in diluted nitric acid using 25-mL flask. After this, the ne-cessary volumes of both aqueous and organic phases were put into a separatory funnel, which was dipped in ultrasonic bath for phase settle. After the phase settle, the extract was filtered through a 0.45-μm nylon mem-brane (Guangfu Chemical Reagents Co., Tianjin, China) prior to the analysis. Mass balance analysis was per-formed to verify the measured distribution ratios by comparing the theory of chemical equilibrium as per Nernst distribution law:
KD¼
X
½ org
X
½ aqu ð
1Þ
where the brackets denote the concentration of “X” in each phase at constant temperature (or the activity of
“X” for nonideal solutions). By convention, the concen-tration extracted into organic and aqueous phase ap-pears in the numerator and denominator of equation and the resulting value of KD is large, indicating a high degree of extraction from aqueous phase into organic phase. Conversely, if KD is small, less chemical X is transferred from aqueous phase into organic phase. If
KDis equal to 1, equivalent concentrations exist in each phase.
Theory
The propagation of sound wave through a medium is due to the vibrations or oscillatory motions of particles within a medium (Fig. 2). An ultrasonic wave may be vi-sualized as an infinite number of oscillating masses or particles connected by means of elastic springs. Each in-dividual particle is influenced by the motion of its near-est neighbor and both inertial and elastic rnear-estoring forces act upon each particle.
Thus, the force acting on the atoms of the medium as per Hook’s law is given as
Fα−x
F¼−Kx ð2Þ
where K is a constant depending on the nature of the medium on which the wave propagates and the
intermolecular interaction. As the liquid medium is elas-tic, the wave equation is given by
∂2ψ
∂x2 ¼ 1
C2
∂2ψ
∂t2 ð3Þ
where“C”is the velocity of the wave or ultrasonic wave propagating though the medium. The experimental mea-sured values of ultrasonic velocity, density, and viscosity
Fig. 1Schematic diagram for extraction procedure of Ce form CeO2
are used to compute different acoustic parameters such as isentropic compressibility (βS), intermolecular free length (Lf), acoustic impedance (Z), molar volume, and surface tension and their excess values which are well describing the physicochemical properties of the medium. The acoustic parameters have been evaluated with the help of the following relationship (Pal and kumar 2011; Ali et al. 2004; Pradhan et al. 2012; Nadh et al.2013).
Isentropic compressibility:βS¼ 1
ρC2 ð4Þ
Intermolecular free length:Lf ¼kβ1=2 ð5Þ
Acoustic impedance:Z¼ρC ð6Þ
Molar volume:Vm¼Mρ ð7Þ
Surface tension:σ¼6:410−3ρC32 ð8Þ
and their excess values are calculated as
YE¼Y
mix−ðXAYAþXBYBÞ ð9Þ
whereXAandXBare the mole fractions,YA,YB, andYmix represent the isentropic compressibility, intermolecular free length, acoustic impedance, molar volume, and sur-face tension of toluene, TBP, and mixture, respectively. The constantkis temperature dependent which is given as [93.875 + (0.375T)] × 10−8 (Ali et al. 1996; Dey et al.
2015),Tbeing the absolute temperature.
Results and discussion
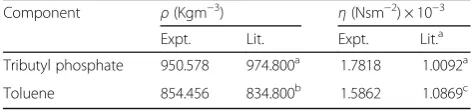
The density (ρ) and viscosity (η) values of pure liquids are reported in Table 1 (Liu et al. 2016; Gangwar et al. 2013; Moumouzias and Ritzoulis 1992). Experimental values of density (ρ) and viscosity (η) have been reported in Table 2. The values of ultrasonic velocity (C) and computed values of excess acoustic impedance (ZE), de-viated values of isentropic compressibility (Δβs), excess intermolecular free length (LfE), excess surface tension (σE), excess molar volume (VmE), and excess viscosity (ηE) at temperature 303 K are presented in Tables 3 and 4, respectively. The distribution coefficient or percentage
of extraction for each concentration of EDP has been re-ported in Table 5. A close perusal of the data for density and viscosity presented in Table 2 indicates that with in-crease of concentration of TBP, density of the solvent mixture increases linearly.
Density is a measure of solvent-solvent and solute-solvent interaction. For the system of TBP and toluene under study, there is an increase in density at low-concentration region for nonpolar solvents like toluene (Fig. 3). Increase in density with concentration is due to the shrinkage in the volume of the mixture. In other words, the increase in density may be interpreted to the structure-maker of the solvent due to the added polar solvent. In the case of TBP/toluene mixture, there is a continuous increase in the density of the solution with an increase in concentration of TBP. This is attributed to the presence of strong intermolecular attraction such as dipole-dipole and dipole-induced dipole interaction (Ali et al. 1996; Ali and Nain 1996). Again, an increase in concentration of TBP allows for a closer approach of TBP molecules. As the polarity of the solvent increases, there is increase in density. The initial sharp increase in density can be explained on the basis of a sudden de-crease in the volume of the solution with the addition of TBP.
Viscosity is the ease with which the solution flows. The viscosity values are seen to follow a decreasing trend with the increase in the mole fraction of TBP in up to mole fraction 0.4 and then exhibit a steady in-crease with inin-crease in concentration of TBP (Fig. 4). This kind of behavior may be due to some agglomer-ation of complex formagglomer-ation occurring in the earlier stages, thereby causing a rise in the viscosity, which sub-sequently diminishes with increasing TBP concentration. As the viscosity of TBP is greater than that of toluene, its presence affects the viscosity of the mixture. The weak hydrogen bonding between the
phosphorous-Table 1Experimental density (ρ) and viscosity (η) values for pure liquids with literature values
Component ρ(Kgm−3) η(Nsm−2) × 10−3
Expt. Lit. Expt. Lit.a
Tributyl phosphate 950.578 974.800a 1.7818 1.0092a
Toluene 854.456 834.800b 1.5862 1.0869c
a
Ref. (Ali and Nain1996) at 303.15 K
b
Ref. (Habashi1993) at 308 K
c
Ref. (Joshi et al.2010) at 288.15 K
Table 2Experimental values of density (ρ),viscosity (η), and molar volume at temperature 303.15 K
Mole fraction of TBP Density (Kgm−3) Viscosity (Nsm−2) × 10−3
0.0000 854.456 1.586227
0.0712 869.182 1.571293
0.1692 885.827 1.547224
0.257 898.025 1.538582
0.4356 916.129 1.572145
0.5052 922.023 1.684754
0.582 927.896 1.712247
0.7059 935.953 1.734918
0.7781 940.066 1.746461
0.8712 945.001 1.764821
1.0000 950.578 1.78184
Table 3Ultrasonic velocity (C),excess acoustic impedance (ZE), excess isentropic compressibility (Δβs) of pure tributyl phosphate (TBP), toluene, and binary mixture of TBP and
toluene at different mole fraction with different frequencies (1–4 MHz) for temperature 303.15 K
Mole fraction of TBP C (m/s) ZE(Kgm−2s) Δβs(N−1m−2)
X1 1 MHz 2 MHz 3 MHz 4 MHz 1 MHz 2 MHz 3 MHz 4 MHz 1 MHz 2 MHz 3 MHz 4 MHz
0.0000 1277 1276 1275 1274 0 0 0 0 0 0 0 0
0.0712 1273 1272 1269 1266 8822.209136 9017.370483 7338.805523 5727.921717 −24.0977223 −23.5064086 −29.1325544 −34.5556821
0.1692 1270 1267 1264 1263 18,398.69858 17,094.45081 15,468.52745 15,775.09589 −40.2538249 −44.5948991 −49.8040229 −48.8577351
0.2570 1266 1263 1262 1260 22,275.00696 21,192.98695 21,418.41985 20,990.12630 −51.6533634 −55.1956038 −54.4491710 −55.8436206
0.4356 1263 1260 1257 1254 26,126.04457 25,516.19964 24,078.21116 23,054.29446 −45.1060738 −47.1285120 −51.4146950 −54.5538893
0.5052 1260 1257 1254 1252 24,444.13866 24,021.78251 22,638.96235 22,658.39719 −44.9226509 −46.3532079 −50.4121021 −50.4289483
0.5820 1257 1254 1251 1248 22,042.54496 21,828.96515 20,508.91255 19,742.09635 −42.4159704 −43.2020031 −47.0186650 −49.3089136
0.7059 1254 1250 1247 1244 18,040.51155 17,232.04710 16,017.50963 15,473.98517 −30.3684272 −32.8126061 −36.2578405 −37.8555057
0.7781 1252 1248 1245 1242 14,720.53797 14,108.45672 12,957.15199 12,545.49200 −22.7984274 −24.6398124 −27.8763920 −29.0782435
0.8712 1247 1244 1241 1238 7666.794,136 8254.419,283 7185.757,323 6945.238,917 −18.6133,625 −17.0301590 −19.9923,546 −20.6784,768
1.0000 1244 1240 1238 1235 0 0 0 0 0 0 0 0
Journal
of
Analytical
Science
and
Technolog
y
(2016) 7:21
Page
5
of
oxygen (P=O) oxygen of TBP and the methyl group of toluene increase the resistance to flow, and thus, the vis-cosity increases (Tuck 1961).
The ultrasonic velocity decreases linearly with increas-ing concentration of TBP which is governed by the effect of density. The main cause of such variation is due to fact that there is large difference in density of toluene and TBP. The mixing of nonpolar solvent with polar solvent causes the energy change due to dipole-dipole interaction between the polar head groups of TBP mole-cules (Shieh and Fendler 1977; Goldman and Care 1971). Further, with increase of frequency, the ultrasonic velocity decreases. This may be attributed to the fact that, due to high oscillation of the solvent molecules causing the dispersion of energy (Nath et al. 2009a, 2009b; Nath and Paikaray 2009), TBP contains P=O functional group which is polar, and hence, it can
interact with nonpolar molecules like toluene through polar-induced dipolar interaction. In pure TBP, there is dipole-dipole as well as the dispersive interaction. The effect of adding nonpolar second component is primarily to disrupt the dipolar interaction of the first component. For polar solvents, there is a decrease in velocity by in-creasing the concentration due to strong intermolecular interactions (Fig. 5).
The deviation in the physical property from its ideal be-havior is a measure of the degree of interaction between component molecules of the solvent mixture (Pradhan et al. 2012). The variation in excess viscosity gives a quan-titative estimation of the strength of intermolecular inter-actions, and these values can be explained by considering two factors. One is the difference in size and shape of the component molecules and the loss of dipolar association in pure compound that may lead to a decrease in viscosity.
Table 4Excess intermolecular free length (Lf E
), excess surface tension (σE), excess molar volume (VEm) and excess of pure tributyl phosphate (TBP), toluene, and binary mixture of TBP and toluene at different mole fractions with different frequencies (1–4 MHz) for temperature 303.15 K
Mole fraction of TBP
Lf E
(m) × 10−7 σE(Nm−1) VEm(m
3
mol−1) × 10−7 ηE(Nsm−2) × 10−3
X1 1 MHz 2 MHz 3 MHz 4 MHz 1MHZ 2 MHz 3 MHz 4 MHz
0.0000 0 0 0 0 0 0 0 0 0 0
0.0712 −5.5956 −5.4484 −6.8047 −8.1131 1917.2819 1914.73468 1317.45752 721.1185634 1.71085 −0.19532
0.1692 −9.3571 −0.1040 −0.1167 −0.1144 4205.7083 3594.97437 2985.18984 2980.563116 2.92216 −1.01283
0.2570 −0.1207 −0.1293 −0.1275 −0.1309 5041.4163 4422.12243 4416.07006 4103.943175 3.26293 −1.40152
0.4356 −0.1047 −0.1095 −0.1202 −0.1280 6332.9984 5701.36007 5070.70978 4441.054575 4.91720 −1.56675
0.5052 −0.1047 −0.1081 −0.1182 −0.1182 5918.0402 5283.47561 4649.90730 4330.474264 4.73284 −1.40087
0.5820 −9.9252 −0.1010 −0.1106 −0.1164 5365.6501 4728.40132 4092.15698 3456.922601 4.18167 −1.29212
0.7059 −7.0718 −7.6757 −8.5515 −8.9522 4634.7341 3676.19462 3036.78807 2398.401336 3.28712 −1.13512
0.7781 −5.2872 −5.7421 −6.5675 −6.8693 3956.2692 2995.21656 2354.44540 1714.698945 2.58474 −1.01863
0.8712 −4.4291 −4.0174 −4.7783 −4.9529 2193.7445 1551.11883 909.521706 268.9558308 1.09628 −0.28534
1.0000 0 0 0 0 0 0 0 0 0 0
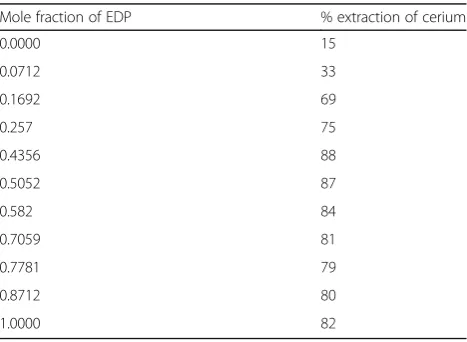
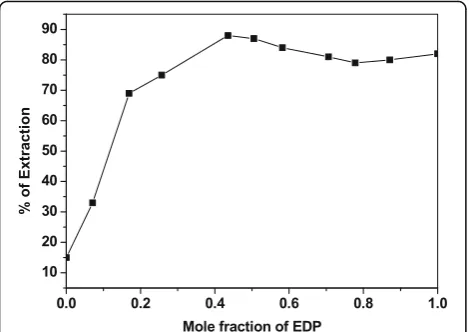
Table 5Percent extraction of cerium from CeO2with concentration of extractant diluent pair
Mole fraction of EDP % extraction of cerium
0.0000 15
0.0712 33
0.1692 69
0.257 75
0.4356 88
0.5052 87
0.582 84
0.7059 81
0.7781 79
0.8712 80
1.0000 82 Fig. 3Variation of density with different mole fractions of TBP
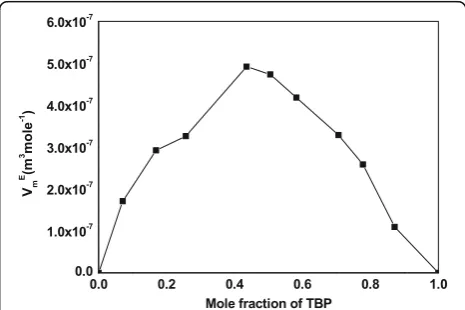
The other factor is the specific interactions between unlike components such as hydrogen bond formation and charge transfer complexes which may cause increase in viscosity in mixtures over that found in pure components. The former effect produces negative deviation in excess viscos-ity whereas the latter effect produces positive deviation in excess viscosity. Based on this theory (Fort and Moore 1965), the observed negative values of excess viscosity may be due to smaller size of toluene as compared to that of TBP molecules (Fig. 6). However, from Fig. 7, it is ob-served that the excess molar volumes, VmE, is positive which can be explained by the predominance of expansion in volume, caused by the loss of dipolar association and difference in size and shape of component molecules, over contraction in volumes, due to the dipole-dipole and dipole-induced dipole interactions (Petek and Dolecek 1998). In our study,ΔβsandLfEnegative (Figs. 8 and 9) in-dicates that the solvent mixture is less compressible than the pure liquids forming the complex and molecules are more tightly bound than in pure liquids. This indicates the presence of relatively stronger molecular interaction,
possible through hydrogen bonding (Ali and Nabi 2010; Nabi et al. 2013) between the component molecules. Mix-ing of TBP with toluene will induce the breakMix-ing up of the associated clusters of TBP releasing several dipoles which in turn can induce a dipole moment in toluene molecules, resulting dipole-induced dipole interactions. Thus, toluene acts as a structure breaker of TBP.
With the increase in frequency, the interaction be-comes weak and the breaking of associated structure of TBP dominates, resulting in increase of Δβs (Nath and Paikaray 2009). The negative values ofLfE are attributed to close packaging of the component molecule which decreases up to 0.3 mol fraction of TBP and then in-crease negatively attributing to loose packing of the component molecules which in fact supports the hetero-molecular association between the TBP and toluene. This results the decrease in free length between the component molecules indicates that the system is more resistant to the sound propagation. The positive excess acoustic impedance (ZE) value indicates that over the concentration range of 0.4–0.5 mol% for TBP, significant Fig. 4Variation of viscosity with different mole fractions of TBP
Fig. 5Variation of ultrasonic velocity with TBP
Fig. 6Variation of excess viscosity with TBP
interaction between the molecules of solvent is present as shown in Fig. 10. This is attributed due to interaction between component molecules and formation of closer molecular aggregates which leads to decrease in the intermolecular free space. This behavior is supposed to be caused by structural arrangement of phosphoryl group of TBP and CH3 group of toluene. Similarly, the
excess surface tension is also positive throughout the system. The positive excess value indicates that the in-crease in molar volume indicates strong interaction between the component molecules. The maximum devi-ation is seen at 0.4 mol fraction of TBP (Fig. 11). The positive excess surface tension σE of mixture is due to the adsorption of TBP at the interface of the toluene and TBP. The lone pair of electrons on oxygen atom of the phosphate bond is responsible for this adsorption (Schulz and Navratil 1984).
The intense discussion of physicochemical parameters of extractants and diluent makes it suitable for their com-patibility up to a particular concentration (0.4 mol%) as confirms from the variation of each physicochemical par-ameter. Again, TBP is a polar liquid having dipole
moment μ= 2.92D and dielectric constant ε= 8.29. As TBP is known to be a mildly associated polar liquid having liner correlation factor (g> 1) (Bottcher 1973), it can re-main in head tail arrangement with α-multimerization. With addition of nonpolar liquid like toluene, breaking of α-multimers takes place which facilitates the extraction processes. For the extraction process, each concentration of TBP/toluene was treated with CeO2 in addition of
HNO3 and the distribution coefficient recorded as per
Nernst distribution law and tabulated in Table 5. The ex-traction of cerium increased steadily with an increase in TBP concentration up to 0.4 mol fraction and then plat-eaued as shown in Fig. 12. Though diluent is unable to ex-tract metal ion from the aqueous phase, they greatly affect the extraction behavior of extractant (Habashi 1993).
Conclusions
The ultrasonic study of TBP and toluene is a nonde-structive investigation used for probing the nature of the acoustical and molecular interaction in solvent mixture. The acoustic data of ultrasonic velocity, Fig. 8Variation of deviated isentropic compressibility with TBP
Fig. 9Variation of excess intermolecular free length with TBP
Fig. 10Variation of excess acoustic impedance with TBP
Fig. 11Variation of excess surface tension for different mole fractions of TBP
density, viscosity, molar volume, and acoustic parame-ters with their excess values of TBP with toluene over the different concentration range suggest the exist-ence of a strong molecular interaction like dipole-induced dipole, dipole-dipole, and hydrogen bonding type. The frequency of the ultrasonic wave also influ-ences the intermolecular interaction as all the param-eters are based on the computation of ultrasonic velocity. The change of deviated and excess physico-chemical parameter from certain concentration hints the presence of compatibility of the solvent mixture. Again, the extraction of cerium for each concentra-tion of TBP and toluene indicates the maximum effi-ciency of the TBP and toluene is the same as demonstrated by each physicochemical parameter. The nature of interaction present in the TBP and toluene mixture provides an optimized value for the extraction process. As such, toluene with TBP may be used as effective diluents/modifiers in the extraction of cerium from cerium oxide material.
Acknowledgements
The authors are thankful to Hon’ble Vice chancellor and Dean (PGS & R) for providing the financial support and laboratory facilities to carry out the research work.
Authors’contributions
RG carried out preparation of sample for the experimental work, measured and computed different experimental datas under the guidance of GN also participate in the sequene alignment, scientific analysis and discussion of the different results. All authors read and approved the final manuscript.
Competing interests
The author declare that they have no competing interests.
Received: 22 March 2016 Accepted: 21 September 2016
References
Ali A, Nabi F. J Disp Sci Tech. 2010;31:1326. Ali A, Nain AK. Acoust Lett. 1996;19:181.
Ali A, Nain AK, Kamil M. Thermochim Acta. 1996;274:209. Ali A, Abida, Hyder S. Phys Chem Liq. 2004;42:411.
Aswar AS, Chudhary DS. J Pure Appl Ultrason. 2014;36:46–50.
Bhatanagar D, Joshi D, Kumar A, Jain CL. Ind J Pure Appl Phys. 2010;48:31. Bottcher CJF. Theory of electric polarization. Msterdam: Elsevier; 1973. p. 1. Dey R, Raghuvanshi KS, Saini A, Harshavardhan A. Int J Sci Res. 2015;251–257.
http://www.ijsr.net/conf/ISU-2015/ISU-055.pdf. Fort RJ, Moore WR. Trans Faraday Soc. 1965;61:2102.
Gangwar MK, Saxena AK, Agarwal R. Adv Appl Sci Res. 2013;4(2):29. Giri R, Nath G. J Pure Appl Ultrason. 2015;37:44–7.
Goldman S, Care GCB. Can J Chem. 1971;49:1716.
Habashi F. A text book of hydrometallurgy. Metallurgie extractive Quebec, Enr. 1993. Joshi D, Kumar A, Ponia TP, Kumar B, Bhatanagar D. J Pure Appl Ultrason. 2010;
32:22–31.
Laxmi BJ, Satyanarayana GR, GouriSankar M, Ramachandran D, Rambabu C. Chem Sci Trans. 2015;4(1):17.
Liu C, Cao J, Shen W, Ren Y, Mu W, Ding X. Fluid Phase Equilib. 2016;408:190. Mahapatra PK, Rout DR, Sengupta R. Sep Purif Technol. 2014;133:69.
Matsumiya M, Kikuchi Y, Yamada T, Kawakami S. Sep Purif Technol. 2014;130:91. Moumouzias G, Ritzoulis G. J Chem Eng Data. 1992;37(4):482.
Nabi F, Jesudason CG, Malik MA, Al-Thabaiti SA. Chem Eng Commun. 2013;200:77. Nadh ML, Mohan TM, Krishna TV, Kumar CRS. Ind J Pure Appl Phys. 2013;51:406. Nath G, Paikaray R. Ind J Phys. 2009;9:763.
Nath G, Sahu S, Paikaray R. Ind J Phys. 2009a;4:429. Nath G, Sahu S, Paikaray R. Ind J Phys. 2009b;11:1567. Pal A, Kumar B. J Mol Liq. 2011;163:128.
Palani R, Kalavathy S. J Pure Appl Ultrason. 2011;33:21–5. Patel JP, Parsania PH. J Pure Appl Ultrason. 2010;32:84–7. Petek A, Dolecek V. Acta Chim Slov. 1998;45:153.
Pradhan SK, Das SK, Moharana L, Swain BB. Ind J Pure Appl Phys. 2012;50:161. Sakthipandi K, Rajendran V, Jayakumar T. J Pure Appl Ultrason. 2012;34:69–71. Schulz WW, Navratil JD. Science and technology of tributyl phosphate, CRC press. 1984. Shieh PS, Fendler JH. J Chem Soc Farad. 1977;173:1480.
Srivastava R, Pandey A, Gupta RK, Gupta A. J Pure Appl Ultrason. 2014;36:36–45. Thirumaran S, Jayakumar JE. Ind J Pure Appl Phys. 2009;47:265.
Tuck DG. Trans Faraday Soc. 1961;57:1297.
Submit your manuscript to a
journal and benefi t from:
7 Convenient online submission
7 Rigorous peer review
7 Immediate publication on acceptance
7 Open access: articles freely available online
7 High visibility within the fi eld
7 Retaining the copyright to your article