Vol. 3, Issue 7 (July. 2013), ||V4 || PP 27-35
Study of Cyclic Constrained Groove Pressing Factors on
Hardness Behavior of Al/Sic - MMC Subjected to Severe Plastic
Deformation
H.S.Siddesha
1, M.Shantharaja
21
ACS College of Engineering, Department of Mechanical Engineering, Bangalore-560074.India
2
UVCE, Dept. of Mechanical Engineering, K.R. Circle, Bangalore University Bangalore-560001.India
Abstract: - Cyclic constrained groove pressing (CCGP) are widely used for the production of an ultra finegrained, Nano/sub microcrystalline structure in industries to compensate the high strength metal plates components used in automobiles. The present paper focus on The mechanical properties in nanostructure Al/Sic composite plate processed by a new technique, cyclic constrained groove pressing (CCGP), were studied using micro hardness tester. Taguchi technique and the analysis of variance (ANOVA) techniques were carried out to investigate the degree of importance of CCGP process parameters i.e. Percentage of Sic, strain rate, number of passes, plate thickness and heat treatment for four different levels. The results indicated that the percentage of Sic factor has a major influence on the hardness of the composite plate, followed by no. of passes, Heat treatment, plate thickness and strain rate. The Taguchi method and the ANOVA technique was an effective tool to predict the degree of importance of the CCGP parameters on micro hardness CGP specimens.
Key words: - Severe plastic deformation, CCGP, Al/SiC composites, Taguchi method, Micro hardness.
I. INTRODUCTION
The process of severe plastic deformation (SPD) is gaining great interest in material science because it is useful to refine microstructures to the sub micrometer or nanometer levels [1]. In Al/Sic composites,it is generally difficult to reduce the grain size below 10µm through the conventional recrystallization process following thermo-mechanical treatments. This difficult arises from the inherent nature of Al/Sic composites that the staking fault energy is relatively large so that it is easy for the recovery of dislocation to occur [2]. One of these advantages is a capability of producing large samples that are free from any residual porosity and readily amenable to mechanical testing and forming operations[3]. Among the various SPD techniques proposed most of the methods are intended for processing bulk materials; very few methods like accumulative[4,5],repetitive corrugation and straightening(RCS)[8,9]and cyclic constrained groove pressing(CCGP) [6,7] are capable of processing sheet materials. CCGP process was invented recently and it is promising method for producing fine grain sheet material for structural applications. In the CCGP process, a work-piece is repetitively bent and straightened without significantly changing the cross-section geometry of the work-piece, during which large plastic strains are imparted into the materials, which leads to the refinement of microstructure. Although many researchers worked on CCGP[10] but none of them study thoroughly on Metal matrix composite material under severe plastic deformation and CCGP process. In this present study the mechanical behavior were predicted through statistical analysis of the measured micro hardness at different conditions and find the effects of % of reinforcement, number of passes, strain rate, thickness of the plate and Heat treatment on properties of CCGP by using Taguchi L16 orthogonal array. The analysis of variance was employed to find the percentage of influence of various
factors and its interaction on the physical behavior of CGP specimens.
II. EXPERIMENTAL STUDIES
were then cast in permanent moulds of dimension 20 mm width, 100 mm length and 10 mm thickness. Al alloy composites containing various SiC contents, namely 5%, 10%, 15% and 20% by weight were fabricated and tested and their properties were compared with those of the unreinforced matrix.From the as prepared composites plates the samples were cut with a width of 20 mm and length 100 mm. The samples are taken in 4 different thicknesses, i.e., 3mm, 4mm, 5mm and 6mm having same length and width after machining. The Al alloy MMCs plates with above dimensions were pressed in a corrugated and flat die to produce ultra fine grain structures. These specimens were compressed using four different strain rates i.e. 0.5 mm, 1 mm/min, 1.5 mm/min and 2 mm/min and one to seven passes of compression were considered. The Vickers hardness (Hv) of the test specimens were calculated using Micromet-5101 device, with a load of 200g and loading period of 20 seconds. For obtaining reliable results, the measurements of the hardness was performed on all the specimens in three different locations and one among the two nearer value was considered as final hardness value.
III. PLAN OF EXPERIMENTS
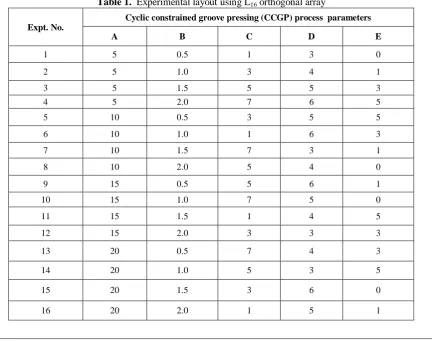
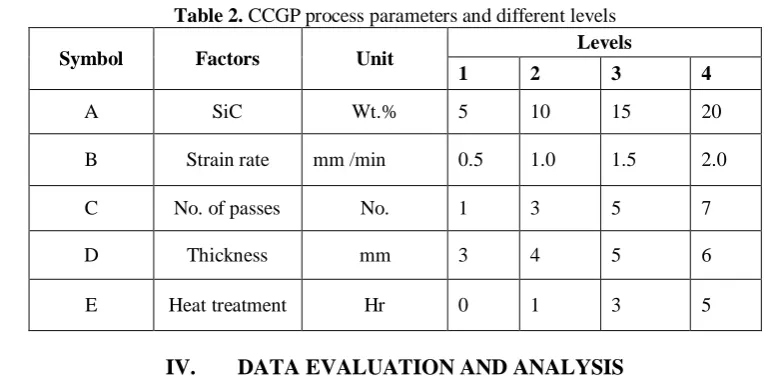
Taguchi method is an efficient tool which enables the up gradation of the performance of the product, process, and design with significant prediction of cost and time. It is a systematic approach for enabling the design optimization there by ensuring both utility and performance by means of Taguchi’s parameter design concept. The system performance could be optimized by means of systematic setting of design parameters and reducing the fluctuations. This method employs a special design of orthogonal arrays to study entire process parameters with small number of experiments [11, 12]. Taguchi method based design experiment has been used to study effect of five CCGP process parameters i.e. Wt. % of SiC, Strain rate, No. of passes, Thickness and Heat treatment on one important out put parameter micro hardness. Present study was focused on optimization of cyclic constrained groove pressing parameter on the based on higher strength. The paper was focused on effect of SiC particle, strain rate, number of passes, thickness and heat treatment conditions with four levels. Table 1 shows five factors and four levels used in the experiment. If four levels were assigned to each of these factors and a factorial experimental design was employed using each of these values, number of permutations would be 625 experiments. The fractional factorial design reduced the number of experiments to sixteen. Therefore Taguchi based L16 orthogonal array is selected shown in Table 1. CCGP process parameter
and different levels are shown in table 2. Accordingly 16 experiments were carried out to study the effect of CCGP input parameters.
Table 1. Experimental layout using L16 orthogonal array
Expt. No.
Cyclic constrained groove pressing (CCGP) process parameters
A B C D E
1 5 0.5 1 3 0
2 5 1.0 3 4 1
3 5 1.5 5 5 3
4 5 2.0 7 6 5
5 10 0.5 3 5 5
6 10 1.0 1 6 3
7 10 1.5 7 3 1
8 10 2.0 5 4 0
9 15 0.5 5 6 1
10 15 1.0 7 5 0
11 15 1.5 1 4 5
12 15 2.0 3 3 3
13 20 0.5 7 4 3
14 20 1.0 5 3 5
15 20 1.5 3 6 0
Table 2. CCGP process parameters and different levels
Symbol Factors Unit Levels
1 2 3 4
A SiC Wt.% 5 10 15 20
B Strain rate mm /min 0.5 1.0 1.5 2.0
C No. of passes No. 1 3 5 7
D Thickness mm 3 4 5 6
E Heat treatment Hr 0 1 3 5
IV. DATA EVALUATION AND ANALYSIS
Taguchi Methods use the S/N (signal-to-noise) ratio to analyses the test run results because the S/N ratio represents both the average (mean) and variation (scatter) of the experimental results. The S/N ratio is also used in Analysis of Variance (ANONA). The term S/N ratio is borrowed from signal processing technology, but has different meanings here. A number of S/N ratios are available in Taguchi Methods, e.g., smaller-the-better, larger-the-better, and nominal-the-best. The standard S/N ratios can be customized to fit specific applications and new S/N ratios can be developed for particular applications. Selecting the proper S/N ratio depends on the physical properties of the problem, the engineering insight, the pursuing experiment results, etc.. In this study the Measurement of hardness is the objective function, so that the larger-the-better S/N ratio is chosen. The basic formulas and notations used in this study can be found in reference [11].
---(1)
Where S/NLTB stands for larger-the-better Signal-to-Noise ratio, MSD is the mean square deviation
around the target (infinity in this case), yi is the individually measured response value (experiment result), n is
the number of measurements taken in one test run. Table 3 shows the results of each test run and the S/NLTB
value calculated from equation (1).
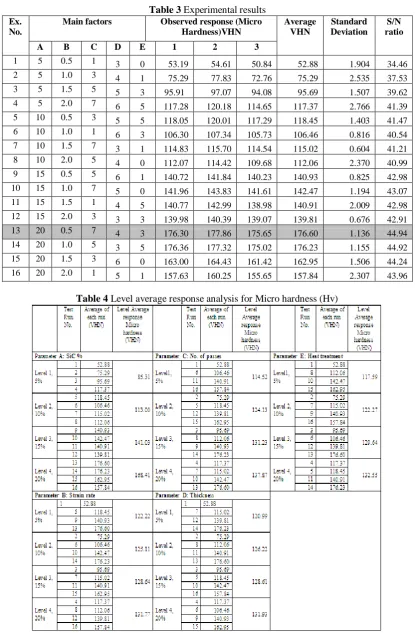
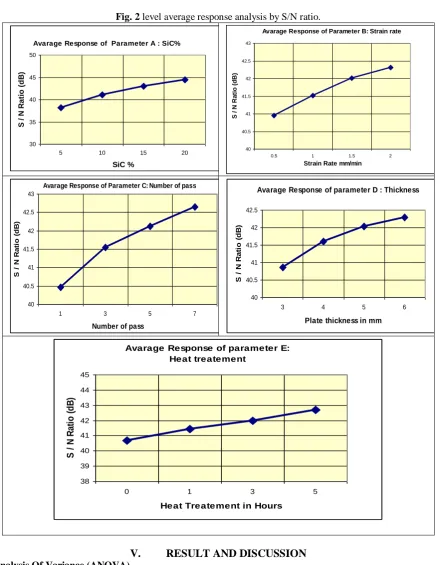
The level average response analysis is based on averaging the experiment results achieved at each level for each parameter. In this study, each level for each parameter contains four test runs. It can be seen from Table 3 that while the level 1 of parameter A occurs, in test run 1, 2 ,3 and 4, all four levels of parameters B, C, D and E appear once in these four test runs. The level 2 of parameter A occurs in test run 5, 6, 7 and 8, whilst all four levels of parameter B, C, D and E also appear once in these four test runs. The level 3 of parameter A occurs in test run 9, 10, 11 and 12, whilst all four levels of parameter B, C, D and E also appear once in these four test runs. The level 4 of parameter A is the same. Other levels of other parameters are the same, for example, level 1 of parameter B occurs at test runs 1, 5, 9 and 13, at these four test runs, all four levels of parameter A, C,D and E also appear once. When performing level average response analysis for one level of one parameter, all the influences from different levels of other parameters will be counterbalanced because every other parameter will appear at different level once. So the effect of one parameter at one level on the experiment results can be separated from other parameters. In this way, the effect of each level of every parameter can be viewed independently.
Table 3 Experimental results
Ex. No.
Main factors Observed response (Micro
Hardness)VHN
Average VHN
Standard Deviation
S/N ratio
A B C D E 1 2 3
1 5 0.5 1 3 0 53.19 54.61 50.84 52.88 1.904 34.46 2 5 1.0 3 4 1 75.29 77.83 72.76 75.29 2.535 37.53 3 5 1.5 5 5 3 95.91 97.07 94.08 95.69 1.507 39.62 4 5 2.0 7 6 5 117.28 120.18 114.65 117.37 2.766 41.39 5 10 0.5 3 5 5 118.05 120.01 117.29 118.45 1.403 41.47 6 10 1.0 1 6 3 106.30 107.34 105.73 106.46 0.816 40.54 7 10 1.5 7 3 1 114.83 115.70 114.54 115.02 0.604 41.21 8 10 2.0 5 4 0 112.07 114.42 109.68 112.06 2.370 40.99 9 15 0.5 5 6 1 140.72 141.84 140.23 140.93 0.825 42.98 10 15 1.0 7 5 0 141.96 143.83 141.61 142.47 1.194 43.07 11 15 1.5 1 4 5 140.77 142.99 138.98 140.91 2.009 42.98 12 15 2.0 3 3 3 139.98 140.39 139.07 139.81 0.676 42.91 13 20 0.5 7 4 3 176.30 177.86 175.65 176.60 1.136 44.94 14 20 1.0 5 3 5 176.36 177.32 175.02 176.23 1.155 44.92 15 20 1.5 3 6 0 163.00 164.43 161.42 162.95 1.506 44.24 16 20 2.0 1 5 1 157.63 160.25 155.65 157.84 2.307 43.96
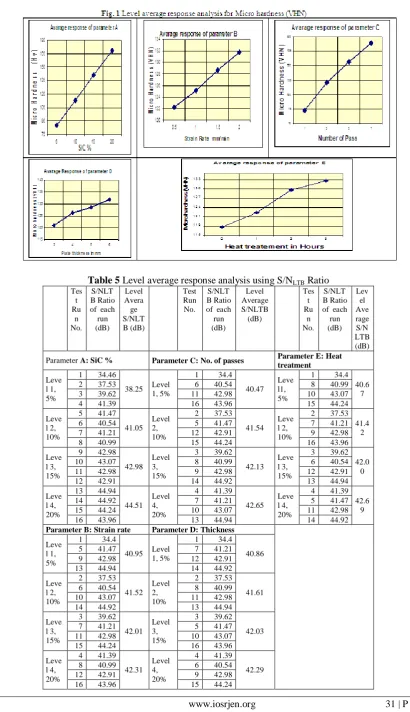
Table 5 Level average response analysis using S/NLTB Ratio Tes t Ru n No. S/NLT B Ratio of each run (dB) Level Avera ge S/NLT B (dB) Test Run No. S/NLT B Ratio of each run (dB) Level Average S/NLTB (dB) Tes t Ru n No. S/NLT B Ratio of each run (dB) Lev el Ave rage S/N LTB (dB)
Parameter A: SiC % Parameter C: No. of passes Parameter E: Heat treatment
Leve l 1, 5%
1 34.46
38.25 Level1, 5%
1 34.4
40.47 Leve l1, 5%
1 34.4 40.6
7
2 37.53 6 40.54 8 40.99
3 39.62 11 42.98 10 43.07
4 41.39 16 43.96 15 44.24
Leve l 2, 10%
5 41.47
41.05 Level 2, 10%
2 37.53
41.54 Leve l 2, 10%
2 37.53 41.4
2
6 40.54 5 41.47 7 41.21
7 41.21 12 42.91 9 42.98
8 40.99 15 44.24 16 43.96
Leve l 3, 15%
9 42.98
42.98 Level 3, 15%
3 39.62
42.13 Leve l 3, 15%
3 39.62 42.0
0
10 43.07 8 40.99 6 40.54
11 42.98 9 42.98 12 42.91
12 42.91 14 44.92 13 44.94
Leve l 4, 20%
13 44.94
44.51 Level 4, 20%
4 41.39
42.65 Leve l 4, 20%
4 41.39 42.6
9
14 44.92 7 41.21 5 41.47
15 44.24 10 43.07 11 42.98
16 43.96 13 44.94 14 44.92
Parameter B: Strain rate Parameter D: Thickness
Leve l 1, 5%
1 34.4
40.95 Level 1, 5%
1 34.4
40.86
5 41.47 7 41.21
9 42.98 12 42.91
13 44.94 14 44.92
Leve l 2, 10%
2 37.53
41.52 Level 2, 10%
2 37.53
41.61
6 40.54 8 40.99
10 43.07 11 42.98
14 44.92 13 44.94
Leve l 3, 15%
3 39.62
42.01 Level 3, 15%
3 39.62
42.03
7 41.21 5 41.47
11 42.98 10 43.07
15 44.24 16 43.96
Leve l 4, 20%
4 41.39
42.31 Level 4, 20%
4 41.39
42.29
8 40.99 6 40.54
Fig. 2 level average response analysis by S/N ratio.
Avarage Response of Parameter A : SiC%
30 35 40 45 50
5 10 15 20
SiC % S / N R a ti o ( d B )
Avarage Response of Parameter B: Strain rate
40 40.5 41 41.5 42 42.5 43
0.5 1 1.5 2
Strain Rate mm/min
S / N R a ti o (d B )
Avarage Response of Parameter C: Number of pass
40 40.5 41 41.5 42 42.5 43
1 3 5 7
Number of pass
S / N R a ti o ( d B )
Avarage Response of parameter D : Thickness
40 40.5 41 41.5 42 42.5
3 4 5 6
Plate thickness in mm
S / N R a ti o ( d B )
Avarage Response of parameter E: Heat treatement 38 39 40 41 42 43 44 45
0 1 3 5
Heat Treatement in Hours
S / N R at io ( d B )
V. RESULT AND DISCUSSION
Analysis Of Variance (ANOVA)
Analysis of variance is a computational technique to quantitatively estimate the relative contribution, which each controlled parameter makes to the overall measured response and expressing it as a percentage. Thus the information about how significant the effect of each controlled parameter is on the experimental results can be obtained. ANOVA uses S/N ratio responses to calculate. The basic idea of ANOVA is σT2 = σA2 + σB2 +
σC2 + σD2 + σE2 , that the total sum of the squares of the standard deviation (σT2,total variation) is equal to sum
of the squares of the standard deviation caused by each parameter σA2 , σB2 , σC2 ,σD2 ,σE2 The overall mean from
which all the variation (standard deviation) is calculated is given by
+
The grand total sum of squares GTSS is given by In this case,
--- (3)
+
= 27934.36
The GTSS can be decomposed into two parts, the sum of the squares due to overall mean and the sum of the squares due to variation around overall mean:
--- (4) 1. The sum of the squares due to overall mean:
--- (5)
Where n is the number of total test runs In this case,
SSmean = 16 X (41.69)2 = 27808.89
2. The sum of the squares due to variation around overall mean:
---- (6)
In this study,
SSvariation = (34.46 – 41.69)2 + (37.53 – 41.69)2 + (39.62 – 41.69)2 + (41.39 – 41.69)2 +
(41.47 – 41.69)2 + (40.54– 41.69)2 + (41.21– 41.69)2 + (40.99– 41.69)2 + (42.98– 41.69)2 + (43.07– 41.69)2 + (42.98– 41.69)2 + (42.91– 41.69)2 + (44.94– 41.69)2 + (44.92– 41.69)2 + (44.24– 41.69)2 + (43.96– 41.69)2
SSvariation = 115.41
The SSvariation can be further decomposed into the sums of the squares of the variation induced by individual parameter effects around overall mean. From The level average response analysis table , it is known that when doing level average response analysis for one level of one parameter, all the influences from different levels of other parameters will be counterbalanced. So, the level average S/N minus overall mean S/N is the variation caused by that parameter at that level.
For parameter A, the sum of the squares due to variation around overall mean is
In this case,
SSA = 4 x (38.25 - 41.69)2 +4 x (41.05 - 41.69)2 +4 x (42.98 - 41.69)2 + 4 x (44.51 - 41.69)2 = 87.41
Similarly,
SSB = 4 x (40.95 - 41.69)2 + 4 x (41.51 - 41.69)2 + 4 x (42.01 - 41.69)2 + 4 x (42.31 - 41.69)2 = 4.27
SSC = 4 x (40.47 - 41.69)2 + 4 x (41.54 - 41.69)2 + 4 x (42.13 - 41.69)2 + 4 x (42.65 - 41.69)2 = 10.50
SSD = 4 x (40.86 - 41.69)2 + 4 x (41.61 - 41.69)2 + 4 x (42.03 - 41.69)2 + 4 x (42.29 - 41.69)2 = 4.68
SSE = 4 x (40.68 - 41.69)2 + 4 x (41.42 - 41.69)2 + 4 x (42.00 - 41.69)2 + 4 x (42.69 - 41.69)2 = 8.76 The percentage contribution of each parameter is found:
Percentage contribution of Parameter = (SSparameter ) / (SSvariation)
In this study,
Parameter A, SiC %:
(87.41/115.41) x 100 = 75.74%
Parameter B: Strain rate: (4.27/115.41) x 100 = 3.70%
ParameterC: No. of passes: (10.50/115.41) x 100 = 9.1%
Parameter D: Thickness of the plate: (4.68/115.41) x 100 = 4.05%
Parameter E: Heat treatment: (8.76/115.41) x 100 = 7.59%
Fig.3 Percentage contributions for CCGP parameters A, B, C, D, and E by ANOVA.
75.74%), Strain rate (B = 3.7%), Number of pass(C = 9.1%), thickness of the plate (D=4.05%) and Heat treatment (E =7.59%) The pooled error is 0.009%. Based on the results presented in calculations, reinforcement of Sic is found to be the most influencing process parameter with contribution followed by number of pass, heat treatment, plate thickness and strain rate and this apportionment shown in Fig. 3. The main effects plot generated by excel sheet pertaining to ANOVA. The ranking of process parameters generated by the conduct of Taguchi method is shown in Table.5. As inferred from Table 5, reinforcement of Sic has been ranked as the highly prioritized process parameter followed by Number of pass, Heat treatment, the plate thickness and strain rate for the cyclic constrained groove pressing process.
VI. CONCLUSION
Taguchi Methods have been successfully applied to AL/Sic composite plate subjected to CCGP process parameter optimization in the first step of pressing
From the Experiments it is clear that the parameter reinforcement of SiC (A) has a highest amount of contribution on response values, Number of passes (C) has the second highest contribution on the response values and Heat treatment (E) the third highest contribution on the response values.
Other values of the thickness (D) and strain rate (B) show a very less amount of contribution.
From the Taguchi method it is confirmed that the best combination of experiment run which has a highest order and gives highest values on all the response values is experiment number 13
Al alloy composites containing SiC of 20% by weight, For 4mm thick Al/Sic composite plate compressed by 0.5 mm/min strain rate up to7 passes and heat treated foe 3hours gives the highest hardness 176.6 Hv. From the Taguchi analysis it is concluded that, at 99% confidence level, Al alloy composites
containing SiC has the highest contribution toward the response values obtained and the number of passes occupies the second highest contribution rate.
REFERENCES
[1]. R. Z. Valiev, I. V. Alexandrov, “NanostructuredMaterialsProduced by, Severe Plastic Deformation”
Logos, Moscow, 2000.
[2]. T. C. Lowe, R. Z. Valiev (Eds.), “Investigation and Applications of Severe Plastic Deformation” Kluwer, Dodrecht, 2000.
[3]. Z. Horita, T Fujinami, M Nemoto, T G Langdon,”Improvement of mechanical properties for Al alloys using equal-channel angular pressing,” Journal of Materials Processing Technology, vol. 117 (2001), pp.288-292.
[4]. V.M. Segal, “Materials processing by simple shear”, Mater. Sci. Eng. A197 (1995) 157–164.
[5]. N.Tsuji,K.Shiotsuki, H. Utsunomiya, and Y. Saito, in Proceedings of the International Symposiumon“Towards Innovation in Superplasticity-”TransTech.publications.
[6]. Krishnaiah A, Chakkingal U, Venugopal P. Production of ultrafine grain sizes in aluminium sheets by severe plastic deformation using the technique of groove pressing. Scripta Mater 2005;52:122933.
[7]. Z. Horita, M. Furukawa, K. Oh-Ishi, M. Nemoto, T.G. Langdon, in: T. Saki, H.G. Suzuki (Eds.), Proceeding of the fourth International Conference on Recystallization and Related Phenomena, Japan Institute of Metals, Japan, 1999, p. 301.
[8]. J. Gill Sevillano, P. van Houtte, E. Aernoudt, Prog. Mater. Sci. 25 (1980) 69.
[9]. Huang JY, Zhu YT, Jiang H, Lowe TC. Microstructures and dislocation configurations in nanostructured cu processed BY repetitive corrugation and straightening, Acta Mater, vol.49 (2001), pp. 1497–505.
[10]. S. V. Dobatkin, “Severe Plastic Deformation of Steels: Structure, Properties and Techniques”in Investigation and Applications of Severe Plastic Deformation,Ed. by T. C. Lowe and R. Valiev (Kluwer, Netherlands), 3 (2000) 13-22.
[11]. Cochran, W. G. and Cox, G. M. Experimental designs, 2nd 1968,(Wiley, New York; London).