A New Technique For Discrimination Between
Inrush Current And Fault Current In A Power
Transformers
Rouhollah Eskandari, Dr Mahdi Mozaffari Legha
Department of Power Engineering, Institute of Higher Education Javid,
Jiroft, Iran
sanat-bargharia@yahoo.com mozaffarilegha.m@gmail.com
Mohammad Mozaffari Legha
Department of Communication Engineering, Institute of Higher Education Besat,
Kerman, Iran
m_mozaffarilegha@yahoo.com
Abstract- This paper presents an accurate discrimination between fault and inrush current in power transformers. The method is based on that the waveform of the inrush distorts seriously, while the fault current nearly keeps sinusoid . The complicated signal can be decomposed into a finite intrinsic mode functions (IMF) by the Empirical Mode Decomposition (EMD), then define and compute the projection area on X-axis of each IMF-Sci, the specific gravity of SIMF- Kci, and the
maximum of Kci-Kmax. Theoretical analysis show
that the method can precisely discriminate inrush and fault current, fault clearance time is about 20ms. Moreover, it is convenient to achieve and hardly be affect by not-periodic component. Simulated results show the proposed technique can accurately discriminate between fault and inrush current in a power Transformer protection.
Keywords—Inrush Current, Transformer Protection, EMD, IMF, Fault detection.
I. INTRODUCTION
Transformer protection is critical issue in power system and the issue lies in the accurate and rapid discrimination of inrush from fault current. This paper describes a new method to discriminate the inrush current and fault using the Empirical Mode Decomposition (EMD). At present, the domestic transformer primary protection in power system configuration mainly uses second harmonic restraint principle and longitudinal differential protection based on current discontinuous corner braking principle. The long-term operating experience shows that the differential protection cannot accurately distinguish the difference between the transformer internal faults and external faults, so the main contradiction is still focused on the identification of magnetizing inrush and internal fault [5].
II. METHOD
A. Theorical Overview of EMD
The Empirical Mode Decomposition (EMD) has been proposed as an adaptive time-frequency data
derived from the simple assumption that any signal consists of different intrinsic mode functions (IMF) each of them representing an embedded distinctive oscillation on a separated time-scale. An IMF is defined by two criteria: i) the number of extrema and of zero crossings must either equal or differ at most by zone, and, ii) at any instant in time, the mean value of the envelope defined by the local maxima and the envelope of the local minima is zero. The following plan offers an idea about the principle algorithm of the EMD:
1. Initialize 𝑟0(𝑡) = 𝑥(𝑡); 𝑗 = 1
2. Extract the 𝑗_𝑡ℎ IMF:
(a) Initialize ℎ0(𝑡) = 𝑟𝑗(𝑡); 𝑘 = 1
(b) Locate local maxima and minima of ℎ𝑘−1(𝑡)
(c) Cubic spline interpolation to define upper and lower envelope of ℎ𝑘−1(𝑡)
(d) Calculate mean 𝑚𝑘−1(𝑡) from upper and lower
envelope of ℎ𝑘−1(𝑡)
(e) Define ℎ𝑘(𝑡) = ℎ𝑘−1(𝑡) − 𝑚𝑘−1(𝑡)
(f) If stopping criteria are satisfied then ℎ𝑗(𝑡) = ℎ𝑘(𝑡) else goto 2. (b) with 𝑘 = 𝑘 + 1
3. Define𝑟𝑗(𝑡) = 𝑟𝑗−1(𝑡) − ℎ𝑗(𝑡)
4. If 𝑟𝑗(𝑡) still has at least two extrema then go to 2.
(a) with 𝑗 = 𝑗 + 1 else the EMD is finished 5. 𝑟𝑗(𝑡) is the residue of 𝑥(𝑡)
At the end of this numerical sifting process the signal
𝑥(𝑡) can be expressed:
𝑥(𝑡) = ∑ ℎ𝑗(𝑡) + 𝑟𝑛(𝑡) 𝑛
𝑗=1
Where ℎ𝑗(𝑡) indicates the 𝑗_𝑡ℎ IMF, 𝑛 as the number of sifted IMF and 𝑟𝑛(𝑡) denotes a residue which can be understood as the trend of the signal
Vol. 2 Issue 11, November - 2016 inflection point instead of extreme point, the
decomposition results can be obtained by differentiating the data once or more times and integrating the extremism. The essence of this approach gets the intrinsic fluctuations mode by the characteristic time scale of the data, and then break down the data. This decomposition process can be vividly called “selecting” process.
Decomposition process: Find out all the maxima of the original data sequence x (t) and cubic saline interpolation function fitting form of the original data on envelope; Similarly, find out all the minimum point, and all of the minimum point formed by cubic spine interpolation function fitting the data under the envelope, the upper envelope and lower envelope means recorded as 1 m, The original data sequence x (t) by subtracting the average envelope obtain a new data sequence [5].
ℎ1= 𝑥(𝑡) − 𝑚1
C. Simulation and Application
A system with a generator, a three phase transformer and a load has been simulated. A typical 750MVA, 27/420KV, Power transformer is connected between 25KV source at sending end 400 KV transmission line three phase connection diagram are shown in Figure 1. Iad Ibd Icd refer to a,b,c three
phase differential current through CT secondary side: n1, n2 are the number turn on the low voltage (LV) and high voltage on (HV) the simulation of these power transformer is carried out using MATLAB software which is Shown in Figure 2. In each simulation of the system parameter are varied including the fault type fault position , fault inception angle , remnant flux in power transformer core. and also the effect of CT saturation is also studied [16].
Fig.1. Simulated Power system model
Fig.2. MATLAB model
D. Specific Methods and Protection Criteria Search IMF [5].
The dominant IMF is broken down into component of the IMF with a large amplitude .In order to search for the dominant IMF easily, this article defines IMF component Ci on the horizontal axis of the projected
area Sci as follows:
𝑆𝑐𝑖= ∫ |𝐶𝑖(𝑡)|𝑑𝑡
𝑡𝑛
𝑡0
𝑆𝑐𝑖 = ∑|𝐶𝑖(𝑡)∆𝑡|
𝑛
1
According to formula the way to get the dominant IMF is: Calculate the various components coif IMF then
𝑆𝑚𝑎𝑥= max {𝑆𝑐𝑖, 𝑖 = 1 … . 𝑛} , if the Sci of Ci have a
difference with Smax in 20%, ci of IMF is the
dominant IMF.
E. Protection Criteria
The According to this identification principle, we define the proportion ci of component coefficient kci is:
𝐾𝑐𝑖=
𝐾𝑚𝑎𝑥= 𝑚𝑎𝑥1
𝑛{𝑆 𝑐𝑖}
∑ 𝑆𝑛1 𝑐𝑖+ 𝑆𝑟
As it can be seen in formula, the value of Kmax
changes between 0~1, When the differential current is fault current, since it contains only one dominant IMF, the value of kmax is very large, almost above 0.9.
When the differential current is inrush current due to the presume to the presence of two or more similar to the proportion coefficient leading the IMF the value of kmax is 0.5. Additionally, when the magnitude of the
differential current data window is not greater than the maximum unbalanced current the value of kmax is 0.
Therefore, we can obtain protection criterion as shows:
𝐾𝑚𝑎𝑥≥ 𝐾𝑧𝑑
𝐾𝑧𝑑 = 0.8 respectively calculate three-phase differential current Kmax Define [5].
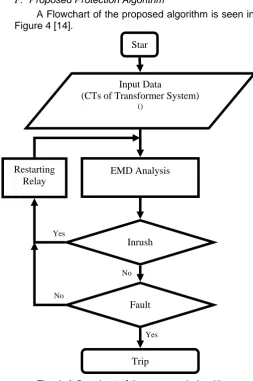
F. Proposed Protection Algorithm
A Flowchart of the proposed algorithm is seen in Figure 4 [14].
Fig. 4: A flowchart of the proposed algorithm
III. TESTS AND RESULTS
A. Case A: Transformer DD
Experimental transformer no-load inrush current and load interterm fault cases, the two sets of waveforms, and a group of normal waveform. Since this article transformer experiment is the presence of harmonic components in the laboratory, during the test, so the experimental results from the waveform is not sinusoidal waveform, but presents the trend of a square wave. Transformer inrush current experimental waveform graph is showed in Figure 5 and EMD analysis is showed in Table 1. Transformer fault current experimental waveform is showed in Figure 6 and EMD analysis is showed in Table 2.
Fig. 5: Inrush current waveform in Primary transformer DD for Phase A
Table 1: EMD analysis of inrush current in Primary transformer DD for Phase A
IMF-Sci Kmax
i=1 0.0000
2.238 i=2 0.0001 i=3 0.0000 i=4 0.0001 i=5 0.0003 i=6 0.0067 i=7 0.0502 i=8 0.0025 i=9 0.0078 i=10 0.0206 i=11 0.0550 i=12 0.2939 -1
0 1 2 3 4 5 6 7
x 10-3
In
ru
s
h
c
u
rr
e
n
t
w
a
v
e
fo
rm
i
n
P
ri
m
a
ry
t
ra
n
s
fo
rm
e
r
D
D
f
o
r
P
h
a
s
e
A
Star t
Input Data
(CTs of Transformer System)
()
EMD Analysis
Inrush Current?
Trip
Yes
Restarting Relay
No
Fault Current?
Yes
Vol. 2 Issue 11, November - 2016
Fig. 6: Boxplots showing the sifting iterations for each mode Inrush current transformer DD with EEMD
Fig. 7: fault current (LG) waveform in Primary transformer DD for Phase A
Table 2: EMD analysis of fault current (LG) in Primary transformer DD for Phase A
IMF-Sci Kmax
i=1 0.0004
3.267 i=2 0.0004
i=3 0.0103 i=4 0.0055 i=5 0.0035 i=6 0.0040 i=7 0.0094 i=8 0.1384 i=9 0.4296 i=10 0.8038 i=11 0.2480 i=12 3.2554
Fig. 8: Boxplots showing the sifting iterations for each mode fault current (LG) transformer DD with EEMD
B. Case A:Transformer YD
Experimental transformer no-load inrush current and load interterm fault cases, the two sets of waveforms, and a group of normal waveform. Since this article transformer experiment is the presence of harmonic components in the laboratory, during the test, so the experimental results from the waveform is not sinusoidal waveform, but presents the trend of a square wave. Transformer inrush current experimental waveform graph is showed in Figure 7 and EMD analysis is showed in Table 3. Transformer fault current experimental waveform is showed in Figure 8 and EMD analysis is showed in Table 4.
Fig. 9: Inrush current waveform in Primary transformer YD for Phase A
0 50 100 150
1 2 3 4 5 6 7 8 9 10 11 12
IMF
S
if
ti
n
g
I
te
ra
ti
o
n
s
-0.05 0 0.05 0.1
fa
u
lt
c
u
rr
e
n
t
(L
G
)
w
a
v
e
fo
rm
i
n
P
ri
m
a
ry
t
ra
n
s
fo
rm
e
r
D
D
f
o
r
P
h
a
s
e
A
0 50 100 150 200 250
1 2 3 4 5 6 7 8 9 10 11 12
IMF
S
if
ti
n
g
I
te
ra
ti
o
n
s
0 1 2 3 4 5 6
x 10-3
In
ru
s
h
c
u
rr
e
n
t
w
a
v
e
fo
rm
i
n
P
ri
m
a
ry
t
ra
n
s
fo
rm
e
r
Y
D
f
o
r
P
h
a
s
e
Table 3: EMD analysis of inrush current in Primary transformer YD for Phase A
IMF-Sci Kmax
i=1 0.0003
0.881
i=2 0.0002
i=3 0.0016
i=4 0.0008
i=5 0.0001
i=6 0.0019
i=7 0.0506
i=8 0.0013
i=9 0.0130
i=10 0.0225 i=11 0.0742 i=12 0.2594
Fig. 10: Boxplots showing the sifting iterations for each mode Inrush current transformer YD with EEMD
Fig. 11: fault current (LG) waveform in Primary transformer YD for Phase A
Table 4: EMD analysis of fault current (LG) in Primary transformer YD for Phase A
IMF-Sci Kmax
i=1 0.0024
6.04
i=2 0.0036
i=3 0.0180
i=4 0.0140
i=5 0.0032
i=6 0.0026
i=7 0.0112
i=8 0.1547
i=9 0.7522
i=10 0.8783 i=11 0.5879 i=12 4.4711
Fig. 12: Boxplots showing the sifting iterations for each mode fault current (LG) transformer YD with
EEMD
C. Case A: Transformer YY
Experimental transformer no-load inrush current and load interterm fault cases, the two sets of waveforms, and a group of normal waveform. Since this article transformer experiment is the presence of harmonic components in the laboratory, during the test, so the experimental results from the waveform is not sinusoidal waveform, but presents the trend of a square wave. Transformer inrush current experimental waveform graph is showed in Figure 9 and EMD analysis is showed in Table 5. Transformer fault current experimental waveform is showed in Figure 10 and EMD analysis is showed in Table 6.
0 20 40 60 80 100 120 140 160 180
1 2 3 4 5 6 7 8 9 10 11 12
IMF
S
if
ti
n
g
I
te
ra
ti
o
n
s
-0.1 -0.05 0 0.05 0.1 0.15
fa
u
lt
c
u
rr
e
n
t
(L
G
)
w
a
v
e
fo
rm
i
n
P
ri
m
a
ry
t
ra
n
s
fo
rm
e
r
Y
D
f
o
r
P
h
a
s
e
A
0 50 100 150
1 2 3 4 5 6 7 8 9 10 11 12
IMF
S
if
ti
n
g
I
te
ra
ti
o
n
Vol. 2 Issue 11, November - 2016
Fig. 13: Inrush current waveform in Primary transformer YY for Phase A
Table 5: EMD analysis of inrush current in Primary transformer YY for Phase A
IMF-Sci Kmax
i=1 0.0005 0.28 5 i=2 0.0003 i=3 0.0003 i=4 0.0004 i=5 0.0002 i=6 0.0012 i=7 0.0510 i=8 0.0030 i=9 0.0091
i=10 0.0203
i=11 0.0637
i=12 0.486
Fig. 14: Boxplots showing the sifting iterations for each mode fault current (LG) transformer YY with
EEMD
Fig. 15: fault current (LG) waveform in Primary transformer YY for Phase A
Table 6: EMD analysis of fault current (LG) in Primary transformer YY for Phase A
IMF-Sci Kmax
i=1 0.0076 3.320 i=2 0.0028 i=3 0.0270 i=4 0.0181 i=5 0.0011 i=6 0.0048 i=7 0.0185 i=8 0.1375 i=9 0.6485
i=10 0.9977 i=11 0.4552 i=12 4.6194
Fig. 16: Boxplots showing the sifting iterations for each mode fault current (LG) transformer YY with
EEMD 0 1 2 3 4 5 6
x 10-3
In ru s h c u rr e n t w a v e fo rm i n P ri m a ry t ra n s fo rm e r Y Y f o r P h a s e A 0 50 100 150 200 250 300
1 2 3 4 5 6 7 8 9 10 11 12 13 IMF S if ti n g I te ra ti o n s -0.1 -0.05 0 0.05 0.1 0.15 fa u lt c u rr e n t (L G ) w a v e fo rm i n P ri m a ry t ra n s fo rm e r Y Y f o r P h a s e A 0 50 100 150 200
1 2 3 4 5 6 7 8 9 10 11 12
The value of kmax based on EMD analysis in
transformer with DD connection is 2.238 for inrush current and 3.267 for fault current, in transformer with YD connection is 0.881for inrush current and 6.04 for fault current, in transformer with YY connection is 0.285 for inrush current and 3.320 for fault current. It is concluded that Kmax is less than 3 for inrush current and more than 3 for fault current.
The value of Scifor IMFs based on EMD analysis; in transformer with DD connection is 0.2939 for inrush current and 3.2554for fault current, in transformer with YD connection is 0.2594 for inrush current and 4.4711 for fault current, in transformer with YD connection is 0.486 for inrush current and 4.6194 for fault current. It is concluded from IMFs that Sci is less than 1 for inrush current and more than 3 for fault current.
IV. CONCLUSIONS
The processing method, fundamentally speaking, is based on the analysis of the three-phase current fundamental and higher harmonics, and then determines the algorithm of the higher harmonic content, but makes the method different from the conventional signal due to the role of the EMD methods of analysis. It is more convenient from the principles and experimental methods to distinguish normal airdrop and fault conditions, but there are also some shortcomings. The main reason is that the EMD algorithm is still not perfect in the border problem and envelope fitting: Firstly, there is not a suitable envelope exploded function resulting in fluctuations of max K; secondly, there is no particularly good boundary processing method.
References
[1] T. Y. Li, Y. Zhao and N. Li, “A New Method for Power Quality Detection Based on HHT,” Proceedings of the Csee, Vol. 25, No. 17, 2005, pp. 52-56
[2] Z. Ke, J. Jie and T. Q. Zhang, “Distinguishing Magnetizing Inrush Based on Characteristic of Equivalent Instantaneous Inductance,” Power System Protection and Control, 2010, pp. 12-16
[3] J. A. Sykes and L. F. Morrison, “A Proposed Method of Harmonic Restraint Differential Protection of Transformers by Digital Computer,” IEEE Transactions on Power Apparatus and Systems, Vol. PAS-91, pp.
[4] F. M. Cao and P. P. Su, “The Application of Wavelet transform in Transformer’s Differential Protection,” Electric Power, Vol. 31, No. 11, 1998, pp. 21-24.
[5] Fanyuan Zeng, Qianjin Liu, Chao Shi.'' The Discrimination of Inrush Current from Internal Fault of Power Transformer based on EMD''; Energy and Power Engineering, 2013, 5, 1425-1428
[6] M.A. Rahman, B. So, M. R. Zaman, M.A. Hoque", Testing of Algorithms for A Stand-Alone Digital Relay for Power Transformers, IEEE Transactions on Power Delivery, Vol. 13, No. 2, April 1998.
[7] M. Habib, M.A. Marin", A Comparative Analysis of Digital Relaying Algorithms for Deferential Protection
of Three Phase Transformers, IEEE Transactions on Power Systems, Vol. 3. No. 3, August 1988.
[8] M. Fancisco, A.A. Jose, Wavelet Based ANN Approach For Transmission Line Protection, IEEE Power Engineering Review, 2003.
[9] P. Liu, O. P. Malik, D. S. Chen, G. S. Hope and Y. Guo, “Improved Operation of Differential Protection of Power Transformers for Intemal Faults,” IEEE Transactions on Power Delivery, Vo1. 7,1992.
[10] S. H. Jiao, W. S. Liu, J. F. Liu, Z. H. Zhang and Q. X. Yang, “A New Principle of Discrimination between Inrrush Current and Fault Current of Transformer Based on Wavelet,” Proceedings of the CSEE, Jul. 1999, pp. 1-5.
[11] Y.W. Seng, Q. Wang, A. Wavelet Based Method to Discriminate Between Inrush Current and Internal Fault, Power System Technology, 2000. Proceedings. PowerCon 2000. International Conference, Volume: 2, 4-7 Dec. 2000, Page(s): 927 -931 vol. 2.
[12] L. M. Peilin, R.K. Aggarwal, A Novel, Approach to the Classication of the Transient Phenomena in Power Transformers Using Combined Wavelet Transform and Neural Network, IEEE Transactions on Power Delivery, Vol. 16, No. 4, October, 2002.
[13] M. Vannucci, P.J. Brown, T. Fearn, A Decision Theoretical Approach to Wavelet Regression on Curves With a High Number of Regressors. Journal of Statistical Planning and Inference, 112(1-2), 195-212, 2003
[14] Mahdi Mozaffari Legha, Rouhollah Abdollahzadeh Sangrood, Ardalan Zargar Raeiszadeh, Mohammad Mozaffari Legha,, “CONDUCTOR SIZE SELECTION IN PLANNING OF RADIAL DISTRIBUTION SYSTEMS FOR PRODUCTIVITY IMPROVEMENT USING IMPERIALIST COMPETITIVE ALGORITHM”, International Journal on Technical and Physical Problems of Engineering (IJTPE), Issue 15, Vol. 5, No. 2, pp. 65-69, June 2013.
[15] M.A. Rahman, B. Jeyasurya", A State-of-The-Art Review of Transformer Protection Algorithms, IEEE Transactions on Power Delivery, Vol. 3, No. 2, April 1988.
[16] Mohammad Nayeem A Tahasildar & S. L. Shaikh'' A Novel Technique for Power Transformer Protection based on Combined Wavelet Transformer and Neural Network''; International Journal of Advanced Electrical and Electronics Engineering, (IJAEEE), Volume-2, Issue-4, 2013, pp: 2278-8948. [17] Mahdi Mozaffari Legha, Mohammad Mohammadi, “Aging Analysis and Reconductoring of Overhead Conductors for Radial Distribution Systems Using Genetic Algorithm“ Journal of Electrical Engineering & Technology (JEET) , 2014.
[18] Mahdi Mozaffari Legha, Hassan Javaheri, Mohammad Mozaffari Legha, “Optimal Conductor Selection in Radial Distribution Systems for Productivity Improvement Using Genetic Algorithm “Iraqi Journal for Electrical and Electronic Engineering (IJEEE), Vol.9 No.1 , 2013, 29-36.
Vol. 2 Issue 11, November - 2016 Wavelet Transform''. Power Turk J Elec Engin,
TUBITAK 2005, VOL.13, NO.1,pp: 119-135.
[20] M. Mozaffari Legha, (2011) Determination of exhaustion and junction of in distribution network and its loss maximum, due to geographical condition, MS.c Thesis. Islamic Azad University, Saveh Branch, Markazi Province, Iran.
[21] Mahdi Mozaffari Legha Majid Gandomkar, “Reconfiguration of MV network for balancing and reducing losses to by CYMEDIST software in Khorramabad”, 16th Electric Power Distribution Conference (EPDC16), pp. 25-32, 2012.
BIOGRAPHIES
Rouhollah Eskandari MSc student of
Power Engineering from Department of Power Engineering, Institute of Higher Education Javid, Jiroft. He is interested in the Renewable Energy, and power distribution systems.
Mahdi MozaffariLegha was born in
Kerman, Iran, in 1987. He's PhD student of Power Engineering from Shiraz University, He is Faculty Member of Department of Electrical Engineering, Institute of Higher Education Javid, Jiroft, Iran. He is interested in the Micro grid and smart grid, stability of power systems, Renewable Energy, electrical distribution systems and DSP in power systems. He has presented more than 25 journal papers and 100 conference papers.
Mohammad Mozaffari Legha MSc