Journal of the Serbian Society for Computational Mechanics / Vol. 6 / No. 2, 2012 / pp. 87-107
(UDC: 539.42:519.673)
Evolution of stress intensity factors in mixed mode with presence of
mismatch effect
T.Tamine1a, N.Kazi Tani2, G.Pluvinage3
1
Laboratoire LCGE, Faculté de Génie Mécanique, USTO M.B , 1505 EL M‘NAOUER 31000 Oran, Algérie
a
Corresponding author : [email protected]
2
Laboratoire LM2SC, Faculté d‘Architecture et de Génie Civil, USTO M.B, 1505 El M‘NAOUER 31000 Oran, Algérie
3Fiabilité Mécanique Conseil. Silly sur Nied 57530 France
Abstract
In this study, numerical models based on finite element method are developed for several applications of fracture mechanics. The use of cracked specimen formed by different material properties has allowed us to analyse the effect of the crack position to the interface and to have a well understanding of mismatch effect for the case of mixed mode of fracture. In other hand, we have noticed that it is very interesting to see the effect of the interface position and loading for the case of symmetrically cracked ring specimen under compression loading.
Keywords: crack, interface/bi-material/mixed mode/stress intensity factor/mismatch effect.
1. Introduction
T.Tamine et al.: Evolution of stress intensity factors in mixed mode with presence of mismatch effect
88
in bi-material interface has been studied by [Bjerken and Persson 2011] and [Ikeda &Sun 2001]. The first authors have applied integral method for the determination of complex relationships of stress intensity factors, the second authors have used the virtual crack extension technique for cracked bi-material specimen under thermal loading. [Kang Yilan and Lu Hua 2002] have developed a calculation procedure for displacement field near the crack tip emanating from interface. Experimental methods have been used by [Jiang & al 2004] to describe the evolution of J-R curves and to study the propagation of cracks emanating from interface of bi-material specimens under three points flexion loading. Another experimental method based on RGB photoelasticity has been carried out by [Cirello and Zuccarelo 2006] to analyse the propagation of cracks perpendicular to interface of bi-material plates. Numerical models have been developed by [Madani & al 2007], [Ouinas & al 2008] and [Kazi Tani& al 2009]to show the effect of interfaces on crack propagation in bi-material specimen. The restitution energy rate G and the stress intensity factor(SIF) have been determined by those authors for several crack positions between dissimilar materials.
In this present paper, two important points are discussed; the first one is to describe the effect of mixed mode on the decreased curves of stress intensity factor obtained by Cirello and Zuccarelo using RGB photoelasticitytechnique [Cirello and Zuccarelo 2006] and confirmed numerically by [Kazi Tani& al 2009] on bi-material plates PSM1/AlPolycarbonate/Aluminium, for the first mode of fracture. The second point concerns the influence of the interface position and loading direction on the stress field near the crack tip of bi-material ring specimen where cracks are symmetrically located.
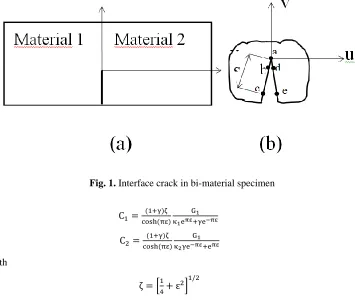
2. Stress intensity factor at bi-material interface
For a crack of 2a length located at the interface between two dissimilar materials subjected to a uniform tensile load, the complex relationship of the stress intensity factors are given by [Rice 1988] as:
Bi-elastic constant is given by :
With
Where
in plane strain;
( ) in plane stress; and
Journal of the Serbian Society for Computational Mechanics / Vol. 6 / No. 2, 2012 89
From displacements values of nodes a, b, c, d, e obtained by finite element method, it is possible to express opening and shear fracture modes by the following equations given by references [Tan and Gao 1990], and [E. Ergun et al. 2008]:
√ [ ( ) ( )]
√ [ ( ) ( )]
s is the distance between nodes a and c or a and e.
and are respectively the node displacements with respect to x and y axis.
Fig. 1. Interface crack in bi-material specimen
(7)
(8)
with
* ε + (9)
3. NumericalExamples
3.1.Mismatch effect in mixed mode
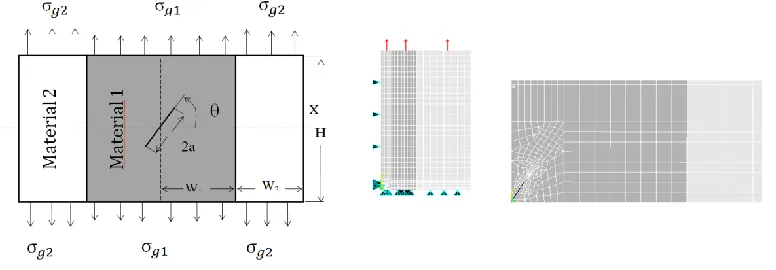
To have a well understanding of mismatch effect, we have taken back the numerical example which was in analyzed in references[A. Cirello and B. Zuccarello 2006] and [N. Kazi Tani et al. 2009].In our case, an inclined central crack of 2a length with an angle fromhorizontal axisxas shown in Figure 2 is studied. The cracked bi-material formed by polycarbonatePSM-1 (Material 1) and Aluminium (Material 2) which it‘s dimensions are W2/W1=1.5, H/W1=12.5, W1=12mm
T.Tamine et al.: Evolution of stress intensity factors in mixed mode with presence of mismatch effect
90
direction, g=20MPa. It is possible to determine the applied stress on each material by applying
the principle of Matrix-fiber system where the applied stress is given by [12] as follows:
* + (10)
If we suppose that both materials 1 and 2 behave elasticallyand the global deformation is the same for each side of material 1 and 2, then we can write:
(11)
From equations (10) and (11), we can split the total stress into two components and .
Numerical modelcarried out by usingANSYS software finite elementhave allowed us to determine the displacement field and stress intensity factors for mode I and mode II. The solution of the problem has been calculated by using 8 node quadratic elementsin plane stress by computing K1, K2 from the nodal displacements on opposite sides of the crack
plane[Madenci and Guven 2006] with singular element size around 5% of crack length.For symmetric configuration of the specimen, only the quarter of the plateis considered in finite elements model (Fig. 2).
Fig. 2. Numerical model of bi-material plate containing a central inclined crack
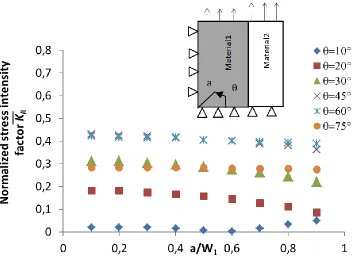
The numerical results of stress intensity factors obtained in mode I and II are plottedin Figure 3-a 3-and Figure 4. For well representing those results, thev3-alues of SIF 3-are norm3-alized by
√ Results of ̅in Figure 3-a are compared with the case of mode I,Figure 3-b obtained
Journal of the Serbian Society for Computational Mechanics / Vol. 6 / No. 2, 2012 91
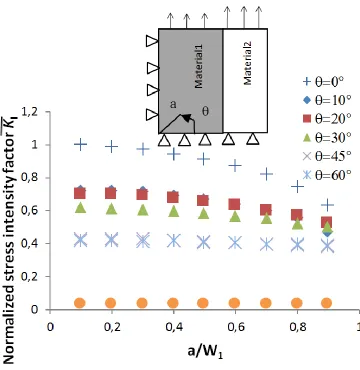
Fig. 3-a. Evolution of normalized stress intensity factor ̅ with crack length and inclinaison
T.Tamine et al.: Evolution of stress intensity factors in mixed mode with presence of mismatch effect
92
Journal of the Serbian Society for Computational Mechanics / Vol. 6 / No. 2, 2012 93
Fig. 4. Evolution of normalized stress intensity factor ̅ with crack length and inclinaison
angle , ⁄
According to the results plotted in Figure 3-a and Figure 4, we have noticed that for the most of
inclinaison angles of crack, the normalized stress intensity factors ̅and ̅ are decreasing as
the crack becomes longer. In the case of mode I, the decreased valuesare more significant when
variesbetween 0° and 30°. The values of ̅ seems constant for the case when>45°. This decreased curve is well described by [Kazi Tani et al. 2009] for a central crack in mode I. The same evolution has been noticed for mode II (Figure 4) except for the case = 10° where thenormalized SIF increases with crack lengths a/W>0.6.
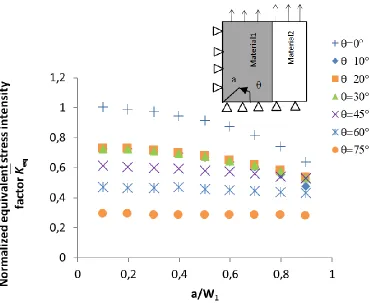
In order to compare the numerical results with first mode of fracture mode I (=0) [Kazi Tani et al. 2009], we have represented in Figure 5,the equivalent stress intensity factor for the mixed mode ̅ , which it is given by the following relationship:
̅ √ ̅ ̅ (12)
In Figure 5, the equivalent stress intensity factor ̅ decreases when inclination angle varies
between 0° and 45°. For angles = 60° and 75°, ̅ values seem to be constant and do not
depend on the crack length. This can be explained by the presence of mismatch effect which is more significant when the crack tip is nearthe interface.The presence of the crack in weakest material and mismatch effect yield a ―closing‖ bridging stress intensity factor that decreases the stress intensity factor resulting from external loading, especially when the crack tip is close to the interface.
T.Tamine et al.: Evolution of stress intensity factors in mixed mode with presence of mismatch effect
94
Fig. 5. Evolution of normalized equivalent stress intensity factor ̅ with crack length and
inclinaison angle ⁄
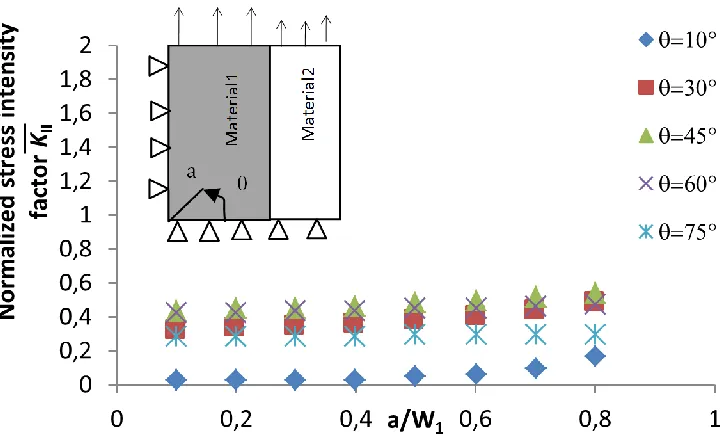
The numerical results of stress intensity factors in mode I and II are shown in Figure 6 and Figure 7.
In Figure 6, the increasing curves of ̅̅̅are more significant when angles vary between
=0° and =45°.For =60° and 75°, the values of normalized SIF are very close.
In Figure 7, which represents the second mode, we notice that ̅̅̅̅ values increase with the
crack length
for allangles except where̅̅̅̅ data finishes by decreasing from a/W1>0.6.
Journal of the Serbian Society for Computational Mechanics / Vol. 6 / No. 2, 2012 95
Fig. 6. Evolution of normalized stress intensity factor ̅ with crack length and inclination
⁄
Fig. 7. Evolution of normalized stress intensity factor ̅ with crack length and inclination
T.Tamine et al.: Evolution of stress intensity factors in mixed mode with presence of mismatch effect
96
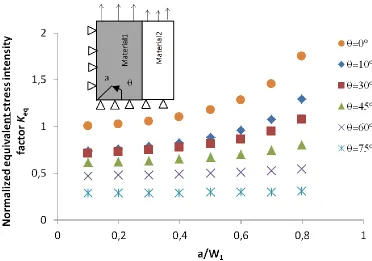
Fig. 8. Evolution of normalized equivalent stress intensity factor ̅ with crack length and
inclination angle , ⁄
Graphs in Figure 8 show the increase of normalized stress intensity factor with crack length and this, for all the inclination angles of the crack except for =75°where ̅ remains
constantfor all geometric ratios a/W1.
From the results, the influence of the interface on the evolution of ̅ is significant for
a/W1>0.3 and the slope evolution of graphs seems higher especially for inclination angles
between =0° and =60°. This slope is less pronounced for >60°.
These results show that the increase of ̅ with the ratio of crack size to the distance to the
interface depends strongly on the ratio of Young‘s moduli of the two materials: under uniform applied displacement, ̅ decreases when the crack inclination becomes closer to the interface
direction if the crack is located in the weakest material.
Also it is important to insist that the width ratio W1/W2 has no effect on the ̅ results and
this is connected to the boundary conditions which states that .
The mismatch effect concerns also the mixed mode of fracture and depends on crack inclinaison angle.It is important to established that normalized equivalent stress intensity factors values in mixed mode will never exceed the ones obtained for the case of the first mode of fracture, i.e =0°.
The fact to consider geometric ratio of specimen W1/W2=1.5 in mixed mode don‘t have any
Journal of the Serbian Society for Computational Mechanics / Vol. 6 / No. 2, 2012 97 3.2. Symmetric cracks in bi-material ring specimen:
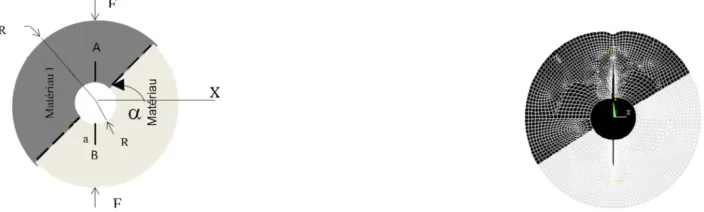
3.2.1. Influence of interface position on the stress intensity factors
Figure 9 shows a bi-material cracked ring specimen where the edge cracks are located symmetrically with a length and subjected to a compression load F. Mechanical properties of material 1 are (Young modulus E1= 3050 MPa, Poisson ratio 1=0.39) and for material 2, we
have(Young modulus E2= 64300 MPa, Poisson ratio 2=0.33).
Geometricratio of the crack is defined by a/(R2-R1) which varies between 0.1 and 0.7,
radius ratio of ring is R2/R1= 4.0 and the thickness of the ring specimen is equal to 5mm.
Numerical model of the cracked specimen is considered with a flat edge where a pressure of P=F/S is applied (S is the flat cross section). The resolution is performedin plane stress using 8 nodes quadratic elements, (Figure 9).The global stress for this case can be expressed with the following relationship given by [20]:
(13)
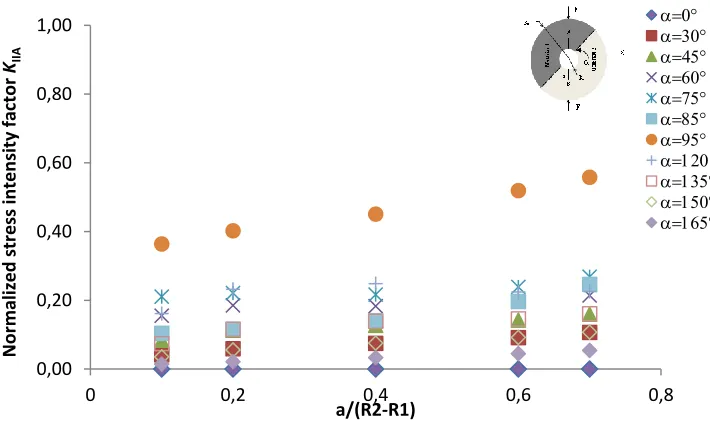
The calculation of the normalized stress intensity factors is done by using the formulation
√ at crack tip A and B. Then, we obtain onthe following graphs, Figure 10 and 11 respectively for mode I and mode IIat crack tip A.
Figures 12 and 13 show the same factors for the crack tip B. In each case, the SIFdata decreasewhen the interface angle increases. A minimum appears more or less pronounced for a normalized crack length of 0.4.
a/ Compression loading of cracked specimen b/ FEMeshing of cracked specimen
T.Tamine et al.: Evolution of stress intensity factors in mixed mode with presence of mismatch effect
98
Fig. 10. Evolution of normalized stress intensity factor in mode I (opening) at crack tip A, E1/E2
= 0.047
Fig. 11. Evolution of normalized stress intensity factor in mode II (shear) at crack tip A
0 0,5 1 1,5 2 2,5 3 3,5 4
0 0,2 0,4 0,6 0,8
Normal ized stress inten sity factor KIA a/(R2-R1) 0,00 0,20 0,40 0,60 0,80 1,00
0 0,2 0,4 0,6 0,8
Journal of the Serbian Society for Computational Mechanics / Vol. 6 / No. 2, 2012 99
Fig. 12. Evolution of normalized stress intensity factor in mode I (opening) at crack tip B
Fig. 13. Evolution of normalized stress intensity factor in mode II (shear) at crack tip BThe
Figures 14 and 15 show the evolution of normalized equivalent stress intensity ̅ and ̅ 0 0,5 1 1,5 2 2,5 3 3,5 4
0 0,2 0,4 0,6 0,8
Normal ized stress inten sity factor KIB
a/(R2-R1)
0,00 0,10 0,20 0,30 0,40 0,50 0,60 0,70 0,80 0,90 1,00
0 0,1 0,2 0,3 0,4 0,5 0,6 0,7 0,8
Normal ized stress inten sity factor KIIB
a/(R2-R1)
T.Tamine et al.: Evolution of stress intensity factors in mixed mode with presence of mismatch effect
100
Fig. 14. Evolution of normalized equivalent stress intensity factor at crack tip A
Fig. 15. Evolution of normalized equivalent stress intensity factor at crack tip B
For nclination angles between 0° and 85° (Figure 14), we notice that normalized equivalent SIF ̅ data are very small and present an overlap when the crack tip A grows in the material
with lower young modulus. For the case of crack tip B which is located in the material 2, the values of normalized equivalent stress intensity factors ̅ (Figure 15) are very high and their
evolution is on progress especially for crack lengths a/(R2-R1)≥0.4. When varies between 95°
0,00 0,50 1,00 1,50 2,00 2,50 3,00 3,50 4,00
0 0,1 0,2 0,3 0,4 0,5 0,6 0,7 0,8
Normal ized equ iva lent stress inten sity factor Keq A
a/(R2-R1)
0,00 0,50 1,00 1,50 2,00 2,50 3,00 3,50 4,00
0 0,2 0,4 0,6 0,8
Normal ized equ iva lent stress inten sity factor Keq B
a/(R2-R1)
Journal of the Serbian Society for Computational Mechanics / Vol. 6 / No. 2, 2012 101
and 165°, the crack tip A is located in the most stiffener material (aluminium) and ̅ values
are closeand quite small.
Also, it is very interesting to represent in Figure 16 and Figure 17 the evolution of the same stress intensity factors ̅ and ̅ with inclination angle
Fig. 16. Effect of interface angle on normalized equivalent stress intensity factor at crack tip
A
Fig. 17. Effect of interface angle on normalized equivalent stress intensity factor at crack tip
B 0 0,5 1 1,5 2 2,5 3 3,5 4
0 20 40 60 80 100 120 140 160 180
Normal ized equ iva lent stress inten sity factor Keq A (°) a/(R2-R1)=0.1 a/(R2-R1)=0.2 a/(R2-R1)=0.4 a/(R2-R1)=0.6 a/(R2-R1)=0.7 0 0,5 1 1,5 2 2,5 3 3,5 4
0 20 40 60 80 100 120 140 160 180
Normal ized equ iva lent stress inten sity factor Keq B (°) a/(R2-R1)=0.1 a/(R2-R1)=0.2 a/(R2-R1)=0.4 a/(R2-R1)=0.6 a/(R2-R1)=0.7
Material 1 Material 2
T.Tamine et al.: Evolution of stress intensity factors in mixed mode with presence of mismatch effect
102
Figures 16 and 17 show the both zones of crack tip evolution where the interface is marked by a
= 90°. For the case where is below 90° (Fig.16), the crack tip A is located in the material 1 and thestress intensity factor values ̅
are low and looks the same until is near 85° where the tendency to decrease is more significant.Near =90°, wenotice that ̅ increase due to the higher stiffness. This evolution is
even more significant with crack size a/(R2-R1). Figure 17 shows the opposite evolution for
crack tip B.This is due to fact where the crack tip is located inthe weakest material.
3.2.2. Influence of material properties on stress intensity factors
The influence of material properties on normalized stress intensity factorshas been study for
=75° and 120°, and material ratio E2/E1=2, 4 and 6 (see Fig.18-a and Fig18-b). For the case
where = 75°, the graphs seem very close for any material ratio.
When =120°, the crack tip A is located in the stiffer material, ̅ increases more
significantly as crack length ratio increase. The growth tendency has been presented in the paper of [Madani et al. 2007] for the case of bi-material plate with an edge crack in term of energy release rate variation with crack length and material ratio E2/E1.
Fig. 18-a. Evolution of normalized equivalent stress intensity factor with crack length and
material ratio E2/E1 for =75°
0,2 0,4 0,6 0,8 1 1,2 1,4
0 0,2 0,4 0,6 0,8
No
rmali
zed
equiva
le
nt
stress
intensity
fa
cto
r
KeqA
a/(R2-R1)
E2/E1=1 E2/E1=2 E2/E1=4
Journal of the Serbian Society for Computational Mechanics / Vol. 6 / No. 2, 2012 103
Fig. 18-b. Evolution of normalized equivalent stress intensity factor with cracklength and
material ratio E2/E1 for =120°
Finally it is interesting to study the variation of ̅ accordingto E2/E1 for different values of and for a fixed crack length a/(R2-R1)= 0.4 (Fig.19). In this Figure, the corresponding values
to have been calculated using Excel program based on node displacements obtained by finite element method and equations (1) to (9). The results show that some of thegraphs followa growthevolution when >90° and the crack tip A is located in the stiffermaterial. For 90°, the ̅ values decrease especially when =0°, =30° and =85° where the ̅ values are
very close.
0,2 0,4 0,6 0,8 1 1,2
0 0,2 0,4 0,6 0,8
No
rmali
zed
equiva
le
nt
stress
intensity
fa
cto
r
KeqA
a/(R2-R1)
E2/E1=1 E2/E1=2 E2/E1=4 E2/E1=6
T.Tamine et al.: Evolution of stress intensity factors in mixed mode with presence of mismatch effect
104
Fig. 19. Variation of normalized equivalent stress intensity factor at crack tip A with material
ratio E2/E1and for a/(R2-R1)=0.4
Most of the numerical results show that compression test on the cracked ring specimen formed by bi-material presents a continuity of normalized equivalent stress intensity factorsevolution in term of orientation angle, stiffness ratio and normalized crack length. Then, it is much easier to characterize the fracture strength of cracked interface.
The fracture toughness of a brittle biomaterial can be evaluate from Figure 19 according to Young‘s modulus ratio E2/E1 and inclinaison angle . Due to the fact that we are in elastic case,
fracture toughness is given by multiplying KeqA by the ratio Fc/Fcomp where Fc is the critical load
and Fcomp the computing load.
4. Conclusion
This study has extended the mismatch effect analyses for the mixed mode of fracture as the published results were only concerningthe case of opening mode. In this paper, it has been noticed that the mismatch effect can be present in the mixed mode of fracture for both cases such as: bi-material plates with inclined crack under tensile loading and bimaterialcracked ring specimen subjected to compression loading.
The results show that the mismatch effect depends on the crack length for bothopening mode and on the crack inclination angle i.e the bimodality crack loading. This effect is characterized by the tendency to decreaseof the equivalent SIF in mixed mode when the crack tip is located in the weakestmaterial. Hence, we confirm the results obtained by [Kazi Tani et al. 2009] and experimentally by [Cirello et al. 2006] whohaveused the same specimen in the first mode of fracturewith different width ratio.
In order to develop toughnesstests for cracked bi-materialspecimens, we have studied the mismatch effect by using a cracked bi-material ring. The choice of this specimen is based on the
0 0,2 0,4 0,6 0,8 1 1,2
1 2 3 4 5 6 7 8 9 10
Normal ized equ iva lent stress inten sity factor
KeqA
E2/E1
Journal of the Serbian Society for Computational Mechanics / Vol. 6 / No. 2, 2012 105
fact that its manufacture is easy and cheaper. Furthermore, its shape allows us to change the bimodality by a simple rotation ofthe interface to loading direction.
The results show that it can be easy to obtain specimen calibration function in order to determine the critical stress intensity factor. The low cost of the test specimen and the execution celerity can allow easily getting the intrinsic curve of the interface fracture for bi-material.
Nomenclature
K [MPa.m1/2]: Stress intensity factor.
K1 [MPa.m1/2]: Stress intensity factor for the first mode of fracture.
K2 [MPa.m1/2]: Stress intensity factor for the second mode of fracture.
Bi-elastic constant of material. : Young modulus of materialj. : Poisson ratio of materialj.
: Shear modulusof material j.
ui :Displacement of nodeiwith respect toxaxis. vi: Displacement of node i with respect toyaxis.
s:
distance
between nodes a and c or a and e.a [m]: Crack length.
W [m]: Plate wide.
[MPa.m1/2]: Equivalentstress intensity factor.
̅
[MPa.m1/2]: Normalized equivalent stress intensity factor.
̅
[MPa.m1/2]: Normalized equivalent stress intensity factor at crack tip A.
̅
[MPa.m1/2]: Normalized equivalent stress intensity factor at crack tip B.
R1[m]:Internal radius of cracked ring specimen.
R2[m]:External radius of cracked ring specimen.
g [MPa]: Global applied stress
g1 [MPa] , g2 [MPa]: are respectively the applied stress in y direction for material 1 and 2
[°]:Inclination angle of interface with respect tox axis.
[°]:Inclination angle of the crack with respect tox axis.
SIF: Stress Intensity Factor
RGB: Red Green Blue
T.Tamine et al.: Evolution of stress intensity factors in mixed mode with presence of mismatch effect
106
Извод
Еволуција фактора јачине напона у мешовитом режиму уз присуство
ефекта неподударања
T.Tamine1a, N.Kazi Tani2, G.Pluvinage3
1
Laboratoire LCGE, Faculté de Génie Mécanique, USTO M.B , 1505 EL M‘NAOUER 31000 Oran, Algérie
a
Corresponding author : [email protected]
2
Laboratoire LM2SC, Faculté d‘Architecture et de Génie Civil, USTO M.B, 1505 El M‘NAOUER 31000 Oran, Algérie
3Fiabilité Mécanique Conseil. Silly sur Nied 57530 France
Резиме
У овој студији, нумерички модели засновани на методи коначних елемената су развијени за неколико примена механике лома. Употреба узорка са прслином формираног од различитих материјала је омогућила анализу ефекта положаја прслине разумевање неподударања ефекта за случај мешовитог режима лома. Са друге стране, веома је занимљиво анализирати ефекат положаја интерфејса и оптерећења за случај прстенасте симетричне узорка са прслином под притиском.
Кључне речи: Пукотина, интерфејс, би-материјал, мешовити режим,фактори јачине
напона,ефекат неподударања
References
A. Cirello, B. Zuccarello, On the effects of a crack propagating towards the interface of a bimaterial system, Journal of Engineering Fracture Mechanics 73 (2006), 1264-1277. C. Bjerken, C. Persson, A numerical method for calculating stress intensity factors for interface
cracks in bimaterials, Engineering Fracture Mechanics 68 (2001), 235-246.
C.L. Tan, Y.L. Gao, Treatment of bi-material interface crack problems using the boundary element method, Engineering Fracture Mechanics 36,(1990), 919-932.
Comninou, M. "The interface crack." Journal of Applied Mechanics 44: (1977), 631-636. D. Ouinas, B.B. Bouiadjra , B. Sereir, J. Vina, Influence of bi-material interface on kinking
behavior of a crack growth emanating from notch, Computational Materials Science 41 (2008), 508-514.
Dundurs, J. "Discussion of edge bonded dissimilar orthogonal elastic wedges under normal and shear loading." Journal of Applied Mechanics 36: (1977), 650-652.
Journal of the Serbian Society for Computational Mechanics / Vol. 6 / No. 2, 2012 107
E. Madenci, I. Guven, The finite element method and applications in engineering Using ANSYS, Springer Edition (2006).
Erdogan, F."Stress distribution in a non homogeneous elastic plane with cracks", J. Appl. Mech., vol. 30, (1963),232-237.
F.Jiang, Z.L. Deng, J.F. Wel, Crack propagation resistance along strength mismatched bimetallic interface, Journal of Materials Engineering and Performance, 13, N°1 (2004),93-98.
J.R. Rice, Elastic fracture mechanics concepts for interface crack. Journal of Applied Mechanics 55 (1988), 98-103.
K. Madani, M. Belhouari, B. B. Bouiadjra, B.,Sereir, M. Benguediab, Crack deflection at an interface of alumina/metal joint: A numerical analysis, Computational Materials Science 38 (2007), 625-630.
K. Yilan, L. Hua, Investigation of near tip displacement fields of a crack normal to and terminating at a bimaterial interface under mixed mode loading, Engineering Fracture Mechanics 69 (2002), 2199-2208.
M. L. Williams, ―The stresses around a fault or crack in dissimilar media‖, Bull. Seismological Sot. America 49, (1959), 199-404.
Media," ASME Journal of AppliedMechanics, Vol. 32, 418-423.
N. Kazi Tani, T. Tamine, G. Pluvinage, Numerical evaluation of energy release rate for several crack orientation and position to the bi-material interface plates, Damage and fracture Mechanics, Failure Analysis of Engineering Materials and Structures , Springer (2009), 445-454.
P.R. Marur, H.V. Tippur, A strain gage method for determination of fracture parameters in bi-material systems, Engineering Fracture Mechanics 64 (1999), 87-104.
R.E. Peterson, Stress concentration factor, John Wiley and Sons, New York, 1974. Rice, J. R., and Sih, G. C , 1965, "Plane Problems of Cracks in Dissimilar
T. Ikeda, C.T. Sun, Stress intensity factor analysis for an interface crack between dissimilar isotropic materials under thermal stress, International Journal of Fracture 111 (2001), 229-249.
![Fig. 3-b. Evolution of normalised stress intensity factor in mode I (=0°) [15]](https://thumb-us.123doks.com/thumbv2/123dok_us/8371177.1675239/6.499.74.409.112.422/fig-evolution-normalised-stress-intensity-factor-mode-i.webp)