DOI: http://dx.doi.org/10.20896/saci.v% vi% i.258
© 2017 Bhattacharyya. This is an Open Access article distributed under the terms of the Creative Commons Attribution License (http://creativecommons.org/licenses/by/2.0), which per mits unrestricted use, distribution, and reproduction in any medium, provided the original work is properly cited.
EDITORIAL
OPEN ACCESS
India Rising
Dr. Rituparna Bhattacharyya†
India is progressing rapidly today: PM Modi
-When bureaucracy is vibrant and in tune with the decision-making bodies, only then it can take the right steps. -When there is public participation, only then there can be transformation. India is progressing rapidly today (Bawa, 2017, 2 June).
The above statements are parts of the speech delivered by India’s Prime Minister Mr. Narendra Damodar Modi at the plenary session, International Economic Forum, 2017 on 2 June 2017 at St. Petersburgh, Russia. Holding hands and walking together with President Vladimir Putin to address the plenary session, Mr. Modi expressed his gratitude to Russia for sustaining a strong 70-year bond, while acknowledging the unconditional support India has been receiving in fighting cross-border
terrorism.1 From the statements above, can
we assume— India is really rising! If so, how do we take this ‘rising’ notion on board? While doubts prevail around this metaphoric ‘India Rising’ the West seems to acknowledge Mr. Modi’s confidence, determination, and power of governance. Pulla (2017) uses Antonio Gramsci's notion of 'counter hegemony' to describe Mr. Modi and his new India vision. He explains, “Modi’s counter hegemony [has] awakened the marginalised and the religious minorities’ alike [in] offering equality of
†
Independent Researcher, Editor-in-Chief, Space and Culture, India and Training and Development, Alliance for Community Capacity Building in North East India , Email: [email protected]
1
PM Narendra Modi at SPIEF: ‘Opportunities in every sector, sky is the limit in India’ (2017, 2 June). The Indian Express, Retrieved from,
http://indianexpress.com/article/india/narendra -modi-
vladimir-putin-india-russia-summit-4686028/?utm_source=izooto&utm_medium=push_notif ication&utm_campaign=browser_push&utm_content=& utm_term=
opportunity and a promise of access and equity” (Pulla, 2017:1).
Mr. Modi is perhaps, the first Prime Minister in the history of India, who after assuming office in May 2014 has visited the largest number of foreign countries (until now) to strengthen ties with the respective countries (in areas of regional, bilateral, and international issues of mutual interests, including the road to augment energy and trade) and promote his ambitious pet and passion project —Make in India. Formally launched on 25 September 2014, Make in India aims to build India a manufacturing hub under the mission — Manufacture in India and sell the products worldwide. Central to Make in India campaign is ‘skill development’ and ‘creation of jobs’ through mobilisation of the ‘youth power’. Under the seven pillars (new processes, new research and development, new design, new mind-set, new innovation and new sectors), Make in India initiative aims to boost the ease of doing business in India. In doing so, it aims to grease the wheels for investment, proselytise innovation, safeguard intellectual property rights, and construct world-class manufacturing infrastructure, through which the country will become a part of the global supply chain system. In addition, over the next decade, Make in India aims to generate 100-million jobs
and escalate manufacturing up to
approximately 25 per cent of the country’s Gross Domestic Product (GDP). In his speech at St. Petersburg, Mr. Modi delivered his 1100 days of report card, where he stressed his government’s political will to bring in reforms and that his government is working towards long-term accomplishments rather than short-term gains—that his government has already
revoked 1200 outdated policies and
legislations2 and brought about 7000 reforms
2
just by the federal government. With these reforms, within a very short span, the country has become the top FDI (Foreign Direct Investment) destinations of the world. Table 1 is a witness to this. Even though there was 5 per cent diminution in global FDI inflows, for India, FDI grew at 36 per cent in H1 2016-17 over H1 2015-16. Moreover, on 20 January 2017, the foreign exchange reserves reached $361 billion.
Table1: Top Five Foreign Direct Investment Destinations, H1 2015
Country Capex ($bn)
India 36*
China 28
USA 27
UK 16
Mexico 14
Note: * (H1 2016-2017)
Sources: FDI Markets.com: Crossborder Investment Monitor; Key Features of Budget 2017-2018, retrieved from,
http://indiabudget.nic.in/ub2017-18/bh/bh1.pdf
Undoubtedly, India is emerging as the youngest nations in the world by 2020. A report titled ‘State of the Urban Youth, India 2012: Employment, Livelihoods, Skills published by IRIS Knowledge Foundation in collaboration with UN-HABITAT suggests that in 2011, the population in the age-group of 15-34 rose to 430 million from 353 million in 2001. It is estimated that by 2021, this youth population would increase to 464 million and by 2026; it would decline to 458 million. In other words, by 2020, 64 per cent of its population will be in the working age group (Shivkumar, 2013). In the said context, Mr. Modi added:
In India, we are nurturing an eco-system where the youth of India becomes a job
creator, not job seeker.3
that Ms Irom Chanu Sharmila was in hunger strike for 16 long years, when she finally elected to withdraw her protest in August 2016 as AFSPA continues to be immovable.
3
PM Narendra Modi at SPIEF: ‘Opportunities in every sector, sky is the limit in India’ (2017, 2 June). The Indian
Express, Retrieved from,
http://indianexpress.com/article/india/narendra -modi-
vladimir-putin-india-russia-summit-Reinforcing the country’s potentiality and talent pool, Mr. Modi cited the example of the
most successful maiden and cheapest
Mangalyaan (Mars Orbiter Mission) sent on September 2014. Budgeted at ₹4.5bn ($74m), this mission was accounted to be the cheapest when compared to the making of even Bollywood and Hollywood films like Ra.One and Gravity (Amos, 2014). Earlier in 2014, just after the Mars mission gained accomplishment in its first attempt, Mr. Modi said:
A one-km auto rickshaw ride in Ahmedabad takes Rs 10 and India reached Mars at Rs 7 per km, which is
really amazing!4
Again coinciding with the World Environment Day (that is, on 5 June 2017), India scripted history with the successful launch of 43.43-metre-tall, 600-tonne, powered by indigenous high thrust Geosynchronous Satellite Launch vehicle carrying 3,163 kg GSAT-19 satellite into its precise orbit. Similarly, on 5 May 2017, India launched its South Asia Satellite or GSAT-9 aimed at building better communications with its South Asian nations. Earlier on 28 April 2016, the country ushered in a new era of communication by launching its unique Indian Regional Navigation Satellite System (IRNSS) called NAVIC. All these successfully added feathers on its cap clearly signal that India is gradually marching towards self-sufficiency in
digital economy—a game changer in
communications.
Returning to the prima facie of the ‘rising’ notion, embedded in sophisticated theoretical languages, there is a large literature portraying India as a rising power and its emerging
political influence across the globe
(Rothermund, 2009; Narlikar, 2013; Sinha and Dorschner, 2010). The following examples further reinforce the rising narrative. First, the estimated 2016 GDP is $2.251 trillion, which 4686028/?utm_source=izooto&utm_medium=push_notif ication&utm_campaign=browser_push&utm_content=& utm_term=
4
has grown at a rate of 7.6 per cent,5 whereas, the Gross National Saving of the country stood at 30.2 per cent in the same year. One has to acknowledge that the country has been able to regain this growth after years of global economic uncertainty. Of course, the credit
rating agencies like the World Bank,
International Monetary Fund, etc. have
recognised India’s position within the fastest growing economies of the world. Second, the
country’s current account deficit has
plummeted from approximately 1 per cent of GDP in 2015 to 0.3 percent of GDP in the first
half of 2016-17.6 Third, it is now the world’s
fourth largest economy in terms of GDP purchasing power parity, which as per 2016 estimation, stands at $8.721 trillion. However, towards the fourth quarter of the 2016-17 fiscal year, GDP growth dwindled to 6.1 per cent, which according to the Finance Minister, Arun Jaitley is attributed to the demonetisation kindled by cash shortages, disruption of
payments.7,8 The economy however, is far more
complex, and there could be several other
factors linked to slow growth. 9
Indeed, India’s presence in world affairs began to be felt since July 2005 after the former President of the USA, George W Bush signed a nuclear arsenal with India. In his flamboyant
authoritative 18 thematic vignettes, India: The
5
South Asia: India, The World Factbook, retrieved from, https://www.cia.gov/library/publications/the-world-factbook/geos/in.html
6
Key Features of Budget 2017-2018, retrieved from, http://indiabudget.nic.in/ub2017-18/bh/bh1.pdf
7
In November 2016, the Government of India (GOI) launched a large-scale action to demonetise ₹500 and ₹1000 denominations aimed at tackling corruptions, fake-currency circulation, and terror finance control (Pulla, 2016).Only time will speak to what extent demonetisation would be successful in transforming corruption and crony capitalism into transparency.
8
Several factors responsible for decline in GDP growth: Arun Jaitley, retrieved from,
http://economictimes.indiatimes.com/articleshow/5894 4047.cms?utm_source=contentofinterest&utm_medium =text&utm_campaign=cppst
9
World Economic Outlook (WEO) Update: A Shifting Global Economic Landscape (January 2017), International Monetary Fund, retrieved from,
https://www.imf.org/external/pubs/ft/weo/2017/update /01/
Rise of an Asian Giant, Rothermund (2009) sketches the macro-history of India since its independence within the context of domestic politics, foreign security and economic policy,
emerging and declining industries,
demography, and culture, which aims at understanding the contemporary situation. In so doing, he outlined that India had grown rapidly because of economic liberalisation championed by GOI in the late 1980s (Narlikar, 2013; Sinha and Dorschner, 2010; also, Bhattacharyya, 2009; 2013). This paved the road to India’s assertiveness in the global
market. However, the country’s robust
economic growth has failed to transform into
development per se, especially rural
development. Colossal challenges remain as evident from the grotesque findings of the Socio Economic and Caste Census (SECC) published in July 2015, signalling that the rhetoric of India as a rising power is more of a political hype.
In May 2011, the Union Cabinet of India approved the Below Poverty Line (BPL) and the Caste Census exercise to be conducted under the umbrella of the Ministry of Rural Development (MORD), GOI. This clearly signals that the period of conducting the SECC was different from 2011 Census. Accordingly, the survey was conducted across 244.9 million households (rural and urban). Central to this survey was to better understand households on the basis of socio-economic and caste status and was conducted to retrieve information about— occupation, education, disability, religion, Scheduled Caste (SC)/Scheduled Tribe (ST) status, name of caste/tribe, employment, income and source of income, assets, housing, consumer durables and non-durables and land. The households were divided into three categories based on indicators mentioned in the parentheses. They are:
1. Automatically Excluded (motorised
2/3/4 wheeler/fishing boat; mechanised ¾ wheeler agricultural equipment; Kisan Credit Card - credit limit ₹ 50,000 +;
household member government
government; any member of household earning more than ₹10,000 per month; paying income tax; paying professional tax; three or more rooms with pucca walls and roof; owns a refrigerator; owns landline phone; owns more than 2.5 acres of irrigated land with one irrigation equipment; five acres or more of irrigated land for two or more crop seasons; owning at least 7.5 acres of land or more with at least one irrigation equipment).
2. Automatically Included (households
without shelter; destitute/living on alms; manual scavengers; primitive tribal groups and legally released bonded labours).
3. Deprivation (households with only one
room, kucha walls and kucha roof; no
adult members aged 16-59; female headed households with no adult male member between 16-59; households with disabled member and no able bodied member; SC/ST households; households with no literate adult above 25 years; landless households deriving a major part of their income from manual casual labour).
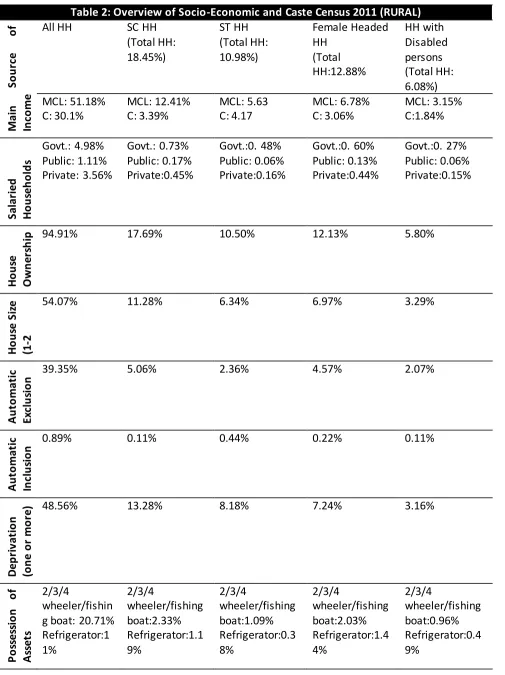
This is not the first caste based census of the country however. The first caste census was enumerated in 1881 during the British period across the whole country and since then, it was counted every 10 years until 1931. At the time of independence, the country recorded 55 per cent of the population living below poverty line. Amidst criticisms, SECC (2011) unravelled staggering statistics— 53.7 million (29.97%) households in rural areas are landless earning their everyday income working as manual labour, albeit 106.9 million households fall under deprived category. It should be noted here that there are 179.1 million households in rural areas, but only 4.57% pays income tax. Table 2 portrays an overview of the findings of the survey.
A meticulous analysis of the data reveals that in approximately 75 per cent rural households, the annual earning of the key family member is approximately ₹ 60,000 (< ₹ 5000 per month);
further revealing that only in eight per cent households, the monthly income of the main earning member exceeds ₹10,000. Appalling evidence suggests that it is the rural areas of the country’s eastern regions, which suffer most when compared to other parts.
Evidently, 35.7 per cent of 884 million people of rural India are illiterate. Surprisingly, this is 32 per cent higher when compared to the data recorded by 2011 Census. 17.78 per cent people have completed up to primary level; 13.97 per cent reading up to below primary level follow this. Percentage of people completing middle school in rural India stands at 13.5. While only 9.6 per cent of the population have completed secondary level of education, the percentage of population completing higher secondary and graduate or higher level of education (and others) stand respectively at 5.41 per cent and 3.99 per cent. It is apparent from Table 2 that of the total rural households, 12.88 per cent households are female-headed, majority of whom earn their daily living either as manual casual labourers or as cultivators, with very few working in salaried jobs. 7.24 per cent households live in some forms of deprivation, while 8.21 per cent households are landless. Clearly, these statistics signal that it is these female-headed households, who bear the burden of rising levels of poverty, which can perhaps, be termed as the feminisation of
poverty10 (see, Chant, 2006; 2008; also
Bhattacharyya, 2017).
10
Table 2: Overview of Socio-Economic and Caste Census 2011 (RURAL) M ai n So u rc e o f In co me
All HH SC HH
(Total HH: 18.45%) ST HH (Total HH: 10.98%) Female Headed HH (Total HH:12.88% HH with Disabled persons (Total HH: 6.08%) MCL: 51.18% C: 30.1% MCL: 12.41% C: 3.39% MCL: 5.63 C: 4.17 MCL: 6.78% C: 3.06% MCL: 3.15% C:1.84% Sa la ri e d H o u se h o ld s Govt.: 4.98% Public: 1.11% Private: 3.56% Govt.: 0.73% Public: 0.17% Private:0.45% Govt.:0. 48% Public: 0.06% Private:0.16% Govt.:0. 60% Public: 0.13% Private:0.44% Govt.:0. 27% Public: 0.06% Private:0.15% H o u se O w n e rs h
ip 94.91% 17.69% 10.50% 12.13% 5.80%
H o u se S iz e (1 -2 d w e lli n g )
54.07% 11.28% 6.34% 6.97% 3.29%
A u to ma ti c Ex cl u si o
n 39.35% 5.06% 2.36% 4.57% 2.07%
A u to ma ti c In cl u si o
n 0.89% 0.11% 0.44% 0.22% 0.11%
D e p ri va ti o n (o n e o r mo re
) 48.56% 13.28% 8.18% 7.24% 3.16%
P
ay
in
g
In
co
me
Ta
x/
P
ro
fe
ss
io
n
al
T
ax
4.57% 0.64% 0.37% 0.52% 0.24%
La
n
d
le
ss
H
o
u
se
h
o
ld
s 56.41% 12.98% 5.47% 8.21% 3.22%
Household=HH, Manual Casual Labour=MCL, Cultivation=C, Govt.=Government
Source: Socio Economic and Caste Census 2011, retrieved from, http://secc.gov.in/welcome
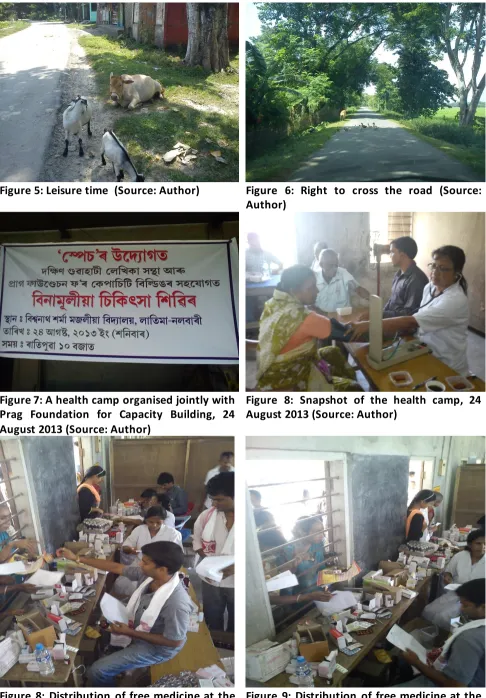
Figure 1: Paddy fields of Latima Village, Nalbari District, Assam (Source: Author)
Figure 2: Bamboo Fenced Fields of Latima Village, Nalbari District, Assam (Source: Author)
Figure 3: Equal opportunity to move freely on the public road (Source: Author)
Figure 4: A woman (in her traditional attire:
Figure 5: Leisure time (Source: Author) Figure 6: Right to cross the road (Source: Author)
Figure 7: A health camp organised jointly with Prag Foundation for Capacity Building, 24 August 2013 (Source: Author)
Figure 8: Snapshot of the health camp, 24 August 2013 (Source: Author)
Figure 8: Distribution of free medicine at the health camp, 24 August 2013 (Source: Author)
Majority of the rural population are multi-dimensionally poor (Table 2). Figures 1-8 illustrates the feeling of a rural landscape of India. These pictures were taken on 24 August 2013 at Latima, a remote village located in the Nalbari District of Assam on the occasion of the Health Camp organised co-jointly by Prag Foundation for Capacity Building (a sister organisation of Alliance for Community Capacity Building in North East India) with
Space and Dakhin Guwahati Lekhika Sanstha
(please refer to the banner, Figure 7).
Arguably, varied populist schemes (such as Mahatma Gandhi National Rural Employment Guarantee Act, National Rural Livelihood Mission, etc.) under the parasol of social welfare programmes have failed in many areas due to rampant corruption, lack of funds or both. The Economic Survey, 2016-2017 depicts that those "districts accounting for the poorest 40% receive 29% of the total funding" (xii). Prior to his demonetisation drive, Mr. Modi launched the Pradhan Mantri Jan-Dhan
Yojana,11 a mission to make the poorest of the
poor the beneficiaries of financial inclusion via
affordable banking, remittance, credit,
insurance, and pension schemes. The number of accounts opened under this yojana as on 25-05-2016 is as follows:
Public Sector Banks (rural—96345344,
urban—75988933)
Regional Rural Banks (rural—33362156,
urban—5480446)
Private Banks (rural—5014006, urban—
3101415)
Pulla (2017: 4) advocates Mr. Modi as the “messiah (saviour) of the poor.” However, given the current scenario here and elsewhere, only time will speak to what extent the socio-economic status of the poor have been
improved. Nonetheless, in the post
demonetisation period and the GOI’s effort to foster digital economy, BHIM app was launched to make the country cashless. So far, only 12.5
11
Community data.gov.in, Government of India, retrieved from, https://community.data.gov.in/accounts -opened- under-pradhan-mantri-jan-dhan-yojana-pmjdy-upto-25-05-2016/
million people have adopted this app. Surprisingly, many villages have become e-powered and cashless, which literally means “all adults have bank accounts, use sms-based banking and plastic money while businesses use swipe machines for cashless transactions. Banks are also linking their Aadhaar cards to accounts
to ensure benefits gets transferred directly.”12
Chatonguri, a village located in Morigaon district of Assam, which is approximately 110 kms from Guwahati is one of the first cashless villages of the country, while Rangchapara, located in Goalpara district of the state is preparing for going cashless. Other cashless
villages of India are— Dhasai (Maharashtra),
Akodavra (Gujarat), Ibrahimpur (Telangana), Patsa Village of Bihta (Bihar), Bind Toli of Kurji (Bihar) and Basti of Maner (Bihar).
On 2nd October, 2014,13 Clean India or Swachh
Bharat Abhiyan was launched by Mr Modi, who aims to reach the remotest corners of the country through the means of cleanliness, rapid urbanisation and development of tourism and thereby, integrate the ‘strength’ of the nation in its ‘inclusive development’ nation-building
journey. Plunging on his mission of Swachh
Bharat in his address at St. Petersburgh on 02-06-2017, Mr. Modi stressed:
India is urbanising rapidly and this makes the need of infrastructure and waste management mechanisms even more important.
However, as the country stands now, 52.1 per cent of the rural population and 7.5 per cent of the urban population practice open defecation, albeit the GOI is working on measures such as promotion of better sanitation practices and
building toilets14 for complete eradication of
open defecation by 2019, and that too, on the
12
India’s cashless villages, Times of India, retrieved from, http://timesofindia.indiatimes.com/india/Indias-cashless-villages/articleshow/55874196.cms
13
India celebrates this day as Gandhi Jayanti, a national celebration to mark the birthday of the Father of the Nation, Mahatma Gandhi.
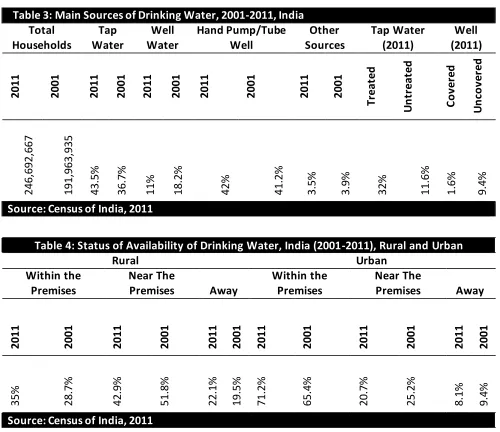
14
Table 3: Main Sources of Drinking Water, 2001-2011, India Total Households Tap Water Well Water Hand Pump/Tube Well Other Sources Tap Water (2011) Well (2011)
2011 2001 2011 2001 2011 2001 2011 2001 2011 2001
Tr e at e d U n tr e at e d C o ve re d U n co ve re d 2 4 6 ,6 9 2 ,6 6 7 1 9 1 ,9 6 3 ,9 3 5 4 3 .5 % 3 6 .7 % 11 % 1 8 .2 % 42 % 4 1 .2 % 3 .5 % 3 .9 % 32 % 1 1 .6 % 1 .6 % 9 .4 %
Source: Census of India, 2011
Table 4: Status of Availability of Drinking Water, India (2001-2011), Rural and Urban
Rural Urban
Within the Premises
Near The
Premises Away
Within the Premises
Near The
Premises Away
2011 2001 2011 2001 2011 2001 2011 2001 2011 2001 2011 2001
35 % 2 8 .7 % 4 2 .9 % 5 1 .8 % 2 2 .1 % 1 9 .5 % 7 1 .2 % 6 5 .4 % 2 0 .7 % 2 5 .2 % 8 .1 % 9 .4 %
Source: Census of India, 2011
150th anniversary of Gandhi Jayanti.15
Notwithstanding, no cities in India have access to 24X7 piped water supplies (Bhattacharya and Borah, 2014). Currently, 63 million people fail to access clean drinking water (Salve, 2017). The honourable Apex Court has recognised right to water as fundamental to life, however, not as a fundamental right. Tables 3 and 4 illustrate the state of drinking water in both rural and urban areas of India. Arguably, access to poor sanitation and contaminated water
bears detrimental effect on health
15
Swachhta Status Report, 2016, retrieved from, More Than 3 Crore Toilets Built So Far Under Swachh India Campaign, retrieved from,
http://swachhindia.ndtv.com/httpswachhindia -ndtv- com5-year-report-card-shows-massive-growth-indias-sanitation-coverage-6232-6232/
http://mospi.nic.in/sites/default/files/publication_report s/Swachhta_Status_Report%202016_17apr17.pdf
(Bhattacharyya, 2016b). Further, as per Census of India (2011), kerosene is used in 72,435,303 households as the key source of lighting, while 897,760 households have no access to any form
of lighting (Census of India, 2011;
Bhattacharyya, 2015). The GOI aims to facilitate and ameliorate the situation by 2022 (Bhattacharyya, 2014; 2015).
Indian people, arguably, no matter how poor they might be are much more resilient than the counterparts of the occidental world. This does not mean that they do not deserve a better quality of life.
challenges need to be confronted and tackled to translate into opportunities for further economic growth. Given, the nature of the country’s democracy, Mr. Modi, although a dynamic leader and an icon of good governance (Bhattacharyya, 2014; Pulla, 2016, 2017), might fail to remain as Prime Minister forever. Should his legacy of economic salvation continue, it is the people’s participation and passion, which remains paramount (see, Bawa, 2017).
The much-awaited implementation of national goods and services tax (GST) on 01 July 2017, would possibly unify the country’s tax regime, further simplifying the processes of global businesses to invest. However, with the
on-going BREXIT negotiations, minority
Conservative government of Mrs Teresa May and Donald Trump’s regime, India’s rising narrative might change and need to be debated rigorously.
References
Amos, Jonathan (2014, 24 September). Why India's Mars mission is so cheap - and
thrilling, BBC News, Science and
Environment, retrieved from, http://www.bbc.co.uk/news/science-environment-29341850
Bawa, Parmeshwar (2017, 2 June). PM Modi In Russia LIVE: PM Invites World Leaders To Invest In India, NDTV, retrieved from,
http://www.ndtv.com/india- news/prime-minister-narendra-modi-in- russia-live-pm-to-attend-india-russia-
summit-with-vladimir-putin-1706374?browserpush=true
Bhattacharya Prasanta and Borah Rajashree (2014). Drinking Water in Guwahati City: Its Past, Present Status and Associated Problems, Space and Culture, India, 1(3),
65-78, DOI:
http://dx.doi.org/10.20896/saci.v1i3.46 Bhattacharyya Rituparna (2017). Feminisation
of Poverty: A Global Phenomenon. In Baleshwar Thakur, H.S.Sharma, Suresh Mishra and S. Chattopadhyay (eds). Regional Development: Theory and Practice (In 5 Volumes), New Delhi:
Concept Publishing (ISBN:
9789351252023)
Bhattacharyya, Rituparna (2016a). Living with Armed Forces Special Powers Act
(AFSPA) as Everyday Life, GeoJournal,
1-18, DOI: 10.1007/s10708-016-9752-9 Bhattacharyya, Rituparna (2016b). An Account
of India’s under-5 Mortality Rate, International Journal of Social Work and Human Services Practice, 4(4), 82-88, DOI: 10.13189/ijrh.2016.040402
Bhattacharyya, Rituparna (2015). Working Childhoods: Youth, Agency and the
Environment in India. Progress in
Development Studies, 15(3), 292-294, DOI: 10.1177/1464993415578570
Bhattacharyya, Rituparna (2014). Good
Governance and Development
Mandate, Space and Culture, India, 2(1),
1-4, DOI: 10.20896/saci.v2i1.65
Bhattacharyya, Rituparna (2013). Are We Empowered? Stories of Young Indian Working Women. Saarbrücken,
Germany: Lap Lambert Academic
Publishing
Bhattacharyya, Rituparna and Polly Vauquline (2013). A Mirage or a Rural Life Line?: Analysing the Impact of Mahatma Gandhi Rural Employment Guarantee Act on Women Beneficiaries of Assam, Space and Culture, India, 1(1), 83-101, DOI:
http://dx.doi.org/10.20896/saci.v1i1.10 Bhattacharyya, Rituparna, Polly Vauquline and
Suman Singh (2011). Towards a Socially Sustainable India: An Analysis of National Rural Employment Guarantee Scheme, 2006. In S.K. Singh, Raj Kumar, H.P. Mathur, N.B. Singh and V.K. Kumra (eds). Energy Resources, Alternative Search and Sustainable Development, New Delhi: Shree Publishers, 73-88 Bhattacharyya, Rituparna (2009). Examining the
the Lives of University Students, PhD thesis, Newcastle University, UK
Census of India (2011). Houselisting and Housing Census Data Highlights - 2011,
Ministry of Home Affairs, Government
of India, retrieved from, http://censusindia.gov.in/2011census/h lo/hlo_highlights.html
Chant, Sylvia (2006). Re-thinking the
‘Feminization of Poverty’ in Relation to
Aggregate Gender Indices. Journal of
Human Development, 7(2), 201-20
Chant, Sylvia (2008). Beyond Incomes: A New Take on the ‘Feminisation of Poverty’, Poverty in Focus: Gender Equality, International Poverty Centre, retrieved
from,
http://www.undp-povertycentre.org/pub/IPCPovertyInFoc us13.pdf, June, 10, 2010
Economic Survey (2016-17). Government of
India, Ministry of Finance, Department of Economic Affairs, retrieved from,
http://indiabudget.nic.in/es2016-17/echapter.pdf
Key to the Budget Documents, 2017-2018, Government of India, retrieved from,
http://indiabudget.nic.in/ub2017-18/keybud/keybud2017.pdf
Narlikar, Amrita (2013). India Rising:
Responsible to Whom?, International
Affairs, 89 (3), 595-614, DOI:
10.1111/1468-2346.12035
Pulla, Venkat (2017). Gramscian ‘Counter hegemony’ in Narendra Modi’s New
India Perspective, Space and Culture,
India, 4(3), 1-6, DOI: http://dx.doi.org/10.20896/saci.v4i3.24 7
Pulla, Venkat (2016). Unprecedented Move, Space and Culture, India, 4(2), 1-2, DOI: http://dx.doi.org/10.20896/saci.v4i2.22 1
Rothermund, Dietmar (2009). India: The Rise of
an Asian Giant, New Haven: Yale University Press
Salve, Prachi (2017, 21 March). 63 million Indians do not have access to clean
drinking water, Hindustan Times,
retrieved from,
http://www.hindustantimes.com/india- news/6-3-crore-indians-do-not-have- access-to-clean-drinking-water/story-dWIEyP962FnM8Mturbc52N.html
Socio Economic and Caste Census (2011).
retrieved from,
http://secc.gov.in/welcome
Sinha, Aseema and Jon P. Dorschner (2010). India: Rising Power or a Mere Revolution of Rising Expectations, Polity, 2010 Northeastern Political Science
Association 0032-3497/10,
www.palgrave-journals.com/polity/, 42(1), 74-98