Race and Acute Abdominal Pain in a Pediatric
Emergency Department
WHAT’S KNOWN ON THIS SUBJECT:Abdominal pain is a frequent complaint in pediatric emergency departments, with a broad differential diagnosis. The impact of demographic and clinical characteristics of patients on the evaluation and management of these children is not well known.
WHAT THIS STUDY ADDS: The most common cause of abdominal pain is constipation, which rarely requires hospital admission. Demographic factors, in particular race, do not seem to affect evaluation and management.
abstract
OBJECTIVE: To investigate the demographic and clinical factors of children who present to the pediatric emergency department (ED) with abdominal pain and their outcomes.
METHODS:A review of the electronic medical record of patients 1 to 18 years old, who presented to the Children’s Hospital of Pittsburgh ED with a complaint of abdominal pain over the course of 2 years, was conducted. Demographic and clinical characteristics, as well as visit outcomes, were reviewed. Subjects were grouped by age, race, and gender. Results of evaluation, treatment, and clinical outcomes were compared between groups by using multivariate analysis and recur-sive partitioning.
RESULTS:There were 9424 patient visits during the study period that met inclusion and exclusion criteria. Female gender comprised 61% of African American children compared with 52% of white children. In-surance was characterized as private for 75% of white and 37% of African American children. A diagnosis of appendicitis was present in 1.9% of African American children and 5.1% of white children. Older children were more likely to be admitted and have an operation associated with their ED visit. Appendicitis was uncommon in younger children. Constipation was commonly diagnosed. Multivariate analysis by diagnosis as well as recursive partitioning analysis did not reflect any racial differences in evaluation, treatment, or outcome.
CONCLUSIONS:Constipation is the most common diagnosis in children presenting with abdominal pain. Our data demonstrate that no racial differences exist in the evaluation, treatment, and disposition of chil-dren with abdominal pain.Pediatrics2013;131:1098–1106
AUTHORS:Kerry Caperell, MD,aRaymond Pitetti, MD,
MPH,band Keith P. Cross, MD, MSca
aDepartment of Pediatrics, University of Louisville, Louisville,
Kentucky; andbDepartment of Pediatrics, University of
Pittsburgh, Pittsburgh, Pennsylvania
KEY WORDS
abdominal pain, emergency medicine, racial differences, racial disparities, epidemiology
ABBREVIATIONS
CI—confidence interval CT—computed tomography ED—emergency department EMR—electronic medical record IV—intravenous
OR—odds ratio
Dr Caperell conceptualized and designed the study, carried out the analyses, drafted the initial manuscript, and revised the manuscript; Dr Pitetti guided the study design and the initial analyses, and reviewed and revised the manuscript; Dr Cross performed the recursive partitioning portion of the analysis, and reviewed and revised the manuscript; and all authors approved thefinal manuscript as submitted.
www.pediatrics.org/cgi/doi/10.1542/peds.2012-3672 doi:10.1542/peds.2012-3672
Accepted for publication Mar 11, 2013
Address correspondence to Kerry Caperell, MD, Division of Pediatric Emergency Medicine, University of Louisville, 571 S Floyd St, Suite 300, Louisville, KY 40059.
E-mail: kerry.caperell@louisville.edu
PEDIATRICS (ISSN Numbers: Print, 0031-4005; Online, 1098-4275). Copyright © 2013 by the American Academy of Pediatrics
FINANCIAL DISCLOSURE:The authors have indicated they have nofinancial relationships relevant to this article to disclose.
Abdominal pain is a common problem in the community and a frequent chief complaint in the pediatric emergency department (ED) with an extensive dif-ferential diagnosis that spans the entire spectrum of disease severity.1
Conse-quently, the evaluation and outcomes for these children vary widely. For ex-ample, a 12-year-old girl with right lower quadrant abdominal pain could be suffering from a surgical problem like acute appendicitis or ovarian tor-sion. Or, she could have a nonsurgical, non–life-threatening disease like con-stipation or mesenteric adenitis. Dif-ferences in the prevalence of some diseases based on age, gender, and race further complicate the picture.2
Consequently, pediatric EDs expend a large number of resources in the evaluation and management of chil-dren presenting with abdominal pain.
We sought to define the demographic characteristics, along with visit out-comes, of children with abdominal pain presenting to our ED. We speculated that these characteristics would affect the evaluation and management of these children, as well as their ultimate outcome, and sought to describe this relationship.
METHODS
A retrospective review of the electronic medical record (EMR) of patients who presented to the Children’s Hospital of Pittsburgh ED with a chief complaint of abdominal pain listed in the EMR be-tween January 1, 2008, and June 30, 2010, was conducted. Children’s Hos-pital of Pittsburgh is an urban, tertiary care center with an annual ED volume of .70 000 patients. Children older than 1 year and younger than 18 years were included.
The following data were gathered: age, gender, race, type of insurance, month of visit, day of week of visit,final diagnosis (both ED and, for admitted patients, dis-charge), whether the patient had an
operation during the visit, treatments administered, radiology tests performed, and final disposition (admit to acute care floor, admit to PICU, discharge, or death). For analysis purposes, sub-jects were divided into 3 groups based on race: white, African American, and other. In our institution, race is assigned by the registration clerk in consultation with family members. This information was taken directly from the EMR. Race information was entered by registra-tion personnel at the time of ED check in.
Fever was defined as a recorded tem-perature in the ED of 38.5°C or greater. Rectal, axillary, and oral temperatures are all used at our institution based on the child’s age and development. Chil-dren with no temperature recorded were assumed to be afebrile.
Diagnoses were based on recorded ED and hospital discharge diagnoses. For subjects with multiple diagnoses listed, a single diagnosis was assigned to each subject based on the following priority: (1) appendicitis, (2) renal calculus, (3) urinary tract infection, (4) constipation, (5) gastroenteritis, (6) abdominal pain, and (7) other. For study purposes, these diagnoses were mutually exclusive; each subject could have only 1 diagnosis for a particular visit.
The data were analyzed to ascertain the impact of race on the evaluation and management of abdominal pain. To determine this, modeling was per-formed by using race as the dependent variable. Predictor variables included the following: imaging study performed (computed tomography [CT] scan, ul-trasound, and x-ray), therapy received (narcotics, ketorolac, antiemetics, in-travenous [IV]fluids, and enemas), dis-position, whether the child had surgery performed, andfinal diagnosis. Recur-sive partitioning was performed by using these same factors.
Statistics were calculated by using SPSS Statistics version 18 (IBM SPSS Statistics, IBM Corporation, Chicago, IL).
Data were analyzed by usingx2, con-tingency tables, Student’s t test, and 1-way analysis of variance as appro-priate. Modeling was performed by using backward-stepping binary logis-tic regression. Recursive partitioning was performed by using CART Salford Predictive Miner v6.6 (Salford Systems, San Diego, CA). This activity was ap-proved by the University of Pittsburgh Institutional Review Board. Informed consent was waived by the Institutional Review Board and patient data were de-identified by an honest broker be-fore being made available to the investigators.
RESULTS
During the study period, there were 10 121 patient visits to the ED for ab-dominal pain representing 6.2% of 164 083 overall patient encounters. Of these, 128 were of children,1 year old and 569 were of children .18 years old. These visits were excluded, leaving 9424 subject visits for analysis. Of these visits, 5493 had multiple diagnoses listed. The leading diagnosis was se-lected by using the rank order we established. The races of children in the“other” category are summarized in Supplemental Table 10.
Demographic data are summarized in Table 1. Notably, there were differences in mean age, gender, and type of in-surance across the 3 race categories. African American children in the study tended to be slightly older, were more likely to be female, more likely to have public insurance, and less likely to be febrile.
Univariate Analysis
children. African American children were also less likely to receive IVfluids, narcotics, and antiemetics. Addition-ally, African American children were less likely to be admitted to the hospital and/or have an operation connected with their ED encounter.
Overall, appendicitis accounted for 4.3% of patient visits for abdominal pain. The diagnosis was more commonly seen in white children (5.1%) as compared with African American children (1.9%) with abdominal pain (P, .001, odds ratio [OR] 0.35, 95% confidence interval [CI]
0.25–0.50). A diagnosis of constipation (P = .002, OR 1.25, 95% CI 1.10–1.41), gastroenteritis (P,.001, OR 1.60, 95% CI 1.31–1.95), or urinary tract infection (P= .018, OR 1.44, 95% CI 1.10–1.87) was more common in African Americans.
Subanalysis was performed for 4 of the diagnoses: appendicitis, constipation, abdominal pain, and other. The results of univariate analysis are shown in Tables 3, 4, 5, and 6, respectively. For subjects diagnosed with appendicitis, there were no differences in interventions and outcomes between the races. For
subjects diagnosed with constipation, African American children were less likely to have a CT scan (OR 0.10, 95% CI 0.01–0.74) or ultrasound (OR 0.53, 95% CI 0.34–0.86) and to receive IV fluids (OR 0.50, 95% CI 0.35–0.70) as com-pared with white children. However, the differences in rates of CT scan and ultrasound were not significant on multivariate analysis. The differences in IV fluid administration remained (adjusted OR 0.50, 95% CI 0.35–0.70).
In subjects diagnosed with undiff-erentiated abdominal pain, African American children were less likely to have a CT scan performed as com-pared with white children. Addition-ally, they were less likely to receive narcotics, antiemetics, and IVfluids. Moreover, African American children were less likely to be admitted to the hospital and to have surgery per-formed (Table 6).
Multivariate Analysis
Table 7 displays ORs with 95% CIs for the univariate factors as well as for binary logistic regression models that attempt to adjust for potential con-founders. In the adjusted model, there was no longer a significant difference in the administration of an antiemetic. Moreover, African American children were actually more likely to receive ketorolac and have an abdominal x-ray performed. However, for all other fac-tors (rates of CT scan, ultrasound, IV
fluid administration, narcotic admin-istration, admission, and operation), the modeling did not completely ac-count for the racial differences.
For children diagnosed with undiffer-entiated abdominal pain, the difference in IV fluid and narcotic administra-tion seen on univariate analysis remained, with African American chil-dren only two-thirds as likely as white children to receive either (Table 8). However, because African American children were more likely to receive
TABLE 1 Clinical and Demographic Characteristics of Study Participants by Race
Total Sample (n= 9424)
White (n= 7065)
African American (n= 1926)
Other (n= 433)
P
Mean age, mo (SD) 124.7 (54.5) 125.1 (53.6) 126.7 (57.6) 109.0 (52.4) ,.001 Male gender (%) 4163 (44.2) 3353 (47.5) 747 (38.8) 213 (49.2) ,.001 Private insurance (%) 6287 (66.7) 5296 (75.0) 710 (36.9) 281 (64.9) ,.001 Febrile (%) 1040 (11.0) 785 (11.1) 189 (9.8) 66 (15.2) .005
TABLE 2 Univariate Analysis of Interventions and Outcomes by Race
Total sample (n= 9424)
White (n= 7065)
African American (n= 1926)
Other (n= 433)
P
Imaginga
Any imaging (%) 6645 (70.5) 5074 (71.8) 1263 (65.6) 308 (71.1) ,.001 CT scan (%) 804 (8.5) 681 (9.6) 92 (4.8) 31 (7.2) ,.001 Ultrasound (%) 1490 (15.8) 1230 (17.4) 204 (10.6) 56 (12.9) ,.001 Abdominal x-ray (%) 5314 (56.4) 3979 (56.3) 1067 (55.4) 268 (61.2) .047 Therapy
Narcoticsb
(%) 1498 (15.9) 1251 (17.7) 197 (10.2) 50 (11.5) ,.001 Ketorolac (%) 393 (4.2) 309 (4.4) 72 (3.7) 12 (2.8) NS Narcotics and/or
ketorolac (%)
1509 (16.0) 1258 (17.8) 201 (10.4) 50 (11.5) ,.001 Antiemeticc(%) 1629 (17.2) 1277 (18.1) 290 (15.1) 62 (14.3) .002 IVfluidsd(%) 3462 (36.7) 2837 (40.2) 480 (24.9) 145 (33.5) ,.001 Enema (%) 1439 (15.3) 1093 (15.4) 276 (14.3) 70 (16.2) NS Disposition
Admitted (%) 1780 (18.9) 1480 (20.9) 214 (11.1) 86 (19.9) ,.001 Surgery performed (%) 1045 (11.1) 897 (12.7) 109 (5.7) 39 (9.0) ,.001 Diagnosis
Appendicitis (%) 404 (4.3) 361 (5.1) 36 (1.9) 7 (1.6) ,.001 Constipation (%) 1820 (19.3) 1312 (18.6) 426 (22.1) 82 (18.9) .002 Abdominal pain (%) 2428 (25.8) 1922 (27.2) 409 (21.2) 97 (22.4) ,.001 Gastroenteritis (%) 519 (5.5) 350 (5.0) 148 (7.7) 21 (4.8) ,.001 Urinary tract
infection (%)
298 (3.2) 207 (2.9) 80 (4.2) 11 (2.5) .018 Renal calculus (%) 45 (0.5) 41 (0.6) 4 (0.2) 0 (0.0) .035 All other diagnoses (%) 3910 (41.5) 2872 (40.7) 823 (42.7) 215 (29.7) .001
NS, not significant.
aImaging study of the abdomen.
bIncluding IV or oral morphine, oxycodone, oxycodone, meperidine, hydromorphone, and acetaminophen-codeine given in the ED.
ketorolac, multivariate analysis re-vealed no difference between white and African American children re-ceiving either narcotics or ketorolac in this subgroup.
Table 9 is a summary of the multivariate analysis for the 3695 white and African
American children whose diagnosis did notfit into one of the analyzed catego-ries. This category included a disparate group of diagnoses. The most common was“vomiting alone,”with 78 children. Among these children, there were 74 unique discharge diagnoses of varying
apparent severity. Significant differ-ences were seen among racial groups, with African American children being less likely to be admitted or have sur-gery, a CT scan, an ultrasound, or any imaging in general. Additionally, Afri-can AmeriAfri-can children were more likely to receive ketorolac but less likely to receive IVfluids.
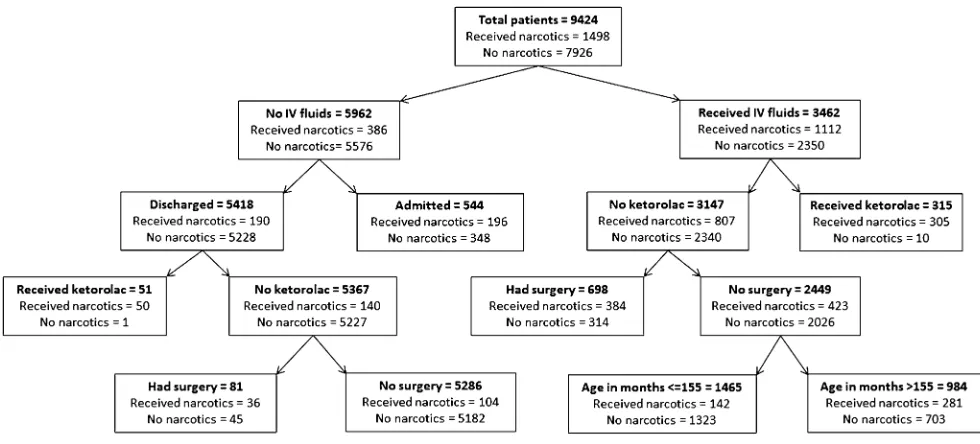
Recursive Partitioning
Further exploration of these factors was performed by using recursive partitioning. Focus was primarily on those factors that demonstrated a dif-ference across races on multivariate analysis. These included admission rates, surgery rates, use of imaging (CT scan and ultrasound), pain medica-tions, and IVfluids. This analysis was performed on the complete dataset. A representative decision tree for ad-ministration of narcotics is shown in Fig 1. Notably, race was not a predictor for any of these outcomes of interest in thefirst several layers of any of the decision trees.
DISCUSSION
Disease Burden and Diagnoses
Abdominal pain was a frequently en-countered chief complaint in our ED during the study period. As reported, patient demographic characteristics influenced the evaluation and treat-ment of these patients, as well as their disposition. The most common diagnosis seen was constipation, with almost 20% of all patients and.25% of children 5 to 12 years of age receiving this diagnosis.
Constipation has been studied in the community setting. Van den Berg and colleagues3 performed a systematic
review of the epidemiology of con-stipation in children. They reported a wide range in prevalence (0.7%–29.6%). However, they did not comment on what proportion of these children sought care in a pediatric ED.
TABLE 3 Univariate Analysis of Demographics, Interventions, and Outcomes for Subjects Diagnosed With Appendicitis
Total Sample (n= 404)
White (n= 361)
African American (n= 36)
Other (n= 7) P
Demographics
Mean age, mo (SD) 139.95 (40.9) 138.91 (41.0) 152.44 (41.0) 129.39 (25.9) NS Male gender (%) 236 (58.4) 211 (58.4) 20 (55.6) 5 (71.4) NS Private insurance (%) 305 (75.5) 282 (78.1) 18 (50.0) 5 (71.4) .011 Febrile (%) 127 (31.4) 112 (31.0) 12 (33.3) 3 (42.9) NS Imaging
Any imaging (%) 202 (50.0) 178 (49.3) 20 (55.6) 4 (57.1) NS CT scan (%) 60 (14.9) 54 (15.0) 6 (16.7) 0 (0.0) NS Ultrasound (%) 47 (11.6) 41 (11.4) 6 (16.7) 0 (0.0) NS Abdominal x-ray (%) 119 (29.5) 104 (28.8) 11 (30.6) 4 (57.1) NS Therapy
Narcotics (%) 234 (57.9) 210 (58.2) 19 (52.8) 5 (71.4) NS Ketorolac (%) 5 (1.2) 5 (1.4) 0 (0.0) 0 (0.0) NS Narcotics and/or ketorolac (%) 234 (57.9) 210 (58.2) 19 (52.8) 5 (71.4) NS Antiemetic (%) 114 (28.2) 103 (28.5) 11 (30.6) 0 (0.0) NS IVfluids (%) 282 (69.8) 250 (69.3) 26 (72.2) 6 (85.7) NS Enema (%) 16 (4.0) 13 (3.6) 2 (5.6) 1 (14.3) NS Disposition
Admitted (%) 336 (83.2) 299 (82.8) 30 (83.3) 7 (100) NS Surgery performed (%) 342 (84.7) 304 (84.2) 31 (86.1) 7 (100) NS
NS, not significant.
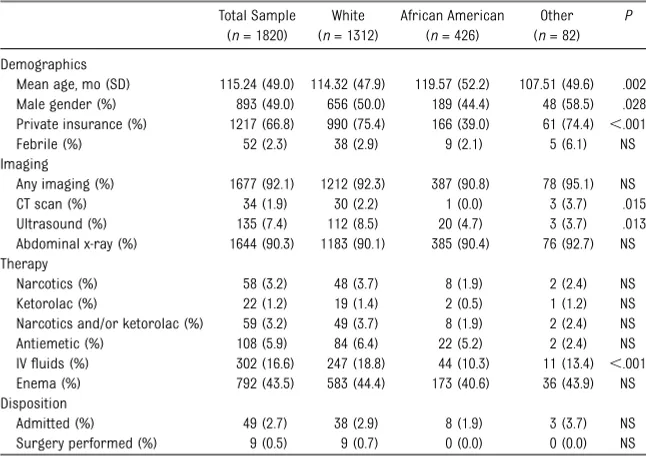
TABLE 4 Univariate Analysis of Demographics, Interventions, and Outcomes for Subjects Diagnosed With Constipation
Total Sample (n= 1820)
White (n= 1312)
African American (n= 426)
Other (n= 82)
P
Demographics
Mean age, mo (SD) 115.24 (49.0) 114.32 (47.9) 119.57 (52.2) 107.51 (49.6) .002 Male gender (%) 893 (49.0) 656 (50.0) 189 (44.4) 48 (58.5) .028 Private insurance (%) 1217 (66.8) 990 (75.4) 166 (39.0) 61 (74.4) ,.001 Febrile (%) 52 (2.3) 38 (2.9) 9 (2.1) 5 (6.1) NS Imaging
Any imaging (%) 1677 (92.1) 1212 (92.3) 387 (90.8) 78 (95.1) NS CT scan (%) 34 (1.9) 30 (2.2) 1 (0.0) 3 (3.7) .015 Ultrasound (%) 135 (7.4) 112 (8.5) 20 (4.7) 3 (3.7) .013 Abdominal x-ray (%) 1644 (90.3) 1183 (90.1) 385 (90.4) 76 (92.7) NS Therapy
Narcotics (%) 58 (3.2) 48 (3.7) 8 (1.9) 2 (2.4) NS Ketorolac (%) 22 (1.2) 19 (1.4) 2 (0.5) 1 (1.2) NS Narcotics and/or ketorolac (%) 59 (3.2) 49 (3.7) 8 (1.9) 2 (2.4) NS Antiemetic (%) 108 (5.9) 84 (6.4) 22 (5.2) 2 (2.4) NS IVfluids (%) 302 (16.6) 247 (18.8) 44 (10.3) 11 (13.4) ,.001 Enema (%) 792 (43.5) 583 (44.4) 173 (40.6) 36 (43.9) NS Disposition
Admitted (%) 49 (2.7) 38 (2.9) 8 (1.9) 3 (3.7) NS Surgery performed (%) 9 (0.5) 9 (0.7) 0 (0.0) 0 (0.0) NS
Liem and colleagues4 reported a
prevalence of constipation of 1.1% during a 2-year period, using the Medical Expenditure Panel Survey database. They found a mean of 0.52 ED visits per child with constipation.
This was greater than the 0.16 ED visits per member of the general pe-diatric population; however, they did not comment on the proportion of ED visits that were directly related to constipation.
Our results support that constipation is a frequently confronted problem in the pediatric ED. In our study, 92% of children eventually diagnosed with constipation were imaged. Most com-monly (90%) this was with an abdomi-nal x-ray. This implies that there were objective data that led to the diagnosis of constipation as the cause of ab-dominal pain in most of these children. Of note, some sources recommend against imaging for constipation.5
Fewer than 3% of constipated children were admitted to the hospital, in-dicating that most of these patients can be managed as outpatients in the primary care setting once the di-agnosis is confirmed. Usually, the diagnosis can be made with a thor-ough history and complete physical examination (including rectal exam-ination), with or without an abdominal radiograph. All of these are readily accessible outside of the ED in most community practice settings.
There are few published studies that have defined the demographic, clinical, and etiological characteristics of chil-dren presenting to the ED with abdom-inal pain. Reynolds and Jaffe6performed
a prospective study looking at the cau-ses of abdominal pain in children pre-senting to an ED. Their study of 377 ED patients found that 135 received a dis-charge diagnosis of abdominal pain, 7% had a diagnosis of constipation, and 2% had otitis media. They did not report associated clinical and demographic characteristics of patients. Scholer and colleagues7 retrospectively examined
1141 children aged 2 to 12 years who presented to their doctor for a non-scheduled visit or to the ED. They found that 5.1% of all visits during the study period were because of abdominal pain; 18.6% had a final diagnosis of upper respiratory infection and/or otitis media, 16.6% had group A streptococ-cal pharyngitis, 16.0% had viral syn-drome, and 15.6% had abdominal pain.
TABLE 5 Univariate Analysis of Demographics, Interventions, and Outcomes for Subjects Diagnosed With Abdominal Pain
Total Sample (n= 2428)
White (n= 1922)
African American (n= 409)
Other (n= 97)
P
Demographics
Mean age, mo (SD) 135.25 (53.5) 135.30 (53.0) 139.65 (56.0) 115.74 (48.2) ,.001 Male gender (%) 981 (40.4) 811 (42.2) 128 (31.3) 42 (43.3) ,.001 Private insurance (%) 1668 (68.7) 1461 (76.0) 148 (36.2) 59 (60.8) ,.001 Febrile (%) 256 (10.5) 207 (10.8) 33 (8.1) 16 (16.5) .041 Imaging
Any imaging (%) 1777 (73.2) 1417 (73.7) 289 (70.7) 71 (73.2) NS CT scan (%) 298 (12.3) 256 (13.3) 33 (8.1) 88 (9.3) .009 Ultrasound (%) 554 (22.8) 455 (23.7) 78 (19.1) 21 (21.6) NS Abdominal x-ray (%) 1295 (53.3) 1012 (52.7) 230 (56.2) 53 (54.6) NS Therapy
Narcotics (%) 483 (19.9) 404 (21.0) 59 (14.4) 20 (20.6) .010 Ketorolac (%) 158 (6.5) 128 (6.7) 27 (6.6) 3 (3.1) NS Narcotics and/or
ketorolac (%)
490 (20.2) 408 (21.2) 62 (15.2) 20 (20.6) .021 Antiemetic (%) 505 (20.8) 420 (21.9) 65 (15.9) 20 (20.6) .026 IVfluids (%) 1079 (44.4) 899 (46.8) 139 (34.0) 41 (42.3) ,.001 Enema (%) 161 (6.6) 132 (6.9) 22 (5.4) 7 (7.2) NS Disposition
Admitted (%) 522 (21.5) 433 (22.5) 63 (15.4) 26 (26.8) .003 Surgery performed (%) 248 (10.2) 209 (10.9) 25 (6.1) 14 (14.4) .006
NS, not significant.
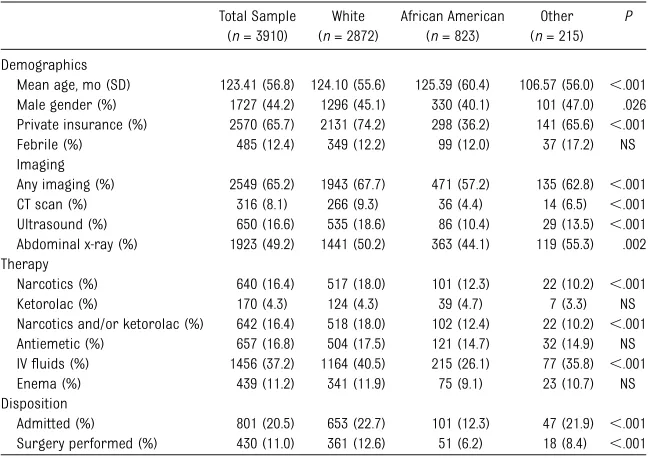
TABLE 6 Univariate Analysis of Demographics, Interventions, and Outcomes for Subjects Whose Diagnoses Fell Into the“Other”Category
Total Sample (n= 3910)
White (n= 2872)
African American (n= 823)
Other (n= 215)
P
Demographics
Mean age, mo (SD) 123.41 (56.8) 124.10 (55.6) 125.39 (60.4) 106.57 (56.0) ,.001 Male gender (%) 1727 (44.2) 1296 (45.1) 330 (40.1) 101 (47.0) .026 Private insurance (%) 2570 (65.7) 2131 (74.2) 298 (36.2) 141 (65.6) ,.001 Febrile (%) 485 (12.4) 349 (12.2) 99 (12.0) 37 (17.2) NS Imaging
Any imaging (%) 2549 (65.2) 1943 (67.7) 471 (57.2) 135 (62.8) ,.001 CT scan (%) 316 (8.1) 266 (9.3) 36 (4.4) 14 (6.5) ,.001 Ultrasound (%) 650 (16.6) 535 (18.6) 86 (10.4) 29 (13.5) ,.001 Abdominal x-ray (%) 1923 (49.2) 1441 (50.2) 363 (44.1) 119 (55.3) .002 Therapy
Narcotics (%) 640 (16.4) 517 (18.0) 101 (12.3) 22 (10.2) ,.001 Ketorolac (%) 170 (4.3) 124 (4.3) 39 (4.7) 7 (3.3) NS Narcotics and/or ketorolac (%) 642 (16.4) 518 (18.0) 102 (12.4) 22 (10.2) ,.001 Antiemetic (%) 657 (16.8) 504 (17.5) 121 (14.7) 32 (14.9) NS IVfluids (%) 1456 (37.2) 1164 (40.5) 215 (26.1) 77 (35.8) ,.001 Enema (%) 439 (11.2) 341 (11.9) 75 (9.1) 23 (10.7) NS Disposition
Admitted (%) 801 (20.5) 653 (22.7) 101 (12.3) 47 (21.9) ,.001 Surgery performed (%) 430 (11.0) 361 (12.6) 51 (6.2) 18 (8.4) ,.001
Only 2% were diagnosed with consti-pation. Fewer than 1% of children had an illness requiring surgery. Interestingly, neither of the preceding studies reported a single case of intussusception as an etiology. Our results are drastically different compared with these 2 stud-ies, with our data showing much higher rates of both constipation and surgery. These studies are.15 years old and there may have been a shift in utiliza-tion or diagnoses causing the dis-agreement.
Racial Differences
On initial univariate analysis, several of the studied interventions and outcomes appear to show significant racial dif-ferences, including disposition, imag-ing, and therapy. However, univariate analysis also demonstrated significant differences in gender, age, tempera-ture, and diagnosis across race cate-gories. Factoring these characteristics into a multivariate analysis made these
differences smaller, but many of them remained.
Interestingly, when univariate analysis was performed on individual diagnoses, most of the racial differences were no longer statistically significant. For example, when the 404 children diag-nosed with appendicitis were studied as a subset of the entire data set, there were no differences seen in imaging performed, analgesia and other ther-apy administered, or disposition, with regard to race. Suspected appendicitis has a well-defined evaluation and man-agement protocol at most institutions, including ours. These data support that the evaluation and management of these children is performed without regard to race.
Interestingly, this contrasts with results of other studies of appendicitis in children. Multiple authors have reported that rates of rupture vary across racial lines, with minorities generally having higher rates.2,8–10These differences have
not been explained by differences in insurance or socioeconomic status.11
However, others have shown that racial differences in ruptured appendicitis disappeared after adjusting for access to care.12Still others have reported no
racial disparities in the rate of rup-ture.13,14We did not look specifically for
rates of rupture in our study, and the data overall are mixed.
Ourfinding of decreased incidence of appendicitis in African American chil-dren, as compared with white chilchil-dren, is consistent with previous population-based studies.10,15,16 For example,
Kokoska and colleagues10reported an
OR of 0.39 (95% CI 0.38–0.41) for African American children to develop appen-dicitis as compared with white children. Their study was population-based and reviewed 2 national databases. This
finding is consistent with our reported OR of 0.35, even though we reviewed visits only for abdominal pain.
Although appendicitis is generally a painful surgical condition that frequently requires narcotic therapy, constipation usually does not. When analyzed sepa-rately, children with constipation re-ceived pain medications infrequently and with equal rates across all races. However, African American children with constipation did not receive IVfluids, CT scans, or ultrasound as frequently as their white counterparts.
Univariate analysis of the “catch-all” diagnosis of abdominal pain revealed several factors pertaining to racial dif-ferences. Multivariate analysis explained many of these. IVfluids were not given to African American children as fre-quently as white children in this group. Interestingly, whereas African Ameri-can children were less likely to receive narcotics, as compared with white children they were more likely to re-ceive ketorolac. Because of this, there was no significant difference between the 2 groups in the rate of receiving narcotics and/or ketorolac.
TABLE 7 Multivariate Analysis of Interventions and Outcomes According to Race
n(%) OR (95% CI) Hosmer and Lemeshow Statistice(P) White
(n= 7065)
African American (n= 1926)
Unadjusted Adjusted
Dispositiona
Admitted 1480 (20.9) 214 (11.1) 0.47 (0.41–0.55) 0.68 (0.56–0.82) 38.72 (,.001) Surgery 897 (12.7) 109 (5.7) 0.41 (0.37–0.51) 0.64 (0.50–0.82) 25.02 (.002) Imagingb
CT scan 681 (9.6) 92 (4.8) 0.47 (0.38–0.59) 0.65 (0.50–0.85) 38.66 (,.001) Ultrasound 1230 (17.4) 204 (10.6) 0.56 (0.48–0.66) 0.68 (0.58–0.81) 7.18 (NS) Abdominal x-ray 3979 (56.3) 1067 (55.4) 0.96 (0.87–1.07) NS 132.44 (,.001) Any imagingc 5074 (71.8) 1263 (65.6) 0.75 (0.67–0.83) 0.85 (0.75–0.96) 59.85 (,.001) Medicationsd
Narcotics 1251 (17.7) 197 (10.2) 0.53 (0.45–0.62) 0.60 (0.48–0.77) 45.89 (,.001) Ketorolac 309 (4.4) 72 (3.7) 0.85 (0.65–1.10) 1.66 (1.16–2.37) 7.12 (NS) Narcotics and/or
ketorolac
1258 (17.8) 201 (10.4) 0.54 (0.46–0.63) 0.78 (0.64–0.95) 38.95 (,.001) Antiemetic 1277 (18.1) 290 (15.1) 0.80 (0.70–0.92) NS 47.94 (,.001) IVfluids 2837 (40.2) 480 (24.9) 0.50 (0.44–0.55) 0.59 (0.52–0.67) 133.25 (,.001) Enema 1093 (15.4) 276 (14.3) NS NS 41.17 (,.001)
NS, not significant.
aThe model was adjusted for age, gender, race, insurance status, diagnosis, medication administration (narcotic, ketorolac, antiemetic, IVfluids, and enema), imaging (CT scan, ultrasound, abdominal x-ray, and any), and fever status.
bThe model was adjusted for age, gender, race, insurance status, diagnosis, medication administration (narcotic, ketorolac, antiemetic, IVfluids, and enema), performance of the other imaging studies, fever status, disposition, and surgery. cNone of the specific imaging studies were included in the adjusted analysis.
dThe model was adjusted for age, gender, race, insurance status, diagnosis, imaging (CT scan, ultrasound, plainfilm, and any), administration of the other medications studied, fever status, disposition, and surgery.
The diagnosis category, “other,” dem-onstrated differences across races for many factors including admission rate, surgery rate, CT scan, ultrasound, ketorolac, and IV fluids. Interestingly, there was no difference in the rate of narcotic administration or narcotics and/or ketorolac. This other category was a broad group of diagnoses, some of which are very severe and others that are minor. This makes it difficult to determine the influence of the individual diagnosis on reported dif-ferences.
Recursive partitioning further eluci-dated these characteristics. When factors that demonstrated a racial difference were examined using this process, race was found not to be an important factor in any of the decision trees. Clinical and demographic factors like fever, diagnosis, age, and gender were much more important and this
held true using multiple methods to analyze the data.
Chamberlain and colleagues first re-ported on racial differences in admis-sion rates for children seen in the ED.17
Reviewing nearly 9000 children across 13 sites, they found that white children in the 2 lowest illness severity quintiles were 1.5 to 2.0 times more likely to be admitted to the hospital as compared with all other races with similar illness severity. However, this study did not look at diagnosis as a factor affecting admission.
There have been other recent reports of racial differences in the adminis-tration of analgesia in the pediatric ED for abdominal pain. One recent study examined a national database of pe-diatric visits to the ED for abdominal pain. The authors looked at racial groups and reported pain scores as well as other confounders and concluded that
African American children were less likely to receive analgesia in the ED as compared with white children.18Again,
final diagnosis was not included as a potential confounder. This may ex-plain why our results differ. Another study using a national database fo-cused specifically on CT use and again found decreased use in African American children.19 Although this
study included the diagnosis of ap-pendicitis in multivariate analysis, other diagnoses were not included. Moreover, the authors did not report results for the cohort of children who were diagnosed with appendicitis.
When we included specific diagnoses in our study’s analysis, rates of admis-sion and analgesia administration for subjects with appendicitis, constipation, and abdominal pain were found not to be different among different races. Con-founding factors, such as access to care, comorbidities, and response to pain, are not directly accounted for in the study data. However, recursive partitioning confirmed that there were no racial differences across all of the diagnoses we examined. Recursive partitioning is less prone to confounding caused by these types of residual confounders. This further emphasizes the importance of diagnosis as a predictive factor in these kinds of studies. It is difficult to draw conclusions about differences among racial groups when important clinical factors are not accounted for.
Limitations
Our data were obtained retrospecti-vely from the EMR. It is likely that a few children were miscoded, particularly with regard to chief complaint andfinal diagnosis. We believe this to be an ex-ceedingly small proportion of the total visits. Race was assigned by the reg-istration clerk in conjunction with the patient’s family members. There may be a very small proportion of subjects who were misclassified. We do not
TABLE 8 Rates of Outcomes and Interventions According to Race for Subjects Diagnosed With Abdominal Pain
n(%) OR (95% CI) Hosmer and Lemeshow statisticf
(P) White
(n= 1922)
African American (n= 409)
Unadjusted Adjusted
Dispositiona
Admitted 433 (22.5) 63 (15.4) 0.63 (0.47–0.84) NS 23.74 (.003) Surgery 209 (10.9) 25 (6.1) 0.53 (0.35–0.82) NS 12.68 (NS) Imagingb
CT scan 256 (13.3) 33 (8.1) 0.57 (0.39–0.84) NS 10.74 (NS) Ultrasound 455 (23.7) 78 (19.1) 0.76 (0.58–0.99) NS 17.22 (.027) Abdominal x-ray 1012 (52.7) 230 (56.2) 1.16 (0.93–1.43) NS 3.65 (NS) Any imagingc
1417 (73.7) 289 (70.7) 0.86 (0.68–1.09) NS 110.47 (NS) Medicationsd
Narcoticse 404 (21.0) 59 (14.4) 0.63 (0.47–0.85) 0.62 (0.41–0.94) 17.86 (.022) Ketorolace 128 (6.7) 27 (6.6) 0.99 (0.65–1.52) 1.86 (1.05–3.30) 6.67 (NS) Narcotics and/or
ketorolace
408 (21.2) 62 (15.2) 0.66 (0.50–0.89) NS 21.32 0.006) Antiemetic 420 (21.9) 65 (15.9) 0.68 (0.51–0.90) NS 4.98 (NS) IVfluids 899 (46.8) 139 (34.0) 0.59 (0.47–0.73) 0.69 (0.53–0.88) 34.62 (NS) Enema 132 (6.9) 22 (5.4) 0.77 (0.48–1.22) NS 5.54 (NS)
NS, not significant.
aThe model was adjusted for age, gender, race, insurance status, medication administration (narcotic, ketorolac, antiemetic, IVfluids, and enema), imaging (CT scan, ultrasound, abdominal x-ray, and any), and fever status.
bThe model was adjusted for age, gender, race, insurance status, medication administration (narcotic, ketorolac, anti-emetic, IVfluids, and enema), performance of the other imaging categories studies, fever status, disposition, and surgery. cNone of the specific imaging studies were included in the adjusted analysis.
dThe model was adjusted for age, gender, race, insurance status, imaging (CT scan, ultrasound, plainfilm, and any), administration of the other medications studied, fever status, disposition, and surgery.
eThe combination of narcotics and/or ketorolac was not included in the modeling for the individual drugs. Nor were the individual drugs included in the modeling of the combination.
believe that this would substantially affect our conclusions. Additionally, we had to select a single leading di-agnosis for each visit. Conceivably,
using a different rank-ordering sys-tem could have yielded slightly differ-ent results; however, we believe that any small differences would not change
our conclusions. Additionally, other fac-tors not captured in the data set, for example duration of pain, previous sur-geries, or past medical history, may have influenced the evaluation and man-agement of individual patients.
Overall, 70.5% of children during the study period had some form of imaging. Other institutions may have higher or lower rates of utilization. These data were drawn from a single center and reflects the local standards and coding habits of those physicians. Our facility had no “abdominal pain pathway” during the study period; evaluation and management was at the discretion of the treating provider. Although we be-lieve our conclusions reflect the gen-eral practice nationally, we cannot definitively prove this.
Our study data did not include the route of administration for pain medications. It is possible that there may be differ-ences across racial groups in this regard. The mechanism of action of narcotics is not dependent on the route of ad-ministration. Moreover, when given in recommended doses, narcotics are equi-analgesic irrespective of how they are administered.
TABLE 9 Rates of Outcomes and Interventions According to Race for Subjects Whose Diagnosis Fell Into the“Other”Category
n(%) OR (95% CI) Hosmer and Lemeshow statisticf
(P) White
(n= 2872)
African American (n= 823)
Unadjusted Adjusted
Dispositiona
Admitted 653 (22.7) 101 (12.3) 0.47 (0.38–0.60) 0.61 (0.47–0.80) 17.03 (.030) Surgery 361 (12.6) 51 (6.2) 0.46 (0.34–0.62) 0.62 (0.44–0.86) 25.56 (.001) Imagingb
CT scan 266 (9.3) 36 (4.4) 0.45 (0.31–0.64) 0.58 (0.40–0.85) 8.66 (NS) Ultrasound 535 (18.6) 86 (10.4) 0.52 (0.41–0.66) 0.61 (0.47–0.60) 9.36 (NS) Abdominal x-ray 1441 (50.2) 363 (44.1) 0.78(0.67–0.92) NS 14.08 (NS) Any imagingc
1943 (67.7) 471 (57.2) 0.64 (0.55–0.75) 0.76 (0.63–0.91) 4.27 (NS) Medicationsd
Narcoticse 517 (18.0) 101 (12.3) 0.64 (0.51–0.80) NS 21.96 (NS) Ketorolace 124 (4.3) 39 (4.7) 1.10 (0.76–1.59) 1.79 (1.12–2.87) 8.44 (.005) Narcotics and/or
ketorolace
518 (18.0) 102 (12.4) 0.64 (0.51–0.81) NS 16.76 (.033) Antiemetic 504 (17.5) 121 (14.7) 0.81 (0.65–1.00) NS 20.69 (.008) IVfluids 1164 (40.5) 215 (26.1) 0.52 (0.44–0.61) 0.63 (0.51–0.78) 51.52 (,.001) Enema 341 (11.9) 75 (9.1) 0.74 (0.57–0.97) NS 6.34 (NS)
NS, not significant.
aThe model was adjusted for age, gender, race, insurance status, medication administration (narcotic, ketorolac, antiemetic, IVfluids, and enema), imaging (CT scan, ultrasound, abdominal x-ray, and any), and fever status.
bThe model was adjusted for age, gender, race, insurance status, medication administration (narcotic, ketorolac, antiemetic, IVfluids, and enema), performance of the other imaging categories studies, fever status, disposition, and surgery. cNone of the specific imaging studies were included in the adjusted analysis.
dThe model was adjusted for age, gender, race, insurance status, imaging (CT scan, ultrasound, plainfilm, and any), administration of the other medications studied, fever status, disposition, and surgery.
eThe combination of narcotics and/or ketorolac was not included in the modeling for the individual drugs. Nor were the individual drugs included in the modeling of the combination.
fFor the adjusted model.
FIGURE 1
Our database also did not include the timing of any of the interventions studied. We are unable to demonstrate, for example, when during the evalua-tion process a particular child received narcotics. It is possible that children in different race groups received nar-cotics before diagnosis at different rates. Although we do not think any
difference would be significant, we do not have the data available to prove this. Such an analysis is outside of the scope of this study.
CONCLUSIONS
Abdominal pain is a common chief complaint in the pediatric ED.
Con-stipation was the most frequent di-agnosis and it rarely required hospital admission. Multivariate and recursive partitioning analysis demonstrated that, after classifying by diagnosis, no racial differences existed in the evaluation, treatment, and disposition of children presenting with abdominal pain at our institution.
REFERENCES
1. Russy R. Pain - Abdomen. In: Fleischer G, Ludwig S, eds.Textbook of Pediatric Emer-gency Medicine. 5th ed. Philadelphia, PA: Lippincott Williams & Wilkins; 2006:469–476 2. Guagliardo MF, Teach SJ, Huang ZJ, Chamberlain JM, Joseph JG. Racial and ethnic disparities in pediatric appendicitis rupture rate.Acad Emerg Med. 2003;10(11): 1218–1227
3. van den Berg MM, Benninga MA, Di Lorenzo C. Epidemiology of childhood constipation: a systematic review. Am J Gastroenterol. 2006;101(10):2401–2409
4. Liem O, Harman J, Benninga M, Kelleher K, Mousa H, Di Lorenzo C. Health utilization and cost impact of childhood constipation in the United States.J Pediatr. 2009;154(2): 258–262
5. Reuchlin-Vroklage LM, Bierma-Zeinstra S, Benninga MA, Berger MY. Diagnostic value of abdominal radiography in constipated children: a systematic review.Arch Pediatr Adolesc Med. 2005;159(7):671–678 6. Reynolds SL, Jaffe DM. Diagnosing abdominal
pain in a pediatric emergency department.
Pediatr Emerg Care. 1992;8(3):126–128 7. Scholer SJ, Pituch K, Orr DP, Dittus RS.
Clinical outcomes of children with acute abdominal pain.Pediatrics. 1996;98(4 pt 1): 680–685
8. Smink DS, Fishman SJ, Kleinman K, Finkelstein JA. Effects of race, insurance status, and hospital volume on perforated appendicitis in children.Pediatrics. 2005; 115(4):920–925
9. Jablonski KA, Guagliardo MF. Pediatric ap-pendicitis rupture rate: a national indicator of disparities in healthcare access. Popul Health Metr. 2005;3(1):4
10. Kokoska ER, Bird TM, Robbins JM, Smith SD, Corsi JM, Campbell BT. Racial disparities in the management of pediatric appendicitis.
J Surg Res. 2007;137(1):83–88
11. Livingston EH, Fairlie RW. Little effect of in-surance status or socioeconomic condition on disparities in minority appendicitis perforation rates. Arch Surg. 2012;147(1): 11–17
12. Lee SL, Shekherdimian S, Chiu VY, Sydorak RM. Perforated appendicitis in children: equal access to care eliminates racial and socioeconomic disparities.J Pediatr Surg. 2010;45(6):1203–1207
13. Boomer L, Freeman J, Landrito E, Feliz A. Acute appendicitis in Latino children: do health disparities exist?J Surg Res. 2010; 163(2):290–293
14. Nwomeh BC, Chisolm DJ, Caniano DA, Kelleher KJ. Racial and socioeconomic dis-parity in perforated appendicitis among
children: where is the problem?Pediatrics. 2006;117(3):870–875
15. Anderson JE, Bickler SW, Chang DC, Talamini MA. Examining a common disease with unknown etiology: trends in epidemi-ology and surgical management of appen-dicitis in California, 1995-2009. World J Surg. 2012;36(12):2787–2794
16. Addiss DG, Shaffer N, Fowler BS, Tauxe RV. The epidemiology of appendicitis and ap-pendectomy in the United States. Am J Epidemiol. 1990;132(5):910–925
17. Chamberlain JM, Joseph JG, Patel KM, Pol-lack MM. Differences in severity-adjusted pediatric hospitalization rates are associ-ated with race/ethnicity.Pediatrics. 2007;119 (6). Available at: www.pediatrics.org/cgi/ content/full/e1319
18. Johnson T, Weaver M, Borrero S, Davis E, Myaskovsky L, Zuckerbraun N. Racial and ethnic disparities in the management of pediatric abdominal pain. Paper presented at: Pediatric Academic Societies; April 28, 2012, 2012; Boston, MA.
DOI: 10.1542/peds.2012-3672 originally published online May 20, 2013;
2013;131;1098
Pediatrics
Services
Updated Information &
http://pediatrics.aappublications.org/content/131/6/1098 including high resolution figures, can be found at:
References
http://pediatrics.aappublications.org/content/131/6/1098#BIBL This article cites 16 articles, 5 of which you can access for free at:
Subspecialty Collections
sub
http://www.aappublications.org/cgi/collection/emergency_medicine_
Emergency Medicine
_sub
http://www.aappublications.org/cgi/collection/community_pediatrics
Community Pediatrics
following collection(s):
This article, along with others on similar topics, appears in the
Permissions & Licensing
http://www.aappublications.org/site/misc/Permissions.xhtml in its entirety can be found online at:
Information about reproducing this article in parts (figures, tables) or
Reprints
DOI: 10.1542/peds.2012-3672 originally published online May 20, 2013;
2013;131;1098
Pediatrics
Kerry Caperell, Raymond Pitetti and Keith P. Cross
Race and Acute Abdominal Pain in a Pediatric Emergency Department
http://pediatrics.aappublications.org/content/131/6/1098
located on the World Wide Web at:
The online version of this article, along with updated information and services, is
http://pediatrics.aappublications.org/content/suppl/2013/05/15/peds.2012-3672.DCSupplemental Data Supplement at:
by the American Academy of Pediatrics. All rights reserved. Print ISSN: 1073-0397.