Magnetic Resonance Studies
in
Patients with Chronic Liver Disease
and
Following Hepatic Transplantation
Simon D. Taylor-Robinson
Division of Gastroenterology,
Royal Postgraduate Medical School,
Hammersmith Hospital,
Du Cane Road,
London W12 OHS
ProQuest Number: 10106763
All rights reserved
INFORMATION TO ALL USERS
The quality of this reproduction is dependent upon the quality of the copy submitted. In the unlikely event that the author did not send a complete manuscript and there are missing pages, these will be noted. Also, if material had to be removed,
a note will indicate the deletion.
uest.
ProQuest 10106763
Published by ProQuest LLC(2016). Copyright of the Dissertation is held by the Author. All rights reserved.
This work is protected against unauthorized copying under Title 17, United States Code. Microform Edition © ProQuest LLC.
ProQuest LLC
789 East Eisenhower Parkway P.O. Box 1346
Abstract
Chronic liver disease is a major health problem and liver transplantation is the only form of
treatment which prolongs life in end-stage liver disease. However, the current methods of
assessing the functional severity of liver injury are not entirely satisfactory, usually depending
on a collection of laboratory and clinical factors, which do not always directly reflect
underlying hepatic function. Magnetic resonance spectroscopy (MRS) may provide direct
biochemical information on hepatic metabolic processes. In this thesis, a combination of in
vivo and in vitro phosphorus-31 MRS techniques are used to study liver fimction in patients
with cirrhosis and also hepatic allograft rejection following liver transplantation. The results
show that in vivo phosphorus-31 MR spectra vary with the functional severity of chronic
liver disease. In vitro phosphorus-31 MRS demonstrates that the underlying biochemical
abnormalities are due to changes in phospholipid metabolism and may be used as an
indication of hepatic functional reserve. Patients with chronic ductopenic allograft rejection
have spectral changes, probably reflecting altered phospholipid secretion into bile in this
cholestatic condition. MR spectroscopy may provide an indication of bile duct damage,
where early diagnosis is often difficult. A major complication of chronic liver disease is
chronic hepatic encephalopathy, the neuropsychiatrie abnormality which affects up to 80%
of patients. The pathogenesis of the condition is unknown and it is difficult to monitor
objectively. MRS may be utilised to study the biochemistry and metabolism of the brain. The
cerebral function of encephalopathic patients with biopsy-proven cirrhosis of the liver is
studied using standard clinical and electroencephalographic techniques, which are compared
with phosphorus-31 and hydrogen-1 (proton) MRS and MR imaging modalities. Results
demonstrate spectral changes, which correlate closely with the underlying neuropsychiatrie
impairment, offering the possibility of studying the pathogenesis and providing an objective
DEDICATION
ACKNOWLEDGEMENTS
From March 1992 to November 1994, I was Honorary Senior Registrar and Research
Fellow to Professor Graeme Bydder at the Robert Steiner Magnetic Resonance Unit, Royal
Postgraduate Medical School, Hammersmith Hospital, as part of a MRC programme grant
(number 9202316). The Medical Research Council and Picker International, Cleveland, Ohio
provided the support for the MR imaging and in vivo MR spectroscopy studies at the
Hammersmith Hospital.
I am indebted to Professor Bydder, Dr David J. Bryant, Dr I. Jane Cox, Dr Joseph V.
Hajnal and Dr Nandita M. DeSouza for their tremendous advice and assistance. I also thank
Professor Robert Steiner from the Department of Radiology at the Hammersmith Hospital
and Professor Ian R. Young from Hirst Research Laboratories, Borehamwood, Herts for
their encouragement throughout these studies.
The MRC Biomedical NMR Centre, Mill Hill and Birkbeck College, ULIRS provided NMR
and technical support for in vitro MR spectroscopy studies. Dr Jimmy D. Bell (R.P.M.S.)
and Dr Richard lies (Department of Medicine, Royal London Hospital) facilitated and
fostered these investigations.
I am grateful to Professor Neil McIntyre, Dr Andrew K. Burroughs and the staff of the
University Department of Medicine at the Royal Free Hospital; and Professor Humphrey
Hodgson, Dr John Calam, Dr Julian F.R. Walters and the staff of the Division of
Gastroenterology at the Hammersmith Hospital for kindly allowing me to study their patients.
Mr Keith Rolles and Mr Brian Davidson from the University Department of Surgery at the
Royal Free Hospital are thanked for their collaboration with the liver transplant patients and
I should also like to thank Brenda Hayter, Linda Selves and Debbie Marshall, the liver
transplant coordinators at the Royal Free Hospital, London, for help with patient recruitment
and their assistance in sample collection.
Dr David Menon from the Department of Anaesthesia, Addenbrookes Hospital, Cambridge;
and Dr Claude D. Marcus from Department of Radiology, Hôpital Robert Debré, Reims,
France, gave consistently invaluable support and suggestions. Dr Caroline Doré and the staff
of the Medical Statistics Department, Royal Postgraduate Medical School, London helped
with study design and gave statistical advice.
I am especially indebted to Dr Marsha Y. Morgan, Senior Lecturer and Honorary
Consultant Physician at the University Department of Medicine, Royal Free Hospital, London
for providing the inspiration for this work and for her constructive comments and assistance.
Finally, I should like to thank the radiographers, Janet Sargentoni, Angela Oatridge and Jane
Schwieso who worked with me throughout these studies.
SUPERVISION
My supervisor for these studies was Professor Neil McIntyre from the University Department
of Medicine, Royal Free Hospital and School of Medicine, Pond Street, London NW3 2QG.
A cohort of liver transplant patients and those with chronic liver disease from the Royal Free
Hospital were studied. Additional patients with chronic hepatic encephalopathy were
recruited from the Hammersmith Hospital. All patients were entered into the studies and
consented by me. I learnt how to operate the MR systems at the Hammersmith Hospital,
how to process, analyse and interpret the data acquired. Liver samples for in vitro studies
ABBREVIATIONS
ADP adenosine diphosphate
AMP adenosine monophosphate
ATP adenosine triphosphate
°C degrees Centigrade
CHE chronic hepatic encephalopathy
Cho choline
Cr creatine
CSI chemical shift imaging
MRS carbon-13 magnetic resonance spectroscopy
2,3-DPG 2,3-diphosphoglycerate
EDTA ethylenediaminetetra-acetic acid
EEG electroencephalogram
FOV field of view
FID free induction decay
FT Fourier transformation
g gram
Glx glutamine/glutamate
GPC glycerophosphorylcholine
GPE glycerophosphoiylethanolamine
MRS proton magnetic resonance spectroscopy
kg kilogram
M Molar concentration
mM milliMolar concentration
MDP methylene diphosphonate
MR magnetic resonance
MRI magnetic resonance imaging
MRS magnetic resonance spectroscopy
ms milliseconds
mT milliTesla
ABBREVIATIONS
MT magnetisation transfer
NAA n-acetylaspartate
NDP nucleotide diphosphate
NTP nucleoside triphosphate
NMR nuclear magnetic resonance
NRPB National Radiological Protection Board
OLT orthotopic liver transplantation
PC phosphocholine
PGA perchloric acid
PCr phosphocreatine
PDE phosphodiester
PE phosphoethanolamine
PET positron emission tomography
Pi inorganic phosphate
PME phosphomonoester
3 IP MRS phosphorus-31 magnetic resonance spectroscopy
PSE portal-systemic encephalopathy
rf radiofrequency
s seconds
SAR specified absorption ratio
SHR signal-height ratio
SI signal intensity
SNR signal-to-noise ratio
STEAM stimulated acquisition mode
T Tesla
TjWSE Tj-weighted spin echo
TE echo time
TIPSS transjugular intrahepatic portasystemic stent shunt
CONTENTS
C hapter 1 19
THE PRINCIPLES OF MAGNETIC RESONANCE 20
1.1 Historical Perspectives 20
1.2 Physical Basis of Magnetic Resonance 20
1.2.1 Static Magnetic Fields 21
1.2.2 Time Dependent Magnetic Fields 22
1.2.3 F ourier T ransformation 22
1.2.4 Local Magnetic Fields 23
1.2.5 Chemical Shift 23
1.2.6 Relaxation Characteristics 23
1.3 Magnetic Resonance Imaging 24
1.3.1 Magnetisation Transfer 25
1.4 Magnetic Resonance Spectroscopy 26
1.4.1 In Vitro MR Spectroscopy 26
1.4.2 Metabolite Quantification 27
1.5 Magnetic Resonance Methods 27
1.5.1 The Magnet 27
1.5.2 RF Coils 28
1.5.2.1 Transmitter Coils 28
1.5.2.2 Receiver Coils 29
1.5.3 The Computer System 29
1.6 The Patient Examination 29
1.6.1 Patient Positioning and Magnet Shimming 30
1.7 Data Acquisition 30
1.7.1 Spectral Analysis 31
1.8 References 32
Figure 1.1 35,36
Figure 1.2 37
C hapter 2 40
AN INTRODUCTION TO HEPATIC MAGNETIC RESONANCE 41
SPECTROSCOPY
2.1 Measures of Hepatocellular Injury 41
2.1.1 Dynamic Liver Function Tests 41
2.1.2 The Child-Pugh Scoring System 42
2.2 Hepatic MR Spectroscopy 42
2.2.1 The In Vivo Phosphorus-31 MR Spectrum 42
2.2.2 Hepatic Energy Status and Measurement 43
of Intracellular pH
2.3 Hepatic Phosphorus-31 MR Spectroscopy 43
in Chronic Liver Disease
2.3.1 Implications 45
2.4 Liver Transplantation 46
2.5 Aims 47
C h a p te rs 51
IN VITRO PHOSPHORUS-31 MAGNETIC RESONANCE 52 SPECTROSCOPY OF LIVER EXTRACTS
3.1 Abstract 52
3.2 Introduction 52
3.3 Aims 54
3.4 Materials and Methods 54
3.4.1 Sample Collection 55
3.4.2 Reference Data 55
3.4.3 Tissue Extract Preparation 5 5
3.4.4 /« FzTro MRS Methods 56
3.4.5 Data Processing 56
3.4.6 Statistical Analysis 56
3.5 Results 57
3.6 Discussion 58
3.7 References 61
Table 3.1 64
Table 3.2 65
Table 3.3 66
Figure 3.1 67
Chapter 4 69
IN VIVO - IN VITRO CORRELATIONS IN HEPATIC
PHOSPHORUS-31 MR SPECTROSCOPY IN PATIENTS WITH CHRONIC LIVER DISEASE
70
4.1 Summaiy 70
4.2 Introduction 71
4.3 Aims 72
4.4 Patients and Methods 73
4.4.1 In Vivo MRS Methods 74
4.4.2 In Vivo Data Processing 74
4.4.3 Statistical Analysis 75
4.5 In Vitro Methods 75
4.5.1 Sample Collection 76
4.5.2 Sample Processing 76
4.5.3 In Vitro MRS Methods 77
4.5.4 Data Processing 77
4.5.5 Statistical Analysis 77
4.6 Results 78
4.6.1 In Vivo MRS 78
4.6.2 In Vitro MRS 79
4.7 Discussion 80
4.8 References 83
Table 4.1 87
Table 4.2 88
Table 4.3 89
Table 4.4 90
Table 4.5 91
Figure 4.1 92,93
Figure 4.2 94,95
C hapter 5 98
IN VIVO HEPATIC PHOSPHORUS-31 MAGNETIC RESONANCE SPECTROSCOPY IN LIVER TRANSPLANT PATIENTS WITH CHRONIC DUCTOPENIC ALLOGRAFT REJECTION
99
5.1 Summary 99
5.2 Introduction 100
5.3 Aims 100
5.4 Subjects and Methods 101
5.4.1 NMR Methods 102
5.4.2 Data Processing 102
5.4.3 Statistical Analysis 103
5.5 Results 103
5.6 Discussion 105
5.7 References 109
Table 5.1 111
Table 5.2 112
Table 5.3 112
Chapter 6 115
AN INTRODUCTION TO HEPATIC ENCEPHALOPATHY 116
AND THE APPLICATION OF MAGNETIC RESONANCE TO PATIENTS WITH THIS CONDITION
6.1 Introduction 116
6.2 The Clinical Spectrum of Hepatic Encephalopathy 117
Table 6.1 117
6.3 The Pathogenesis of Hepatic Encephalopathy 118
6.3.1 The Role of Ammonia 119
6.3.2 Impaired Energy metabolism 120
6.3.3 Other Neurotransmitter Pathways 120
6.4 The Investigation of Hepatic Encephalopathy 120
6.5 Treatment and Patient Monitoring 121
6.6 Phosphorus-31 Magnetic Resonance Spectroscopy 123
6.7 Proton Magnetic Resonance Spectroscopy 123
6.8 Magnetic Resonance Imaging 124
6.9 Aims 125
C h ap ter? 129
CEREBRAL PHOSPHORUS-31 MAGNETIC RESONANCE 130
SPECTROSCOPY IN PATIENTS WITH CHRONIC HEPATIC ENCEPHALOPATHY
7.1 Summary 130
7.2 Introduction 131
7.3 Aims 132
7.4 Subjects and Methods 132
7.41 Patient Assessment 132
7.4.2 NMR Methods 134
7.4.3 Data Processing 135
7.4.4 Statistical Analysis 135
7.5 Results 136
7.6 Discussion 138
7.7 References 142
Table 7.1 146
Table 7.2 147
Table 7.3 148
Table 7.4 149
Figure 7.1 150
Figure 7.2 151
C h ap ters 153
REGIONAL VARIATIONS IN CEREBRAL PROTON MAGNETIC 154
RESONANCE SPECTROSCOPY IN PATIENTS WITH CHRONIC HEPATIC ENCEPHALOPATHY
8.1 Summary 154
8.2 Introduction 154
8.3 Aims 155
8.4 Methods 156
8.4.1 Patient Assessment 156
8.4.2 MR Methods 158
8.4.3 Data Processing 158
8.4.4 Statistical Analysis 159
8.5 Results 160
8.6 Discussion 162
8.7 Conclusions 167
8.8 References 168
Table 8.1 172
Table 8.2 173
Table 8.3 174
Figure 8.1 175
Figure 8.2 176,177
Chapter 9 180
MAGNETIC RESONANCE IMAGING OF THE BASAL 181
GANGLIA IN CHRONIC LIVER DISEASE: CORRELATION OF Ti-WEIGHTED AND MAGNETISATION TRANSFER
CONTRAST MEASUREMENTS WITH LIVER DYSFUNCTION AND NEUROPSYCHIATRIC STATUS
9.1 Summary 181
9.2 Introduction 182
9.3 Aims 182
9.4 Patients and Methods 183
9.4.1 Patient Assessment 183
9.4.2 Imaging Methods 185
9.4.3 Image Analysis 185
9.4.4 Statistical Analysis 186
9.5 Results 186
9.6 Discussion 188
9.7 References 195
Table 9.1 198
Table 9.2 199
Table 9.3 200
Table 9.4 201
Figure 9.1a & b 202
Chapter 10 204
MAGNETIC RESONANCE IMAGING AND SPECTROSCOPY 204
OF THE BASAL GANGLIA IN CHRONIC LIVER DISEASE: CORRELATION OF T^-WEIGHTED CONTRAST
MEASUREMENTS WITH ABNORMALITIES IN PROTON AND PHOSPHORUS-31 MAGNETIC RESONANCE SPECTRA
10.1 Summary 205
10.2 Introduction 206
10.3 Aims 207
10.4 Methods 207
10.4.1 Patient Assessment 208
10.4.2 MR Imaging Methods 210
10.4.3 Image Analysis 210
10.4.4. MRS methods 211
10.4.4.1 Proton MRS Examinations 211
10.4.4.2 Phosphorus-31 MRS Examinations 212
10.4.5 MRS Data Processing 212
10.4.6 Statistical Analysis 214
10.5 Results 214
10.5.1 MR Imaging 214
10.5.2 MR Spectroscopy 215
10.5.3 MR Imaging and Spectroscopy 216
10.6 Discussion 216
10.7 Conclusions 222
10.8 References 223
Table 10.1 229
Table 10.2 230
Table 10.3 231
Table 10.4 231
Table 10.5 232
Figure 10.1 233
Figure 10.2 235
Figure 10.3 236
Figure 10.4 237
Chapter 11 239
CONCLUSIONS AND FUTURE DIRECTIVES 239
11.1 Hepatic MR Spectroscopy in Chronic Liver Disease 240
11.2 Hepatic MR spectroscopy following Liver 240
Transplantation
11.3 Future Directives in Hepatic MR Spectroscopy 241
11.4 Cerebral MR Studies in Chronic Hepatic 241
Encephalopathy
Chapter 1
1. THE PRINCIPLES OF MAGNETIC RESONANCE
1.1 HISTORICAL PERSPECTIVES
The nuclear magnetic resonance (NMR) phenomenon was first demonstrated experimentally
in 1946 (Bloch et al., 1946; Purcell et al., 1946). This technique has been used widely by
physicists and chemists ever since. The biomedical applications of NMR are twofold:
magnetic resonance spectroscopy (MRS) and magnetic resonance imaging (MRI). In the
early 1970s, phosphorus-31 magnetic resonance spectra were obtained from isolated rat
skeletal muscle (Hoult et al., 1974), while in the 1980s, the advent of wide-bore
superconducting magnets made in vivo MR studies possible in man (Ross et al., 1981;
Radda et al., 1989). Since its first human applications in the early 1980s, MRI has become
an accepted and increasingly available clinical imaging method, while MRS may be used to
obtain non-invasive biochemical information both on the composition of body fluids in vitro
and on the fimction of animal and human organs in vivo.
1.2 PHYSICAL BASIS OF MAGNETIC RESONANCE
All isotopes with magnetic nuclei are capable of demonstrating the phenomenon of NMR.
In reality this means that nearly all elements possess at least one isotope amenable to study.
Of principal interest to the work in this thesis are the nuclei of hydrogen-1 (^H) and
phosphorus-31 (^*P). Other isotopes which may be employed in MR studies include carbon-
13 (^^C), nitrogen-15 (^^N) and fluorine-19 (^^), all of which can be induced to produce
radiofrequency (rf) signals in the presence of a strong magnetic field (Gadian, 1982).
It should be noted that the natural abundance in the human body of the isotopes, hydrogen-1
frequently occurring carbon isotope, carbon-12 (*^C), is not NMR sensitive. The isotope of
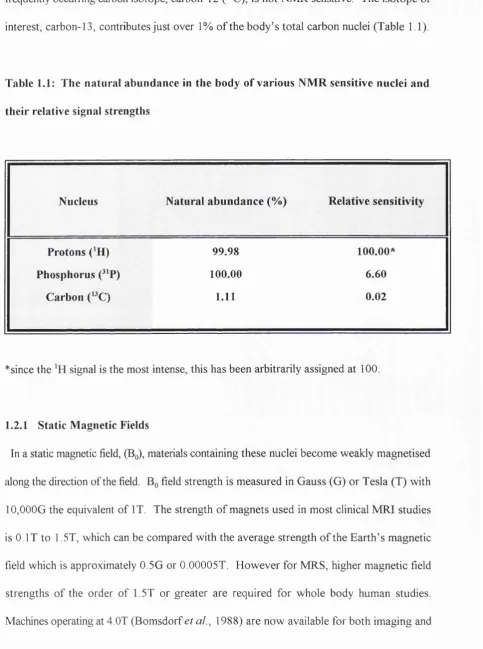
interest, carbon-13, contributes just over 1% o f the body’s total carbon nuclei (Table 1.1).
Table 1.1: The natural abundance in the body of various NMR sensitive nuclei and
their relative signal strengths
Nucleus Natural abundance (%) Relative sensitivity
Protons ( H) 99.98 100.00*
Phosphorus (^^P) 100.00 6.60
Carbon (»C) 1.11 0.02
* since the signal is the most intense, this has been arbitrarily assigned at 100.
1.2.1 Static Magnetic Fields
In a static magnetic field, (Bq), materials containing these nuclei become weakly magnetised
along the direction of the field. Bq field strength is measured in Gauss (G) or Tesla (T) with
10,000G the equivalent of IT. The strength o f magnets used in most clinical MRI studies
is 0. IT to 1.5T, which can be compared with the average strength o f the Earth’s magnetic
field which is approximately 0.5G or 0.00005T. However for MRS, higher magnetic field
strengths of the order of 1.5T or greater are required for whole body human studies.
spectroscopy in some centres such as Nottingham. With increasing magnetic field strength
better spectral resolution is obtained and in vitro MRS of body fluids is often performed at
up to 11.7T, far beyond the range of the wide-bore clinical systems employed in whole-body
human studies.
1.2.2 Time Dependent Fields
An NMR signal is generated by applying a second magnetic field, (BJ, which is orthogonal
to Bq and is also time dependent or oscillatory in nature. The peak field strength generated
in Bi is of the order of 50mT. Its effect is to rotate the direction of magnetisation from the
longitudinal axis of the magnet (along Bq) into the transverse direction. B^ is usually applied
in short pulses which rotate the magnetisation fi-om its preferred alignment along Bq :
rotations of 90° pulses orient the nuclei in the transverse plane; 180° pulses invert the
magnetisation. On termination of the B^ pulse, the magnetisation relaxes back to the original
longitudinal direction. The decay of this excitation is the source of the NMR signal, which
is modulated by the molecular environment of the MR sensitive nuclei under examination
(Gadian 1982) (Figure 1.1).
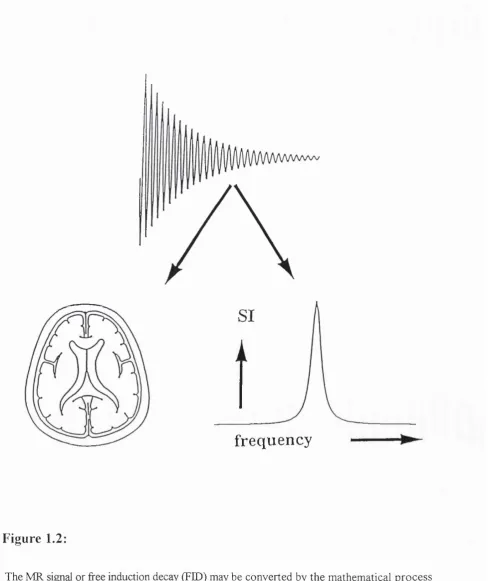
1.2.3 Fourier Transformation
The spectral or frequency content of the signal, known as the free induction decay (FED),
can be resolved by a mathematical process known as Fourier transformation (FT) into either
an image, providing anatomical information for magnetic resonance imaging (MRI) or a
frequency spectrum, providing biochemical information which is the basis of magnetic
resonance spectroscopy (MRS) (Becker and Fisk, 1987) (Figure 1.2). The electronic and
1.2.4 Local Magnetic Fields
The magnetic environment of the MR sensitive nuclei is dominated by the externally applied
fields, Bo and Bj, but also has contributions by electrons in molecular binding and by
neighbouring nuclei. These local magnetic fields determine the spectral appearance^ of the
MR signal, being responsible for the phenomenon of chemical shift and also the linewidths
or broadness of the resonances observed.
1.2.5 Chemical Shift
Whatever the chosen nucleus under MR examination, the nuclei from individual metabolites
and molecular groups resonate at a given frequency, depending on the molecular structure
or chemical environment of each compound or tissue, a phenomenon known as chemical
shift (Figure 1.3),The frequency is dependent on Bq, s o in order to be able to compare and
contrast data obtained on different magnets, MRS results are presented in terms of chemical
shift, expressed using the dimensionless unit, parts per million (ppm).
1.2.6 Relaxation Characteristics
The relaxation of the MR sensitive nuclei, following excitation by the B^ pulse may be
described by two processes, known as longitudinal and transverse relaxation. These are
characterised by the time constants T^ and T2 respectively.
Longitudinal relaxation, expresses the behaviour of magnetisation components along Bq
as the nuclei return to equilibrium following the termination of the applied Bj pulse. Before
the next rf pulse sequence is applied, these nuclei should be fully relaxed in order to obtain
difficult, because individual metabolites have different relaxation times (TJ.
Transverse relaxation expresses the loss in the transverse components of magnetisation
following the termination of a pulse. Stronger transverse relaxation causes the MRS
metabolite resonances to appear broader and thus the shorter the T2, the broader these MRS
metabolite resonances appear (Gadian, 1982).
1.3 MAGNETIC RESONANCE IMAGING
Conventional MRI employs the signal from only one MR sensitive nucleus, hydrogen-1,
present in body water and fat to demonstrate anatomy and structural pathology. The
signals are acquired in the presence of magnetic field gradients, which allow full spatial
localisation of the signal. These gradients, Gx, Gy and Gz, vary in three spatial dimensions:
the X axis (left to right or the transverse direction), y axis (anteroposteriorly or the sagittal
direction) and the z axis (longitudinally or the craniocaudal direction). The MR signals from
the different parts of the body area being imaged are encoded with spatial information, each
nucleus resonating at a slightly different frequency owing to the three dimensional
variation in magnetic field strength. This allows signal from different points to be assigned
to different pixels in the computer reconstructed image matrix.
The appearance of the MR image is dependent on the characteristics of the pulses used
to detect the signal. Series of Bj or “pulse sequences” can be altered to highlight different
anatomical structures preferentially and to provide a potent method of soft tissue image
contrast. On T^-weighted imaging, which emphasises differences in longitudinal relaxation,
tissues with a short such as fat appear bright, while tissues with a longer T^, such as
muscle appear darker. Using such B^ pulse sequences, fluids which are mobile and have a
dififerences are emphasised. Tissues with a short T2, such as muscle appear darker and those
such as bile or urine with a high signal intensity and a longer T2 are brighter.
1.3.1 Magnetisation Transfer
Magnetisation transfer (MX) is another mechanism for manipulating tissue contrast (Wolff
and Balaban, 1989). Tissue nuclei (protons) exist in two different compartments. The
first consists of fi"ee, mobile protons such as those in body water. As described above, these
nuclei have a relatively long relaxation times (Tj and T2) and provide the majority of the
signal which is detected by the conventional clinical whole body MR systems. The second
grouping of protons are those which are components of, or are bound to proteins, cell
membranes and other large macromolecules. These nuclei have a very short T2 and if
conventional MR imaging techniques are used, signal arising from these protons is not
directly detectable and is said to be MR invisible (Wolff and Balaban, 1989; Hajnal et al.,
1992). However, magnetisation can transfer between the bound and free protons.
Substantial changes in tissue contrast may be obtained by using pulse sequences which affect
the tissue bound protons, while leaving the fi-ee protons in the body water unaffected. This
involves the use of an off-resonance rf pulse which nullifies the magnetisation in the bound
proton pool, so that there is very little or no transfer of magnetisation from the bound nuclei
into the free proton pool in the body water. By this process, the apparent T^ of the free
protons is substantially reduced. Therefore these changes in tissue contrast may be used to
define anatomy and highlight pathological changes differently to standard MR sequences
1.4 MAGNETIC RESONANCE SPECTROSCOPY
Unlike MRI, MRS makes use of one of a number of other NMR sensitive nuclei. Currently,
and MRS are used in a wide variety of applications in the brain and ^ MRS for
fiinctional information on the liver, forming the basis for the work in this thesis. Signals from
compounds of concentrations of the order of 1-lOmM or greater are detected with these
MRS techniques.
Data from are often much more difficult to obtain, mainly because this nucleus has a
natural abundance of 1% of the body’s carbon, whereas the most abundant carbon isotope,
is NMR insensitive. Therefore, the signal intensity is weak, being of the order of
5,000 times less than that from body water (Table 1.1) and requiring magnets of increased
field strength (1.5 Tesla and above) to obtain the MR data. Naturally occurring ^^C is present
in high enough concentrations in adipose tissue for in vivo MRS (Moonen et a l, 1988;
Bryant et al, 1993), but most studies augment the NMR signal by using labelled tracers
such as glucose to follow metabolic pathways in vivo (Rothman et a l, 1992).
As with MRI, where tissue contrast may be highlighted by altering the characteristics of the
applied pulse sequences, editing of MR spectral appearances can also be achieved by B^
pulse sequence manipulation.
1.4.1 In vitro MR Spectroscopy
Body fluids and tissue extracts may be examined using in vitro MR spectroscopic
techniques at much higher magnetic field strengths than the wide-bore whole body clinical
systems used in vivo. The in vitro MR spectra are better resolved than those obtained from
whole body tissue at 1.5T, not only because of the higher fields, but also because samples are
well resolved spectra may therefore allow characterisation of the biochemical changes
observed in vivo.
1.4.2 Metabolite Quantification
The intensity of each metabolite signal is related to its concentration (Figure 1.3), but in
practice absolute quantification is difficult to achieve for a number of reasons. These include
both Ti and T2 effects. A more rigorous account is given by Bottomley (Bottomley, 1991).
Many in vivo MRS studies therefore report results in terms of metabolite ratios. Analysis
of the MR spectrum allows non-invasive insight into metabolite concentrations, intracellular
pH, the metabolic state of pathological tissue and also dynamic changes in the metabolism
of living tissue in both health and disease (Cady, 1990). However, only compounds present
in millimolar concentrations are detectable utilising in vivo MRS with the clinical MR systems
currently available. (Cady, 1990).
1.5 MAGNETIC RESONANCE METHODS
The hardware for an MR system includes a magnet, rf coils for transmitting and receiving the
rf signal, magnetic field gradients for anatomical signal localisation, a spectrometer and a
computer system for data collection and processing. The arrangement is essentially the same
for both MR spectroscopy and imaging and many systems operating at 1.5T and above are
equipped for both.
1.5.1 The Magnet
mostly been performed using horizontal bore magnets with a magnetic field strengths in the
range of 1.5 to 2.0T, but higher spectral resolution particularly for and MRS studies
has been demonstrated utilising 4T systems (Bomsdorf et a l, 1988; Barfuss et a l, 1990).
Vertical bore magnets with a field strength of 4.7 to 9.0 T are used for in vivo animal studies
on a routine basis, while in vitro MRS studies make use of field strengths of up to 11.7T for
fine spectral metabolite resolution of the components of tissue extracts or body fluids (Bell
e ta l , 1993).
1.5.2 RF Coils
The size and shape of the transmitter and receiver coil arrangements are usually governed
by the area of the body under examination. Thus specifically designed coils are available for
MRI and MRS examinations of the head and different areas of the body.
1.5.2.1 Transmitter Coils
The applied B^ pulse is usually provided by an enveloping transmitter coil, which
surrounds the patient in order to provide a uniform magnetic field and rf pulse angle
throughout the area of the body being studied. This is required for studies where the "field
of view" (FOV) is important, such as in MRI or in multivoxel MRS techniques, where
information fi-om different anatomical regions are collected simultaneously. All the work in
this thesis employs such techniques.
Some studies have however, employed a surface transmitter coil, which simply overlies the
area of the body under examination such as the liver. The magnetic field inhomogeneities that
result from this type of coil can be substantially improved by tailoring the rf pulse
1.5.2.2 Receiver Coils
The receiver coil consists of a conducting loop of wire, which is usually placed over the
surface of the body to pick up the rf signal from the patient. Electronic hardware amplifies
and processes the signal. Surface coils are very sensitive over a small region close to the coil.
In other words, their FOV is limited, because they acquire signal from only a restricted
volume of tissue. However, in many studies receiver coils have been combined with
enveloping transmitter coils to produce a transmit-receive system. Such arrangements are
user friendly and often make patient positioning easier.
1.5.3 The Computer System
The computer system is responsible for controlling the electronic hardware which produces
the pulse sequences used in both MR imaging and MR spectroscopy. It is also important for
the acquisition, processing and storage of the MR data acquired (Gadian, 1982).
1.6 THE PATIENT EXAMINATION
MRI and MR spectroscopy involve the use of high magnetic field strength superconducting
magnets, exposing patients to potential injury from items made of magnétisable material
(Kanal e ta l, 1990). It is therefore imperative to strictly exclude patients or staff members
with any form of loose metal from the vicinity of the magnet. Exclusion criteria must also
extend to individuals with cardiac pacemakers and ferrometallic implants such as surgical
clips. Exclusion criteria for research examinations also extend to pregnant women.
There is no ionising radiation involved and the magnetic fields strengths used in human
a rise in body temperature of more than 0.5°C. This has lead to guidelines limiting the
specified absorption ratio (SAR) experienced by human subjects. In the UK, the NRPB
guidelines are a body average SAR of 0.4W/kg and a peak of SAR of 4W/kg in any Ig of
tissue (Guidelines of the National Radiological Protection Board, 1991). All the studies
outlined in this thesis are within these NRPB guidelines.
1.6.1 Patient Positioning and Magnet Shimming
A typical clinical examination takes about one hour. The subject lies on a bed, while the
transmitter and receiver rf coils are positioned and is then moved into the bore of the magnet.
The region of interest should lie centrally in the magnet, where the Bq field is most uniform.
The magnetic field in the region of interest is then optimised for each patient, a process
known as shimming, which may take a few minutes.
Patient comfort is vital for the acquisition of good spectra. Discomfort is invariably
associated with movement, which causes distortions in the magnetic field, detuning of the rf
coils, and alterations in tissue content of the selected region of interest, resulting in poor
quality images and making MR spectral localisation artefacted.
1.7 DATA ACQUISITION
At the beginning of the MR spectroscopy examination, a series of MR images are usually
obtained to visualise the appropriate anatomy within the magnet coordinates. Signal
excitation is achieved by the application of a short rf pulse, the nature of which depends on
the frequency range of the nucleus of interest. The utilisation of magnetic field gradients
allows spatial localisation of spectra. Such techniques include single voxel methods such as
(Brown eta l, 1982; Hailes eta l, 1987). Signals from successive radiofrequency pulses are
added together or "averaged" in order to improve sensitivity. If absolute quantitation of
metabolites is to be achieved, the pulse repetition time (TR) needs to be 5 times longer than
the Tj. However, this is time consuming and extends the examination time considerably.
Therefore, with patient comfort in mind, a compromise TR value is normally used.
The time between signal excitation with the rf pulse and the start of data acquisition is
known as the echo time or TE. Ideally, the TE should be as short as possible so that no data
is lost, but in some sequences the TE is deliberately longer. To facilitate spatial localisation
with gradient pulses, the TE may have to be increased. In the case of proton spectroscopy,
longer TE also help to attenuate the strong signal from unwanted water and particularly lipid
resonances.
1.7.1 Spectral Analysis
The MR signal in the form of the FID is usually filtered to reduce noise levels and
contributions from broad overlapping resonances, before Fourier transformation to produce
a spectrum. The data obtained can be analysed to obtain relative or absolute concentrations
of metabolites, the individual resonances in each MR spectrum being examined by peak area
analysis using computer software. However, absolute metabolite quantitation is difficult to
achieve (Young et a l, 1989; Bottomley, 1991) and therefore peak areas are usually
referenced to an internal or external reference standard. An external reference consists of a
standard solution in a vial situated outside the body, but within the FOV of the transmitter
and receiver rf coil. An internal reference is a stable metabolite occurring naturally in the
tissue such as ATP. For in vitro MRS studies, compounds can be introduced into the tissue
1.8 References
Bailes, D R., Biyant, D.J., Bydder, G.M., Case, H A., Collins, A G , Cox, I.J., Evans, P R.,
Harman, R.R., Hall, A.S., Khenia, S., et a l (1987). Localised phosphorus-31 NMR
spectroscopy of normal and pathological human organs in vivo using phase-encoding
techniques. J. Magn. Reson. 74:158-170.
Becker, E D., and Fisk, C L. (1987). NMR: Physical principles and current status as a
biomedical technique. In Cohen SM (ed): Physiological NMR Spectroscopy: From Isolated
Cells to Man. Ann. New York Acad. Sci. 508:1-9.
Bell, J.D., Cox, I.J., Sargentoni, L, Peden, C.J., Menon, D.K., Foster, C.S., Watanapa, P.,
lies, R.A. and Urenjak, J. (1993). A ^^P and ^H-NMR investigation in vitro of normal and
abnormal human liver. Biochem. Biophys. Acta 1225: 71-77.
Bendall, M R., and Gordon, R E. (1983). Depth and refocussing pulses designed for
multipulse NMR with surface coils. J. Magn. Reson. 53: 365-385.
Bloch, F., Hansen, W.W., and Packard, M E. (1946). Nuclear induction. Physics Rev.
69:127.
Bomsdorf, H., Helzel, T., Kunz, D , Roschmann, P., Tschendel, O , and Wieland, J. (1988).
Spectroscopy and imaging with a 4 tesla whole-body MR system. NMR Biomed. 1: 151-158.
Brown, T.R, Kincaid, B.M., and Ugurbil, K. (1982). NMR chemical shift imaging in three
dimensions. Proc. Natl Acad. Scl 79: 3523-3526.
Bryant, D.J., Bell, J.D., Thomas, E.L, Taylor-Robinson, S.D., Simbrunner, J., Sargentoni,
I , Burl, M , Coutts, G A, Frost, G , Barnard, M L., Cunnane, S., and lies, R.A. (1993). ^^C
NMR analysis of adipose tissue composition in vegan subjects. Proc. 12th Ann. Mtg. Soc.
Magn. Reson. Med. 2: 1048.
Bottomley, P.A. (1991). The trouble with spectroscopy papers. Radiology 181: 344-350.
Cady, E.B. (1990). Clinical Magnetic Resonance Spectroscopy. Plenum Press, New York,
Gadian, D G (1982). Nuclear Magnetic Resonance and its Application to Living Systems.
Oxford: Clarendon Press.
Hajnal, J.V., Baudouin, C.J., Oatridge, A., Young, I.R., and Bydder, G.M. (1992). Design
and implementation of magnetization transfer pulse sequences for clinical use. J. Comput.
Assist. Tomogr. 16: 7-18.
Hoult, D.I., Busby, S.J.W., Gadian, D.G., Radda, G.K., Richards, R.E., and Seeley, P.J.
(1974). Observations of tissue metabolites using ^^P nuclear magnetic resonance. Nature
252: 285-287.
Kanal, E., Shellock, F.G., and Talagata, L. (1990). Safety considerations in MR imaging.
Radiology 176: 593-606.
Moonen, C.T., Dimand, R.J., and Cox, K.L. (1988). The non-invasive determination of
linoleic acid content of human adipose tissue by natural abundance ^^C nuclear magnetic
resonance. Magn. Reson. Med. 6: 140-157.
National Radiological Protection Board. (1991). Principles for the Protection of Patients and
Volunteers During Clinical Magnetic Resonance Diagnostic Procedures. Documents o f the
NRPB. Didcot. 2:1-29.
Ordidge, R.J., Connelly, A., Lohman, J.A.B., and Counsell, C. (1986). Localised chemical
shift measurements: image selected in vivo spectroscopy. J. Magn Reson. 6 6: 283-294.
Purcell, E.M., Torrey, H.C., and Pound, R.V. (1946). Resonance absorption by nuclear
magnetic moments in a solid. Physics Rev. 69:37-38.
Radda, G K , Rajagopalan, B., and Taylor, D.J. (1989). Biochemistry in vivo: an appraisal
Rothman, D L , Novotny, E.J., Shulman, G.I., Howseman, A.M., PetrofF, O.A.C., Mason,
G , Nixon, T., Hanstock, C.C., Pritchard, J.W., and Shulman, R.G. (1992). NMR
measurements of [4-‘^C]glutamate turnover in human brain. Proc. Natl. Acad. Sci. 89:9603-
9606.
Ross, B D., Radda, G.K., Gadian, D.G., Rocker, G , Esiri, M., and Falconer-Smith, J.
(1981). Examination of a case of repeated McArdle’s syndrome by^^P NMR. New Engl. J.
Med. 304:1338-1342.
Wolff, S.D., and Balaban, R.S. (1989). Magnetization transfer contrast (MTC) and tissue
water proton relaxation in vivo. Magn. Reson. Med. 10:135-144.
Young, I.R., Cox, I.J., Coutts, G.A., and Bydder, G.M. (1989). Some considerations
concerning susceptibility, longitudinal relaxation time constants and motion artifacts in vivo
Figure 1.1:
DIAGRAMMATIC REPRESENTATION OF THE PRINCIPLES OF MAGNETIC
RESONANCE:
a) MR sensitive nuclei possess the property of spin and when not subject to a
magnetic field, they precess randomly about their own axes.
b) When placed in a stationary magnetic field (Bq) these nuclei all realign along its axis.
c) When a radiofi*equency pulse is then applied, in the form of an oscillating
magnetic field (BJ, the MR nuclei are perturbed out of the original axis in (b) to
a new one.
d) At the termination of the radiofi’equency pulse, the nuclei return to their original
(a)
Stationary magnetic field
(b)
(c)
Oscillating m agnetic field
(d)
R eceiver coil
NMR sig n a l
frequency
Figure 1.2:
Figure 1.3:
DIAGRAM ILLUSTRATING THE PRINCIPLES OF CHEMICAL SHIFT;
a) All MR sensitive nuclei (protons) in a bottle of water are subject to the same
chemical environment. They therefore resonate at a uniform frequency and the
MR spectrum consists of only one peak.
b) However, MR sensitive nuclei in any more complicated compound resonate at
slightly different frequencies, which depend on the chemical structure of the
surrounding nuclei. For example, in a bottle of alcohol, there are three
resonances arising from the three parts of the chemical compound. Since there
are three times as many protons in the CH3- group as in the -OH group, the
m agnetic field
< — >
( — )
bottle containing w a te r
Intensity
A
m agnetic field
intensity
alcohol
A
S pectrum consists of
one line
Frequency F
Spectrum consists of
ttiree lines
Chapter 2
AN INTRODUCTION TO HEPATIC MAGNETIC
2. AN INTRODUCTION TO HEPATIC MAGNETIC RESONANCE SPECTROSCOPY
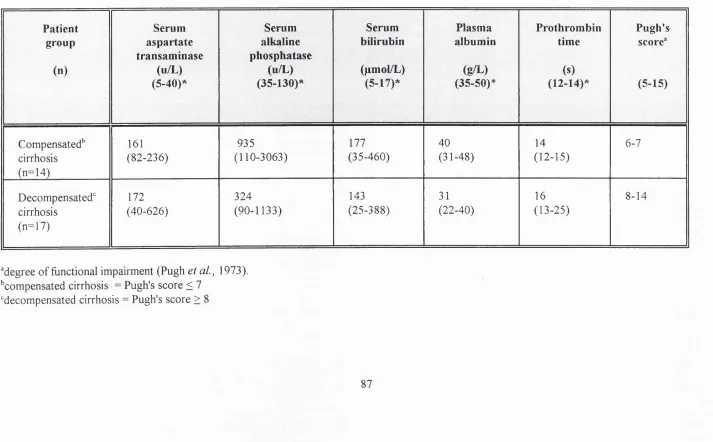
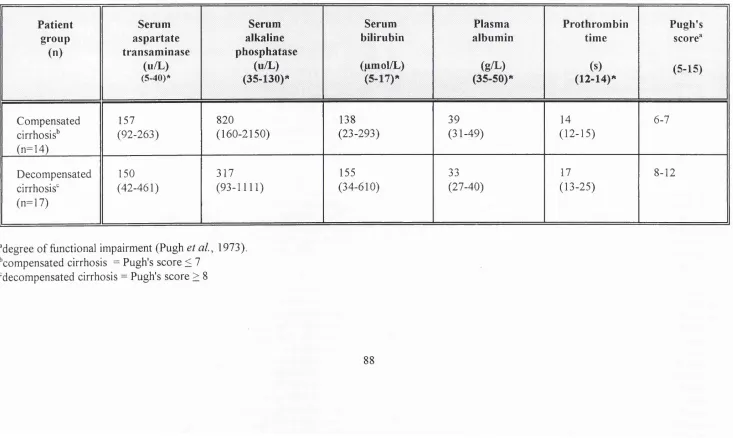
2.1 Measures of Hepatocellular Injury
Irrespective of the original causal agent, the liver responds to injury in broadly the same
way, with alteration both to its structural and functional organisation. The degree of injury
is conventionally assessed using tests which reflect its structure (tissue biopsy), cellular
permeability (serum transaminase concentrations) and synthetic activity (prothrombin time,
plasma albumin and serum bilirubin levels). The histological analysis of liver biopsy material
is useful diagnostically, but is a poor discriminant in the provision of prognostic indicators
of patient survival. The measurement of serum transaminases does not reflect the functional
capacity of the liver, while measures of synthetic activity are of limited value early in the
disease process, because of the large functional reserve of the liver. Furthermore,
considerable variation may occur in plasma albumin levels, depending upon the nutritional
state of the patient (Jalan and Hayes, 1995).
2.1.1 Dynamic Liver Function tests
Dynamic tests of liver function such as indocyanine green clearance (Skak and Keiding,
1987), mono-ethyl-glycine-xylidide (MEGX) formation (Oellerich etal., 1991), galactose
elimination capacity (Aebli and Reichen, 1991), antipyrine clearance (Homeida et a l, 1979),
the aminopyrine breath test (Villeneuve et a l, 1986) and caffeine clearance (Renner et a l,
2.1.2 The Child-Pugh Scoring Systems
The most widely used index of the functional severity of chronic liver disease is the Child
classification or its modifications (Child and Turcotte, 1964; Pugh et a l, 1973). This
scoring system is based upon a collection of laboratory parameters and subjective clinical
findings, which are dependent on a number of extra-hepatic influences including patient
treatment. These make it an imprecise model in predicting outcome in individual patients.
2.2 Hepatic MR Spectroscopy
In vivo hepatic magnetic resonance spectroscopy (MRS) is a non-invasive technique, which
can be used to study metabolic processes in man. Phosphorus-31 has been the most widely
applied nucleus in MRS studies of the liver, providing information on intracellular
concentrations of metabolites critical to cell function. Signals firom metabolites which reflect
rates of cell membrane synthesis and breakdown and also cellular energy states can be
obtained using ^^P MRS (Bottomley, 1989; Aisen and Chenevert, 1989).
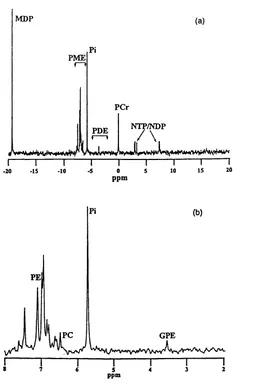
2.2.1 The In Vivo Phosphorus-31 MR Spectrum
The ^^P MR spectrum acquired from the liver of a healthy volunteer in vivo contains six
major resonances, representing the phosphomonoesters (PME), inorganic phosphates (Pi),
phosphodiesters (PDE) and the a , p and y moieties of the nucleotide triphosphates (NTP)
(Cox et al., 1992). Analysis of these resonances provide information on cellular
bioenergetics and intracellular pH (Taylor et a l, 1983) the metabolism of membrane
phospholipids (Ruiz-Cabello and Cohen, 1992) and carbohydrates (Dagnelie et a/., 1992) and
The PME, PDE and NTP resonances are multicomponent and the constituents are not fully
separable at the magnetic field strengths employed in human in vivo MRS studies, despite the
use of proton-decoupling techniques. Changes in these resonances may be related to
alterations in the levels of a number of metabolites (Cox e ta l, 1991).
2.2.2 Hepatic Energy Status and Measurement of Intracellular pH.
Alterations in the hepatic energy state is reflected by changes in the absolute quantity of
high energy phosphates and also the MRS ratio of NTP to either the total phosphate
metabolites measured or to inorganic phosphate. It should be noted that the NTP resonances
are not composed solely of adenosine triphosphate (ATP), but are also contributed to in part
by uridine triphosphate and guanosine triphosphate (lies et a l, 1985). The a NTP resonance
also contains contributions from a adenosine diphosphate and nicotinamide adenine
dinucleotide, while the y NTP resonance contains a contribution from P ADP.
An assessment of intracellular pH can be made indirectly as the chemical shift of Pi is
dependent upon the pH (Cohen et a l, 1982). However, not all of the intracellular inorganic
phosphates are MR visible, owing to binding of Pi in the mitochondria (lies et a l, 1985).
2.3 Hepatic Phosphorus-31 MR Spectroscopy in Chronic Liver Disease
Although a number of studies have been performed to evaluate the role of ^^P MRS in the
assessment of the severity and prognosis of chronic liver disease, the results are not directly
comparable because most studies were small, the populations of patients examined were
heterogeneous and the MRS methods employed varied widely.
was increased by 25% and the mean PDE/ATP was reduced by 12% (Meyerhoff et al.,
1989), while Angus and colleagues studied five abstinent patients with alcoholic cirrhosis,
with no significant change in the PME/ATP and PDE/ATP ratios reported. Like the previous
study, the mean PDE/ATP ratio was reduced by 12% (Angus et al., 1990).
Oberhaensli and colleagues found a significant reduction in the Pi/ATP ratio in three
patients with primary biliary cirrhosis (PBC), compared with healthy volunteers (Oberhaensli
et al., 1990), while Cox and colleagues reported a significant inverse relationship between
the PME/PDE ratio and albumin concentration in 25 patients with difiuse liver disease of
varying aetiology (Cox et a l, 1992).
None of these studies categorised patients according to the severity of liver injury.
However, Munakata and colleagues (Munakata et al., 1993) studied 14 abstinent patients
with alcoholic cirrhosis of varying functional grade, classified on the basis of both the Child's
grading system (Child and Turcotte, 1964; Pugh et a l, 1973), and the results of the
aminopyrine breath test (Villeneuve et a l, 1986). These authors showed a significant
relationship between the severity of liver disease and an elevation in the PME resonance,
expressed as a percentage of the total ^^P signal. A similar reduction in the PDE resonance
was observed in this group of patients, but this did not reach statistical significance.
The most definitive hepatic ^^P MRS study was performed by Menon and his colleagues,
comprising 85 patients with cirrhosis of differing disease aetiology and functional grade,
again classified according to the Child's grading system (Menon et a l, 1995). These
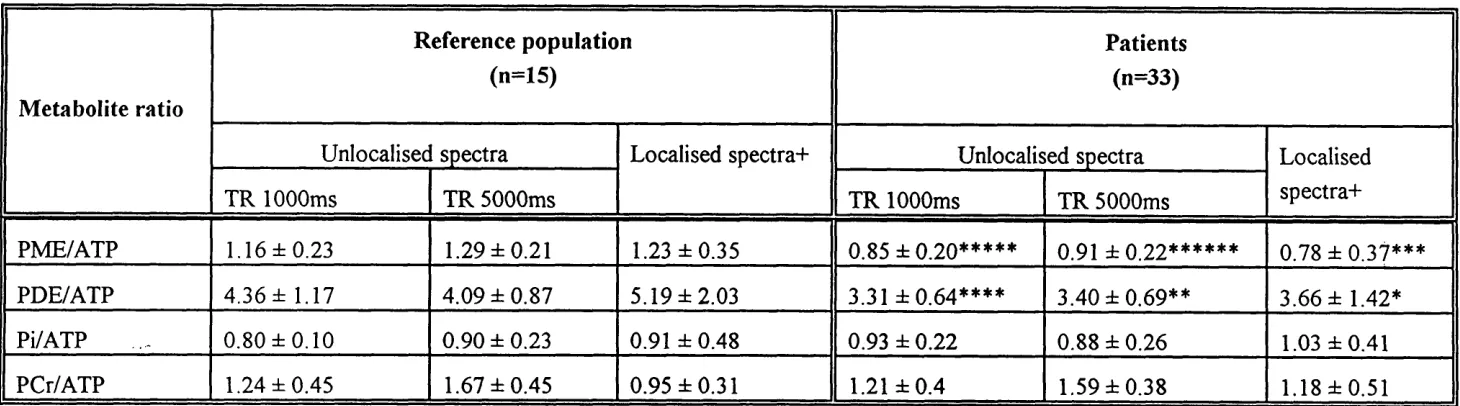
investigators demonstrated elevations in the PME/ATP and PME/PDE ratios, which
correlated directly with increasing functional severity of liver disease, while reductions in the
PDE/ATP ratio correlated inversely with these clinical indices. Differences were also
were only obvious in those with compensated liver disease, rather than with decompensated
disease. Therefore, in patients with hepatic injury in its early stages, post viral cirrhosis was
associated with a significant increase in the Pi/ATP ratio, alcoholic cirrhosis with reduced a
PDE/ATP ratio and primary sclerosing cholangitis (PSC) with a reduced Pi/ATP ratio,
compared with patients with other liver disease of similar functional severity.
2.3.1 Implications
These observations by Menon and colleagues have two important implications:
First, ^^P MRS may be used successfully as a diagnostic tool for assessment of the aetiology
of liver disease in the early stages and the results also suggest that the technique may be used
to predict patient outcome, because the changes in the ^^P MR spectrum correlate with the
severity of liver disease.
The second inference that may be made is that although liver diseases of varying aetiology
start differently, ultimately they produce the same end result in terms of functional injury in
the decompensated liver.
At the higher magnetic field strengths employed by in vitro MRS techniques, the
composite resonances observed in vivo may be fully defined. Therefore, further studies using
in vitro MR spectroscopy are required to define the biochemical changes underlying the in
2.4 Liver Transplantation
OLT is the treatment of choice for end stage liver failure, but up to 15% of recipients
subsequently develop chronic graft rejection. This is characterised by biliary stasis and
progressive loss of bile ducts (Wiesner et al, 1993). Early diagnosis is crucial for optimising
immunosuppression, which may arrest the pathological process that may otherwise ultimately
result in graft failure and retransplantation.
Liver biopsy is the diagnostic "gold standard", but because the liver may be affected
unevenly, serial biopsies are often required in order to observe the pathological changes with
any degree of confidence.
Phosphorus-31 MR spectroscopy may be of diagnostic potential in this clinical situation and
HEPATIC MAGNETIC RESONANCE SPECTROSCOPY
IN LIVER DISEASE:
2.5 AIMS
THE AIMS OF THIS STUDY WERE THREEFOLD:
1. To characterise the nature of the in vivo hepatic ^^P MRS abnormalities in chronic
liver disease using in vitro MRS techniques.
(The results o f this study are detailed in chapter 3).
2. To correlate in vivo hepatic ^^P MRS changes in patients with chronic liver disease
with in vitro MRS of liver extracts taken at the time of orthotopic liver
transplantation.
(The results o f this study are detailed in chapter 4).
3. To investigate the changes in ^^P MR spectra in patients postoperatively with good
allograft function and with chronic ductopenic rejection.
2.6 References
Aebli, W., and Reichen, J. (1991). The prognostic value of the serial determination of
galactose elimination capacity in chronic active hepatitis. Schweizerische Med. Wochensch.
121: 970-976.
Aisen, AT, and Chenevert, T.L. (1989). MR spectroscopy: Clinical perspective. Radiology
173:593-599.
Angus, P.W, Dixon, RM., Rajagopalan, B., Ryley, N.G., Simpson, K.J., Peters, T.J., Jewell,
D.P., and Radda G.K. (1990). A study of patients with alcoholic liver disease by ^^P nuclear
magnetic resonance spectroscopy. Clin. Sci. 78: 33-38.
Bottomley, P. A. (1989). Human in vivo NMR spectroscopy in biomedicine: clinical tool or
research probe. Radiology 170: 1-15.
Child C.G.III, and Turcotte, J.G. (1964). Surgery and portal hypertension. In: Child C.G.
m ed. The liver and portal hypertension. W.B. Saunders, Philadelphia, pp 50-68.
Cohen, R.D., Henderson, RM., Des, R.A, Monson, J.P., and Smith, J.A. (1982). Metabolic
acidosis. In: Ciba Foundation Symposium 84, Pitman, London, p20.
Cox, I.J., Coutts, G.A., Gadian, D.G, Ghosh, P., Sargentoni, J., and Young, I.R. (1991).
Saturation effects in phosphorus-31 magnetic resonance spectra of the human liver. Magn.
Reson. Med\l'.57>-6\.
Cox, I T, Menon, D.K., Sargentoni, J., Bryant, D.J., Collins, A.G., Coutts, G.A., Des, R.A.,
Bell, J.D., Benjamin, I S., GDbey, S., Hodgson, H.J.F., and Morgan, M.Y. (1992).
Phosphorus-31 magnetic resonance spectroscopy of the human liver using chemical shift
imaging techniques. J. Hepatol. 14: 265-275.
Dagnelie, P C , Menon, D.K., Cox, I.J., Bell, J.D., Sargentoni, J., Urenjak, J., and lies, R.A.
(1992). Effect of L-alanine infusion on ^^P magnetic resonance of the normal liver: towards
in vivo biochemical pathology. Clin. Science 83: 183-190.
Gupta, R.K., and Moore, R.D. (1980). P NMR studies of intracellular free magnesium in
Homeida, M., Roberts, C.J.C., Halliwell, M., et.al. (1979). Antipyrine clearance per unit
volume of the liver. An assessment of liver function in chronic liver disease. Gut 20:596-
601.
lies, R.A., Stevens, A.N., Griffiths, J R., and Morris, P.O. (1985). Phosphorylation status
of liver by ^^P NMR spectroscopy and its implications for metabolic control. A comparison
of ^^P NMR spectroscopy {in vivo and in vitro) with chemical and enzymic determinations
of ATP, ADP and Pi. Biochem. J. 229:141-151.
Jalan, R., and Hayes, P.C.(1995). Quantitative tests of liver function. Aliment. Pharmacol
Therapeut. 9:263-270.
Menon, D.K., Sargentoni, J., Taylor-Robinson, S.D., Bell, J.D., Cox I.J., Bryant, D.J.,
Coutts, G.A,, Rolles, K., Burroughs, A.K., and Morgan, M.Y. (1995). Effect of functional
grade and etiology on in vivo hepatic phosphorus-31 magnetic resonance spectroscopy in
cirrhosis: biochemical basis of spectral appearances. Hepatology. 21: 417-427.
Meyerhoff, D.J., Boska, M.D., Thomas, A.M., and Weiner, M.W. (1989). Alcoholic liver
disease: quantitative image-guided P-31 spectroscopy. Radiology 1989; 173: 393-400.
Munakata, T., Griffiths, R.D., Martin, P.A., Jenkins, S.A., Sheilds, R , and Edwards, R.H.T.
(1993). An in vivo ^^P MRS study of patients with liver cirrhosis: progress towards a non-
invasive assessment of disease severity. NMR Biomed. 6:168-172.
Oberhaensli, R., Rajagopalan, B., Galloway, G.J., Taylor, D.J., Radda, G.K. (1990). Study
of human liver disease with P-31 magnetic resonance spectroscopy. Gut 31: 463-467.
Oellerich, M., Burdelski, M., and Lautz, M. etal. (1991). Lidocaine metabolite formation
as a measure of liver function in patients with cirrhosis. Ther. Drug. Monit. 12: 219-226.
Pugh, R.N.H., Murray-Lyon, I.M., Dawson, J.L., Pietroni, M.C., and Williams, R. (1973).
Transection of the oesophagus for bleeding oesophageal varices. Br. J. Surg. 60: 646-649.
Renner, E , Weigholtz, H , Huguenin, P., Arnaud, M.J., and Preisig, R. (1984). Caffeine: A
Ruiz-Cabello, J., and Cohen, J. S.(1992). Phospholipid metabolites as indicators of cancer
cell function. NMR Biomed. 5: 226-233.
Skak, C , and Keiding, S. (1987). Methodological problems in use of indocyanine green to
estimate hepatic blood flow and ICG clearance in man. Liver 7:155-162.
Taylor, D.J., Bore, P.J., Styles, P., Gadian, D .G , and Radda, GK. (1983). Bioenergetics
of intact human muscle: a^^P nuclear magnetic resonance study. Mol. Biol Med. 1: 77-94.
Villeneuve, J.P., Infante-Rivard, C., Ampelas, M., et.al. (1986). Prognostic value of the
aminopyrine breath test in cirrhotic patients. Hepatology6: 928-931.
Wiesner, R.H., Ludwig, J., Krom, R.A.F., Hay, I.E., and van Hoek, B. (1993). Hepatic
allograft rejection: new developments in terminology, diagnosis, prevention and treatment.
Chapter 3
IN VITRO PHOSPHORUS-31 M R
SPECTROSCOPY OF
3. IN VITRO PHOSPHORUS-31 MR SPECTROSCOPY OF LIVER EXTRACTS
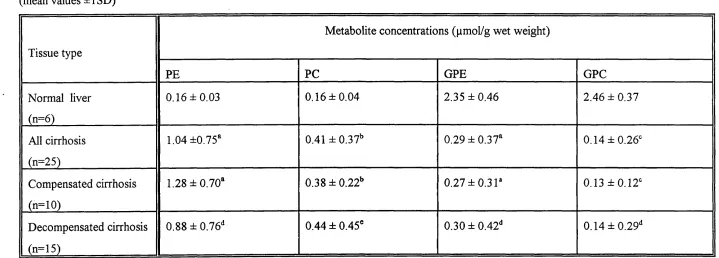
3.1 Abstract
Human livers with histologically proven cirrhosis were assessed using in vitro MR
spectroscopy. Spectra were compared with those from histologically normal livers and
showed significant elevations in phosphoethanolamine (PE) and phosphocholine (PC) and
significant reductions in glycerophosphorylethanolamine (GPE) and
glycerophosphorylcholine (GPC). There were no significant differences in spectra from
livers with compensated and decompensated cirrhosis. These results help to characterise
the alterations in membrane metabolism in cirrhosis of the liver.
3.2 Introduction
The human liver responds to injury in broadly the same way, irrespective of the original
causal agent (Sherlock and Dooley, 1993). Persistent alcohol abuse, viruses such as hepatitis
B and hepatitis C, genetic disorders including haemochromatosis, Wilson’s disease and cl
^-antitrypsin deficiency, cholestatic conditions such as primary biliary cirrhosis and primary
sclerosing cholangitis, certain drugs and autoimmune diseases all may provoke a series of
events that ultimately lead to cirrhosis or irreversible liver damage
(Erlinger and Benhamou, 1991).
Cirrhosis of the liver is a diffuse process, characterised by the formation of fibrous tissue
Current assessment methods of the functional state of liver injury in cirrhosis are not entirely
satisfactory, usually depending on a severity index obtained from a collection of laboratory
parameters and clinical findings (Pugh eta l, 1973; Albers et a l, 1989; Dickson et al., 1989).
Magnetic resonance spectroscopy is a non-invasive technique, which can be used to provide
localised biochemical information on hepatic metabolic processes in vivo. A typical MR
spectrum of the human liver in vivo contains resonances which may be assigned to
phosphomonoesters (PME), phosphodiesters (PDE), inorganic phosphate (Pi) and nucleotide
triphosphates (NTP) (Cox et at., 1988).
The PME and PDE resonances in hepatic spectra are multicomponent and the constituents
cannot as yet be completely resolved at the magnetic field strengths employed in human in
vivo MRS studies. The PME resonance includes contributions from cell membrane
precursors (Ruiz-Cabello and Cohen, 1992) and glycolytic intermediates (Bell et a l, 1993).
The PDE resonance is also composite, containing information from cell membrane
breakdown products (Ruiz-Cabello and Cohen, 1992) and from endoplasmic reticulum
(Murphy e/a/,, 1989).
Previous human in vivo MRS studies have reported on the elevation in PME/ATP and the
reduction in PDE/ATP with increasing fiinctional severity of cirrhosis (Munakata et al., 1993;
Menon et al, 1995). However, the underlying metabolic abnormalities responsible for these
observations have not been fully investigated.
In vitro MR spectroscopy techniques on human tissue extracts have been successfully used
to study the metabolite changes responsible for the in vivo PME and PDE signals in hepatic
tumours and normal liver (Bell et a l, 1993; Cox et a l, 1992a). However, no systematic
3.3 Aims
Therefore, the aim of this study was to characterise the metabolic changes observed by in
vitro MRS in cirrhosis of the liver. The results are discussed in the context of previous
in vivo hepatic MRS findings.
3.4 Materials and Methods
Standard percutaneous liver biopsies do not yield enough tissue for in vitro MRS studies,
and therefore samples of cirrhotic liver were taken during surgery for orthotopic hepatic
transplantation. Liver tissue was obtained from 25 patients with histologically proven
cirrhosis. Ten patients (40%) had primary biliary cirrhosis, seven (28%) post-viral cirrhosis,
six (24%) primaiy sclerosing cholangitis, one (4%) Wilson's disease and one (4%) alcoholic
cirrhosis.
The severity of liver dysfunction was assessed using the Pugh's score, obtained from clinical
and biochemical data, acquired on the day of liver transplantation. This is the standard
scoring system, which is used clinically, grading liver injury from 5 (best function) to 15
(worst function), taken fi*om information comprising serum bilirubin, plasma albumin levels,
prothrombin time and the presence/severity of ascites and hepatic encephalopathy (Pugh et
a l, 1973).
The 25 liver samples were categorised into two groups: functionally compensated cirrhosis
with a Pugh's score of less than or equal to 7 (n=10) and functionally decompensated
cirrhosis with a Pugh's score greater than or equal to 8 (n=15) (Table 3.1).
Permission for this study was obtained fi’om the Ethics Committees of the Royal
Postgraduate Medical School, London and the Royal Free Hospital and School of Medicine,
3.4.1 Sample Collection
Tissue samples were obtained from each of the 25 recipient livers. In every case, six to
eight representative sugar lump sized pieces of liver were freeze-clamped in liquid nitrogen
with minimum possible ischaemic time (2-7 minutes). This was performed ex vivo within 3
minutes of hepatectomy in 22 of the 25 cases. All samples were stored separately in a liquid
nitrogen dewar until further processed.
3.4.2 Reference Data
Reference data were obtained from wedge biopsy samples of liver, taken from six patients
undergoing laparotomy for surgical treatment of pancreatitis. In each case, contiguous
samples of liver tissue were found to be histologically normal on examination
(BdXetal, 1993).
3.4.3 Tissue Extract Preparation
The wet weight of each sample was between 560 mg and 2310 mg. Twelve per cent
perchloric acid (PCA) was added to the still-frozen samples, in a ratio of 5 ml/g of liver
tissue. Each sample was ground down under liquid nitrogen with a mortar and pestle and
then allowed to thaw, before centrifugation at 3000 rpm for 10 minutes. The supernatant
was separated, neutralized with 3 M potassium hydroxide, freeze-dried and reconstituted in
deuterium oxide. The pH was readjusted to 7.5, after the addition of 100, pmol of
ethylenediaminetetra-acetic acid (EDTA) to chelate any paramagnetic metal ions present.
Absolute quantification of metabolites was achieved by adding known amounts of methylene
diphosphonate (MDP) and/or phosphocreatine (PCr) to the perchloric acid extracts. These
3.4.4 In Vitro MRS Methods
All MR spectroscopy measurements were performed at room temperature. Proton-
decoupled MR spectra were obtained using a high resolution MR spectroscopy system
(operating at 11.7T), from the perchloric acid extracts of liver tissue, with 16K data points
and a 45° pulse angle applied at intervals of Is. Corrections for relaxation were made
using samples run with a repetition time of 20s. Metabolites were assigned using the
standard methods previously described (Bell et al., 1993); the chemical shift of each
metabolite was found and subsequently confirmed by the use of "spiking” with known
compounds.
3.4.5 Data Processing
The free induction decay (FID) was zero filled to 32K and Fourier transformed after line-
broadening of 5 Hz. Peak areas for PE, PC, GPE, GPC, MDP and/or PCr were obtained,
using theNMRl® spectral processing program (New Methods Research, Inc., E. Syracuse,
U.S.A.) on a SUN SPARCstation 10 (Sun Microsystems, Inc., Mountain View, CA, U.S.A.).
The data were fitted to Lorentzian functions.
3.4.6 Statistical Analysis
Since the data were not normally distributed, non-parametric statistical analysis was applied.
Values for metabolite concentrations in the patient and reference populations were compared
using the Mann Whitney U test. A p value of <0.05 was considered significant. All