40 ___________________________
M. Abou-Hamdan, K. Hamze, G. Al-Lakkiss, S. Farkh, Z. Zeaiter: Associate professors; M. Mortada: professor.
Lebanese University, Faculty of Sciences (I), Beirut, LEBANON.
e-mail: [email protected]
Phylogenetic Classification Of Bartonella Species
By Comparing The Two-Component System
Response Regulator Feup Sequences
Mhamad Abou-Hamdan, Kassem Hamze, Ghayath Al-Lakkiss, Samer Farkh, Mhamad Mortada, Zaher Zeaiter
Abstract: The bacterial genus Bartonella is classified in the alpha-2 Proteobacteria on the basis of 16S rDNA sequence comparison. The Bartonella two-component system feuPQ is found in nearly all bacterial species. We investigated the usefulness of the response regulator feuP gene sequence in the classification of 18 well characterized Bartonella species. Phylogenetic relationships were inferred using parsimony, neighbour-joining and maximum-likelihood methods. Reliable classifications of most of the studied species were obtained. Bartonella were divided into two supported clades containing two supported clusters each. These results were similar to our previous data obtained with groEL, ftsZ, and ribC genes sequences. The wide range of feuP DNA sequence similarity (78.6 to 96.5%) among Bartonella species makes it a promising candidate for multi-locus sequence typing (MLST) of clinical isolates. This is the first report proving the usefulness of feuP sequences in bartonellae classification at the species level.
Keywords: Bartonella, feuPQ, feuP, two-component system, phylogeny, response regulator, cluster, MLST.
————————————————————
INTRODUCTION
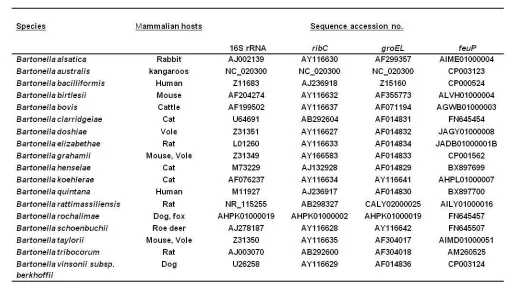
Bacteria within the genus Bartonella are Gram-negative, fastidious, aerobic, oxidase-negative, slow-growing in vitro, pleiomorphic organisms, belonging to the alpha-2 subgroup of the class Proteobacteria on the basis of their 16S rDNA sequences. To date, 31 Bartonella species have been officially validated [1,2], and many isolates have yet to be described [3,4]. These bacteria are specifically adapted to distinct mammalian reservoir hosts where they cause intra-erythrocytic infections [5]. Bartonella species infect a wide range of animal species, including domestic animals such as cats, dogs, rodents, rabbits and cattle as well as a diverse group of wild animals including wild cats, coyotes, deer, elks, foxes, insectivores, and bats (Table 1). These facultative intracellular bacteria, which are generally transmitted by blood-sucking arthropod vectors such as fleas, flies, lice, mites, and ticks [6], cause various clinical syndromes in immunocompetent and immunocompromised patients such as endocarditis, chronic bacteremia, bacillary angiomatosis, cat scratch disease, peliosis hepatis, and osteomyelitis [7]. To date, 11 Bartonella species have been described as human pathogens [8]. Because no distinguishing phenotypic characteristics have been described for Bartonella species, their identification and phylogenetic classification has been based mainly on genetic studies where PCR-derived assays and sequencing allowed detection, identification and classification of the bacteria directly from clinical samples. Many DNA regions and encoding gene sequences have been used in genetic studies: the 16S rRNA gene, the 16S–23S rRNA intergenic spacer region (ITS) [9], the citrate synthase gene (gltA) [10], the RNA polymerase beta subunit (
rpoB
) [11], the riboflavin synthase alpha chain gene (ribC) [12], the heat shock protein gene(groEL) [13], and the cell division protein gene (ftsZ) [14]. These sequences provided ―acceptable‖ evolutionary relationships between Bartonella species, individually [9-14] or in a concatenated form [15-16], much better than that provided by the 16S rRNA sequences whose usefulness were limited to the genus level [13-14]. Pathogen-host interactions during bacterial infection expose the bacterium to multiple physiological and biological stresses. Communication of environmental information (nutrient utilization, osmotic responses, anaerobiosis, chemotaxis, morphological differentiation, and host interactions) to the bacterial transcriptional apparatus is often mediated by two-component phosphotransfer systems found in nearly all bacterial species [17]. The feuPQ two-component system plays a role in ferric uptake regulation in Rhizobium leguminosarum and in Brucella suis [18-19] as well as in cyclic glucan export in Sinorhizobium meliloti [20]. In most cases, Bartonella infections of the reservoir host do not lead to disease symptoms suggesting a highly specific adaptation to the corresponding host niche. The feuPQ two-component system is present in all Bartonella sequenced genomes (Table 1) which may indicate its important role in the Bartonella-host adaptation process. Thus, we investigated in this study the usefulness of the two-component system regulatory protein feuP gene sequences in inferring the phylogenetic relationships within the Bartonella genus.
MATERIALS AND METHODS
1-Bartonella species feuP gene sequences retrieval: the
feuP gene sequence (ref: BH04710) of Bartonella henselae
Houston-1 strain was obtained from the Kyoto Encyclopedia of Genes and Genomes (http://www.genome.jp/kegg/). Than
feuP sequences were obtained from the NCBI Bartonella
(http://www.ncbi.nlm.nih.gov/genome/?term=bartonella) genome database: a blastn was conducted against 18
Bartonella species genomes and draft genomes using the BH04710 sequence as a query (Table 1).
2-Bartonella species 16S rRNA, groEL and ribC genes sequences retrieval: sequences were obtained from the NCBI nucleotide database and from the NCBI Bartonella
41 3-Sequences alignment and level of similarity
calculation: multisequence alignment was performed with CLUSTAL W software, version 1.81 [21].The number of base differences per site from between sequences was calculated by use of the MEGA6 software [22]. Level of DNA sequence
similarities (%) between Bartonella specieswas then manually calculated (Table 2). The overall mean distance for feuP
sequences was calculated with MEGA6 software and the discriminating power was then manually calculated.
4-PHYLOGENETIC ANALYSIS:
All evolutionary analyses were conducted in MEGA6 [22]. Bootstrap replicates (values obtained from 1000 trees) were performed to estimate the node reliability of the phylogenetic trees [23] obtained by three methods:4.1-Neighbor-Joining: The evolutionary distances were computed using the Maximum Composite Likelihood method [24] and are in the units of the number of base substitutions per site. The rate variation among sites was modeled with a gamma distribution (shape parameter = 5). The differences in the composition bias among sequences were considered in evolutionary comparisons [25]. All positions containing gaps and missing data were eliminated. The optimal tree was inferred using the Neighbor-Joining method [26]. The tree was drawn to scale, with branch lengths in the same units as those of the evolutionary distances used to infer the phylogenetic tree.
4.2-Maximum Likelihood: Initial tree(s) for the heuristic search were obtained by applying the Neighbor-Joining method to a matrix of pairwise distances estimated using the Maximum Composite Likelihood (MCL) approach. A discrete Gamma distribution was used to model evolutionary rate differences among sites (5 categories (+G, parameter = 0.3213)). All positions containing gaps and missing data were eliminated. The evolutionary history was inferred by using the
Maximum Likelihood method based on the Kimura 2-parameter model [27]. The tree with the highest log likelihood was shown and was drawn to scale, with branch lengths measured in the number of substitutions per site.
4.3-Maximum Parsimony: The MP tree was obtained using the Min-mini heuristic algorithm (pg. 128 in ref. [28]) with a search factor of 3. All positions containing gaps and missing data were eliminated. The consensus tree inferred from 8 most parsimonious trees was shown. Branches corresponding to partitions reproduced in less than 50% trees were collapsed. The consistency index was (0.446809), the retention index was (0.519630), and the composite index was 0.262596.
4.4-Evolutionary analyses of feuP amino acid sequences by Neighbor-Joining method: The evolutionary distances were computed using the JTT matrix-based method [29] and are in the units of the number of amino acid substitutions per site. The rate variation among sites was modeled with a gamma distribution (shape parameter = 5). All positions containing gaps and missing data were eliminated. Using the Neighbor-Joining method, the optimal tree with the sum of branch length = 0.90697688 was inferred. The tree was drawn to scale, with branch lengths in the same units as those of the evolutionary distances used to infer the phylogenetic tree.
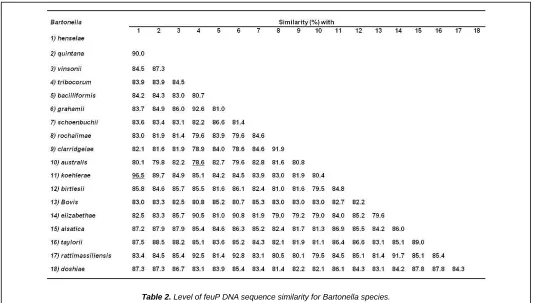
42 Table 2. Level of feuP DNA sequence similarity for Bartonella species.
RESULTS AND DISCUSSION
Levels of feuP DNA sequence similarities: Pairwise comparison of feuP DNA sequences (663 nucleotide positions) of 18 Bartonella species (Table 1) revealed a sequence similarity ranging from 78.6% (between Bartonella australis
and Bartonella tribocorum) to 96.5% (between Bartonella
koehlerae and Bartonella henselae) (Table 2). When compared to the sequence similarities of other genes of
Bartonella species available in GenBank, feuP sequence similarity was found to be similar to those of groEL (81.6 to 99.3%) and ribC (74.6 to 99.5%), and lower than that of the 16S rDNA (97.8 to 99.9%) (figure.3). In a previous work we proposed a multilocus sequence analysis based on 4 genes
and one intergenic spacer as a tool for the description of new
Bartonella species [12] where two of these markers, i.e., gltA
and rpoB, were particularly discriminatory. Bartonella isolates are considered as new species if they exhibit <96.0% and <95.4% sequence identity, respectively, with other validated species [12]. Our present data showed that the feuP gene has a discriminating power (84.1%) higher than those of the gltA
(93.6%) and rpoB (92.8%) genes [12]. Nevertheless, a low discriminating power value is not sufficient to ensure that two species are clearly differentiated where the minimal similarity (defined as the highest inter-species similarity score) must be less than 96% [12]. Our data showed that the minimal similarity value of feuP sequences was 96.5% which is very similar to the proposed value. Thus, the feuP gene sequences reveled to be a suitable tool for the detection, identification and classification of existing and new Bartonella species.
Bartonella
phylogeny
derived
from
feuP
sequences:
For each of the 18 Bartonella species, a sequence of 663 bp could be used for alignment and comparison. Evolutionary distances were computed using the Maximum Composite Likelihood method and the optimal tree was inferred using the Neighbor-Joining method (Figure 1.A). The reliability of tree branches and nodes was assessed with the bootstrap test where only values 90 were considered significant. Bartonella species were divided into 2 main cladeswith significant bootstrap values (100%). The same tree shown in a circular shape was drawn to show the clear division of
Bartonella species into 2 clades (Figure 1.B). The first clade contained 2 supported groups; (B. schoenbuchii and B. bovis; 100%) and (B. rochalimae and B. clarridgeiae; 100%); B. australis and B. bacilliformis who did not reliably cluster with any other species within this clade. The second clade contained two supported clusters: the first contained B. quintana, B. henselae and B. koehlerae (99%) where the last 2 species formed a reliable group (100%); and the second contained B. birtlesii, B. tribocorum, B. grahamii, B. elizabethae, and B. rattimassiliensis (96%) where the last 4 species formed a reliable group (100%). This second clade also contained Bartonella vinsonii, doshiae, alsatica, and
taylorii who did not reliably cluster with any other species within this clade. Another test was conducted to assess the robustness of these groups: the same tree was inferred as described above but with masking of the third nucleotide position in each codon. The resulting optimal Neighbor-Joining tree showed similar topology in general (Figure 2.D) except for
B. birtlesii, which will be discussed below. Thus, we can consider that the classification of the studied Bartonella
species using feuP sequences and via the Neighbor-Joining method as reliable. Bartonella phylogeny derived from feuP
Neighbor-43 Fig.1 (A) Neighbour-joining tree based on the feuP nucleotide sequences. The optimal tree with the sum of branch length = 1.23835487 is shown. The evolutionary distances were computed using the Maximum Composite Likelihood method. The rate variation among sites was modeled with a gamma distribution (shape parameter = 5). Positions containing gaps and missing data were eliminated. Bootstrap values at the tree nodes are based on 1000 replicates. (B) The same tree shown in a circular shape, only topology is depicted. Designations for species consist of the letter B (for Bartonella) and the following abbreviations: vins: vinsonii subsp. berkhoffii; trb:, tribocorum; eliz: elizabethae; grah: grahamii; tayl: taylorii; alsa: alsatica; dosh: doshiae; hens: henselae; quin: quintana; koeh: koehlerae; clar: clarridgeiae; birt: birtlesii; scho: schoenbuchii; baci: bacilliformis; bovi: bovis; aust: australis; ratt: rattimassiliensis; roch: rochalimae. Scale: number of substitutions per site.
Fig.2 Evolutionary history of Bartonella species based on feuP nucleotide and amino acid (AA) sequences using different methods. Trees were unrooted and only topology was shown. (A) Neighbor-Joining/Maximum Composite Likelihood; (B) Maximum Parsimony/Min-mini heuristic; (C) Maximum Likelihood/Kimura 2-parameter; (D) Neighbor-Joining/Maximum Composite Likelihood, with masking of the third nucleotide position in each codon; (E) Neighbor-Joining/JTT, amino acid sequences. Bootstrap values at the tree nodes are based on 1000 replicates.
Joining method (Figure 2.B). Maximum-Likelihood based tree also showed similar topology with except for B. birtlesii (Figure
2.C). The evolutionary analyses of feuP amino acid sequences were computed using the JTT matrix-based method and the optimal tree was inferred by Neighbor-Joining method, Bootstrap values 70 were considered significant. The
resulting classification of Bartonella species was similar to that obtained with nucleotide sequences analyses except for B.
birtlesii and B. bacilliformis (Figure 2.E). Thus, the overall feuP
sequences-derived phylogeny of the 18 studied Bartonella
species showed consistent pattern using several evolutionary models.
44 Fig.3 Comparison of neighbor-joining trees based on 16S rDNA, groEL, ribC and feuP partial, complete or concatenated sequences. Bootstrap values at tree nodes are based on 1000 replicates. Trees were unrooted, and only topology was shown. groEL, heat shock protein; ribC, riboflavin synthase; feuP, transcriptional regulator. Range of the level of DNA sequence similarity for each used gene is shown between brackets.
Bartonella species; where no clades were observed but only 2 supported groups were shown (B. schoenbuchii and B. bovis; 100%) and (B. rochalimae and B. clarridgeiae; 100%). The evolutionary relationships between the 14 remaining species were ambiguous. In the other hand, as we showed above, the
feuP-derived tree showed reliable classification of most of the studied species. Previously, we showed that the nucleotide sequences of the groEL and ribC genes were useful for
Bartonella phylogenetic studies [12;13]. Thus, we compared the feuP tree with the groEL and ribC trees. Evolutionary relationships between the studied species were similar in the three inferred trees (figure.3) except for B. birtlesii and B. taylorii; which may be due to host specificity and/or horizontal transfer of the feuP gene among species. Recently, many studies reported reliable classification of Bartonella species using concatenated sequences of several genes [15;16]. Thus, we investigated the usefulness of this method by inferring Neighbor-Joining based on 16SrDNA-groEL-ribC-feuP
concatenated sequences. The resulting tree showed a reliable classification of the studied Bartonella species similar to that obtained with the feuP derived sequences (figure.3). All these data prove the usefulness of the feuP gene in Bartonella
phylogenetic studies.
CONCLUSION
Bartonella species are transmitted by several arthropod vectors to a wide range of domestic and wild animal species. This diversity of hosts exposes Bartonella to multiple physiological and biological stresses. Two-component regulatory systems have evolved to allow bacteria to make adaptive responses to changes in their immediate
environment, and play a major role in virulence in many facultative intracellular pathogens. The role of Bartonella
feuPQ two-component system is not clear yet, but its presence in all species of this genus indicates its importance in the adaptation process to various external conditions. In the present study, the two-component system regulatory protein
feuP gene sequences were used to assess the classification of 18 well characterized Bartonella species. By comparing phylogenetic trees derived from 16S rDNA sequences, it was confirmed that this gene was unable to resolve the relationships within the genus Bartonella as most branches lacked statistical support. In contrast, trees generated using
feuP sequences were much more informative. All three phylogenetic analysis methods provided similar and reliable topologies. Bartonella species were distributed in 2 main clades containing four clusters supported by significant bootstrap values. Thus, the feuP gene presents a new tool for
Bartonella classification. Furthermore, the wide range of feuP
DNA sequence similarity (78.6 to 96.5%) among Bartonella
species makes it a promising candidate for multi-locus sequence typing (MLST) of bartonellae clinical isolates.
REFERENCES
[1] LPSN http://www.bacterio.cict.fr/b/bartonella.html. (29-09-2015).
45 isolated from wild Rodentia. Int J Syst Evol Microbiol.
63:1734-1740.
[3] Billeter SA, Hayman DT, Peel AJ, Baker K, Wood JL, Cunningham A, Suu-Ire R, Dittmar K, Kosoy MY., 2012.
Bartonella species in bat flies (Diptera: Nycteribiidae) from western Africa. Parasitology. 139:324-329.
[4] Kosoy M, Bai Y, Lynch T, Kuzmin IV, Niezgoda M, Franka R, Agwanda B, Breiman RF, Rupprecht CE., 2010.
Bartonella spp. in bats, Kenya. Emerg Infect Dis. 16:1875-1881.
[5] Dehio C., 2005. Bartonella-host-cell interactions and vascular tumor formation. Nat Rev Microbiol. 3: 621–631.
[6] Chomel BB, Kasten RW, Williams C, Wey AC, Henn JB, Maggi R, Carrasco S, Mazet J, Boulouis HJ, Maillard R, Breitschwerdt EB., 2009. Bartonella endocarditis: a pathology shared by animal reservoirs and patients. Ann N Y Acad Sci. 1166:120–126.
[7] Fournier PE, Lelievre H, Eykyn SJ, Mainardi JL, Marrie TJ, Bruneel F, Roure C, Nash J, Clave D, James E, Benoit-Lemercier C, Deforges L, Tissot-Dupont H, Raoult D., 2001. Epidemiologic and clinical characteristics of
Bartonella quintana and Bartonella henselae endocarditis: a study of 48 patients. Medicine (Baltimore) 80:245–251.
[8] Edouard S, Raoult D., 2010. Bartonella henselae, an ubiquitous agent of proteiform zoonotic disease. Med Mal Infect. 40:319–330.
[9] Houpikian P, and Raoult D., 2001. 16S/23S rRNA intergenic spacer regions for phylogenetic analysis, identification, and subtyping of Bartonella species. J. Clin. Microbiol. 39:2768–2778.
[10] Birtles RJ, and Raoult D., 1996. Comparison of partial citrate synthase gene (gltA) sequences for phylogenetic analysis of Bartonella species. Int. J.Syst. Bacteriol. 46:891–897.
[11] Renesto P, Gautheret D, Drancourt M, Raoult D., 2000. Determination of the rpoB gene sequences of Bartonellahenselae and Bartonellaquintana for phylogenic analysis. Res Microbiol. Dec;151(10):831-6.
[12] La Scola B, Zeaiter Z, Khamis A, Raoult D., 2003. Gene-sequence-based criteria for species definition in bacteriology: the Bartonella paradigm. Trends Microbiol. 2003;11:318–21.
[13] Zeaiter Z., Fournier PE, Ogata H, and Raoult D., 2002. Phylogenetic classification of Bartonella species by comparing groEL sequences. Int. J.Syst. Evol. Microbiol. 52:165–171.
[14] Zeaiter Z, Liang Z, Raoult D., 2002. Genetic classification and differentiation of Bartonella species based on comparison of partial ftsZ gene sequences. J Clin Microbiol. 40:3641-7.
[15] Gundi VA, Davoust B, Khamis A, Boni M, Raoult D, La Scola B., 2004. Isolation of Bartonellarattimassiliensis sp. nov. and Bartonella phoceensis sp. nov. from European Rattus norvegicus. J Clin Microbiol. Aug;42(8):3816-8.
[16] Engel P, Salzburger W, Liesch M, Chang CC, Maruyama S, Lanz C, Calteau A, Lajus A, Médigue C, Schuster SC, Dehio C., 2011. Parallel evolution of a type IV secretion system in radiating lineages of the host-restricted bacterial pathogen Bartonella. PLoS Genet. Feb 10;7(2):e1001296.
[17] Hoch JA and Silhavy TJ., 1995. Two-Component Signal Transduction. American Society for Microbiology, Washington, DC.
[18] Yeoman KH, Delgado MJ, Wexler M, Downie JA and Johnston AWB., 1997. High affinity iron acquisition in
Rhizobium leguminosarum requires the cycHJKL operon and the feuPQ gene products, which belong to the family of two-component transcriptional regulators. Microbiology. 143, 127-134.
[19] Dorrell N, Spencer S, Foulonge V, Guigue-Talet P, O'Callaghan D, Wren BW., 1998. Identification, cloning and initial characterisation of FeuPQ in Brucella suis: a new sub-family of two-component. FEMS Microbiol Lett. May 1;162(1):143-50.
[20] Griffitts JS, Carlyon RE, Erickson JH, Moulton JL, Barnett MJ, Toman CJ, Long SR., 2008. A Sinorhizobium meliloti
osmosensory two-component system required for cyclic glucan export and symbiosis. Mol Microbiol. 69:479–490.
[21] Thompson JD, Higgins DG, and Gibson TJ., 1994. CLUSTAL W: improving the sensitivity of progressive multiple sequence alignment through sequence weighting, position-specific gap penalties and weight matrix choice.
Nucleic Acids Res. 22:4673–4680.
[22] Tamura K, Stecher G, Peterson D, Filipski A, and Kumar S., 2013. MEGA6: Molecular Evolutionary Genetics Analysis version 6.0. Molecular Biology and Evolution. 30: 2725-2729.
[23] Brown JKM., 1994. Bootstrap hypothesis tests for evolutionary trees and other dendrograms. Proc. Natl. Acad. Sci. USA. 91:12293–12297.
[24] Tamura K, Nei M, and Kumar S., 2004. Prospects for inferring very large phylogenies by using the neighbor-joining method. Proc. Natl. Acad. Sci. USA. 101:11030-11035.
[25] Tamura K, and Kumar S., 2002. Evolutionary distance estimation under heterogeneous substitution pattern among lineages. Molecular Biology and Evolution. 19:1727-1736.
[26] Saitou N, and Nei M., 1987. The neighbor-joining method: A new method for reconstructing phylogenetic trees.
46 [27] Kimura M., 1980. A simple method for estimating
evolutionary rate of base substitutions through comparative studies of nucleotide sequences. Journal of Molecular Evolution. 16:111-120.
[28] Nei M, and Kumar S., 2000. Molecular Evolution and Phylogenetics. Oxford University Press, New York.