LOCATION BASED PREDICTIVE MODELLING OF
HANDOFF MANAGEMENT IN WIRELESS
NETWORK
Ms. Vandana Kaushik
1, Dr. J.S.Sodhi
2 1, 2ASET Amity University, (India)
ABSTRACT
Location based internet application has taken over as the internet become more mobile. When a mobile system
moves from one cell to another it is called handover or handoff, the cell handover all the information to the new
cell on which the mobile node is connected. There are many prediction schemes are already proposed to
perform the reservation of resource so as to reduce latency. Data can be hugely collected with the advancement
of wireless technology and positioning services. The trajectory patterns which are evoked from historical
trajectories of the objects which moving from one cell to another can tell the important information about the
behaviour for the location based services and for location prediction also. I propose in this paper a new
approach which uses constant trajectory figures or patterns to predict the current location. The proposed
method uses the line specification to simplify the trajectories making clusters out of them in spatio-temporal
regions. I analyzed that the method which I proposed is efficient enough for discovering trajectory pattern to
predict a near location accurately whether the query has been made for the same or not.
KEYWORDS: Trajectory Pattern, Spatio-Temporal Data Mining, Location Prediction
I. INTRODUCTION
There are much advancement going on in today’s life in positioning services and wireless technology. For e.g.
users who are having smart phones or the phones which are GPS enabled can log their positions on time interval
which is fixed in nature and transmit to the server, in fixed intervals, of wireless carrier. Location Based
Services which are reliable and having high quality, for e.g. managing the traffic on network or finding the
appropriate route or route system, requires the current as well as the future locations. Now if the current location
is not available of a moving object, an authentic method for predicting the location is required [1]. In the process
of handover a moving node is not able to send or receive any packet or message what so ever, so the packet loss
is likely to occur [2]. A huge amount of work has already been done in handover latency. The work is based
upon to reduce the delay in handover so that seamless handover can be achieved plus the user should not be
interrupted because of handover [3].
The wireless network is composed of various APs called cells. Each n every AP is given one channel to transmit
and broadcast an echo frame on this channel. So the mobile node can easily determine in which cell it is. The
movement of mobile node from one cell to another can be recorded in a database which is usually known as log
file [4]. In lieu of Ref [1, 3-6], data mining has been a new and potential approach to predict the mobility of
This paper will clearly define the prediction of a moving object with spatio and temporal attributes. Further this
paper is organized as: Part 2 indicates the related work on prediction of moving object. Part 3 will tell about the
architecture and the problem definition. Part 4 is the approached given by me. And lastly conclusion and
references.
II. RELATED WORK
There are various work has already been done on prediction of moving object. There are various techniques of
data mining that have been used to implement the prediction algorithm. The widely known technique of data
mining is sequential pattern. It is used to discover the trend [4-5] and also used to predict the customer or user
behaviour [7-8]. It is also used to determine the exact location of an object or guessing the next location also [9,
4]. The whole process is to extracting the pattern which is sequential in nature whose support exceeds a
predefined minimal support (suppmin) [10].
In another study by Yao [11] says that information extracted from spatio and temporal data will give better
prediction of events. Following are some related work which indicates the spatio temporal data mining based
movement prediction.
1. Temporal Weighted Mobility Rule [12] says that the mined mobility rules will be utilized in predicting the
next location of a mobile node. The proposed algorithm is implemented on various parameters.
2. Temporal moving pattern mining [13] says that the moving objects like individual user are represented in x
and y axis coordinates. Moving objects location is transformed into the area and by using of spatial
operation can get the related information.
3. Prediction Model for moving object [14] says that the location of a moving object can be predict through
trajectory pattern. These patterns allow us to predict accurate location of moving object.
III. ARCHITECTURE AND PROBLEM DEFINITION
3.1) Fig 1 shows the architecture of prediction management. It consists of 4 phases, database phase, mining
phase, rules generation phase and prediction phase.
Database Phase is divided into two parts. When a moving object sends or receives any data it will go into the log
file and then converts it into the transactional database.
Mining phase mines the frequent pattern.
Rules Generation Phase generates the mining rules.
3.2) Problem Definition
The problem of prediction in mobility in wireless based network on spatio temporal data mining is as defined:
Given a directed graph DG, a log of mobility, time gap or max_gap, minimum support min_supp, confidence
min_conf, the first phase which based on database, generate the transactional database from the history of log
file. Second phase is to identify all mobility patterns which are occurring frequently in transactional database
should also satisfy min_supp. Now the third phase is to generate all the rules which is used for a node mobility
and which should also be mined in the previous phase. In fourth and the last phase the mobility rule having the
maximum confidence value are used to predict the next cell.
IV. PROPOSED PREDICTIVE HANDOFF TECHNIQUE
The proposed handover scheme may used with any network although we use LTE (Long Term Evolution)
network to explain the scheme
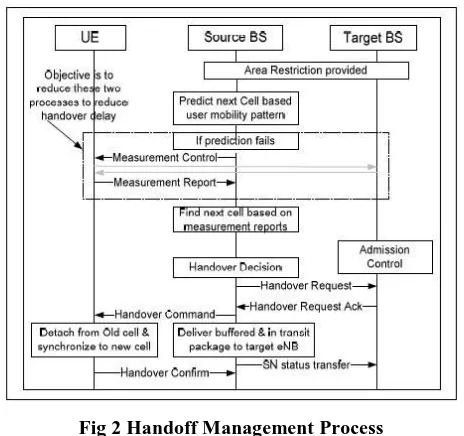
Fig 2 Handoff Management Process
Fig 2. illustrates the handoff procedure used in the proposed handoff scheme [15]. The proposed handoff
management system uses a prediction technique which tries to estimate the best handoff target cell and the best
handoff time for fast and seamless handoff. This prediction is based on the mobility pattern of the UE, which
has been recorded for certain time duration. MFNN (Multilayer Feed-forward Neural Network) with back
propagation algorithm is used as a predictive model to predict the best handoff target cell and best handoff time.
A prefix tree sequence mining algorithm (PTSMA) is applied on the raw data set to eliminate the outliers. This
refined data set is then given to MFFN for target cell prediction.
If a UE initiates connection to a BS, the BS checks whether that UE can connect to it or not. Checking is based
on area restriction information. If connection authenticates, the UE can connect to the BS and process will be
initiated. By the time the UE is connected, the BS will have information in which cell, the UE is likely to move
next and at what time. Also, when handoff is taking place from a BS to another BS, the prediction process will
be going to predict the UE’s next cell and handoff time. The technique which is proposed also has a backup
mechanism in case prediction fails. Prediction may fail when any of the following happens:
The predicted target BS is not in the neighbourhood of the source BS
Insufficient number of datasets to discover a pattern.
In above situations when prediction fails, the normal handoff procedure will continue as shown in Fig 2. The
source BS will take measurement reports from the UE and decides if handoff is required or not. If handoff is
required, the source BS will communicate with a target BS to which the UE has to be handoff and thus the
normal handoff procedure takes place. In case, the mobility pattern has changed, the new mobility pattern will
be learned by the predictive model so that it can predict a similar pattern later. Thus the system is flexible
enough to be trained dynamically.
V. DEVELOPMENT OF SUGGESTED LTE HANDOVER SCHEME
Our suggested handover scheme is applied on the broadband wireless networks. The aim of this scheme is to
reduce the delay incurred during handover to minimize call dropping and packet loss. In our suggested scheme
the source BS predicts the time state of the handover and initiates the handover procedure with the target BS.
The proposed scheme is based on the generation of mobility profiles using a statistical technique and using these
profiles to predict the handover of a UE using neural networks. The suggested handoff scheme involves the
following three steps, 1) input data preparation, 2) predicting target BS using MFFN, 3) initiating handover
procedures.
5.1) Creating MFFN Input Data
The generation of mobility profiles involves the collection of input data and eliminating outliers and less
frequent datasets. The input data collection and data reduction is done at the mobility management entity. The
reduced data is then sent to each BS which does the next cell prediction. To collect the input data, the data is
obtained from the mobility management entity by recording the entry time of a node and exit time of a node.
From this data the fix time (Fi) of a UE at each cell is calculated as
Fi = ExitTimecell-n – EntryTimecell-n
The collected input data over period of time will have the data of all visited BSs during a given period for a
particular UE.
Data is collected in a specific form which is given below
UE
id
CellId
1F1 CellId
2F2 CellId
3F4
Table: 1) Input data
Mobility pattern (Pn) is the history of recent movements’ pattern of a UE recorded over a period of time T
during which the UE is in active state. Let the mobility pattern Pn= {p1, p2,….pn} be recorded for a UE, where
pi indicates the movement of a UE during time period ti when the UE makes call. The mobility pattern Pn is
defined in terms of the cell number and the time duration in seconds spend in that cell. Pi is represented by a
pair (ci, ti). ci is the cell number where the UE for time duration ti. For example if there are 16 BSs in a region,
then ci є {1, 2, 3…..16}. If a UE is in cell 2 then ci=2; t2 is the time duration (in terms of seconds) a UE spends
in cell 2 while in active state.
If a pattern is of mobility is recorded for 3 transition (n=3) from cell 1 to cell 3 and the time recorded is 5 mins,
30 mins, 25 mins, then the pattern of mobility is
5.2) Predicting Target BS using Sequence Mining Algorithm
The objective of data preparation is to reduce the volume of the input data and prepare in the required format to
be put in MFFN. The task of sequence mining is to find out a set of shared attributes in a large number of
objects in a given database. Prefix tree Sequence Mining Algorithm is an algorithm that finds all the frequent
sequential patterns that satisfy a given length-decreasing support constraint. It is used as a row reduction
technique to reduce the number of rows in the dataset to be fed to the MFNN. The problem of finding frequent
sequences patterns given a constant minimum support constraint is defined as:
Given s sequential database D and a minimum support σ(0 ≤ σ ≤ 1) find all sequences each of which is supported by at least [σ|D|] sequences in D. Computationally efficient algorithms for finding frequent item sets
or sequences in very large data base is the essential characteristic of a sequence mining algorithm in this
context. Once we find that a sequence of length l is infrequent, we know that any longer sequences that include
these particular sequences cannot be frequent, thus can eliminate such sequences from further consideration.
This is the general principle of any prefix tree based sequence mining algorithm. The algorithm starts from the
root node and expands to create the children nodes that correspond to the frequent items as shown in Fig 3. Each
child node is recursively visited in a depth first order and expands to the child nodes that represent frequent
sequential patterns. Each node in the tree represents
a frequent sequential pattern. The relation between the sequential pattern represented at a particular node at level
k and that of its parent at level k -1 is that they share the same k -1 prefix. Thus the child's pattern is obtained
from the parent by adding one item at the end. For example if an itemset contains < (1), (2, 3)>, its parent node
is < (1), (2)>. At the root of the tree is the null sequence with no itemset.
5.3) Handover Procedure using MFNN
A multilayer perceptron is used in this model to create a predictive model. The MFNN model that is considered
for prediction consists of three layers: input, hidden and output. The number of neurons is chosen through
experimentation by trial and error to have more generalization capability for the MFNN model. Also, while
choosing the number of input and hidden layer neurons, care must be taken to avoid any under-learning or
over-fitting of the training data. For example, Table 2 below shows that the number of movements considered in the
input training data is 4, i.e. k = 4, and each movement Pj requires two quantities to represent cell number and
layer neurons for the above representation is equal to k=4. The number of neurons in the hidden layer depends
on the length of the sub-pattern and the number of subpatterns provided for training. The number of neurons in
the hidden layer is initially chosen to be 3. This is just a preliminary value and will be changed based on
requirements. The number of output layer neurons depends on the output movement parameters and their
representation. In this case, cell number and time are considered as the movement parameter. Hence, there are
two output neurons.
Sub
pattern
Input
1
Input
2
Input
3
Input
4
Input
5
1
P
1P
2P
3P
4P
52
P
2P
3P
4P
5P
63
P
3P
4P
5P
6P
7Table 2: Data Format for MFNN
The value of parameter is decided after trial and error. It is found that for the designed MFNN, the learning
Parameter (input layer to hidden layer) is set to 0.7 and the learning parameter (hidden layer to output Layer) is
set to 0.007. The activation function used is a tanh. The error tolerance is set to about 0.001. To avoid the
MFNN from getting stuck at local minima, numbers of iterations is chosen to be 20,000.
The mobility pattern of a UE travelled over a period of time is recorded and is processed to construct predictive
model for mobile movement prediction. If a UE is active and attached to a particular cell, the system predicts the
UE’s next possible cell location along with the amount of time likely to be spent in that cell based on previous
mobility pattern of that UE. Amount of time likely to be spent includes the handoff time and the duration for
which the UE stays in that cell. The process of predicting a UE’s next cell location is explained with the
following example. In this example, an array of 7 cells is considered, constituting the mobile network topology
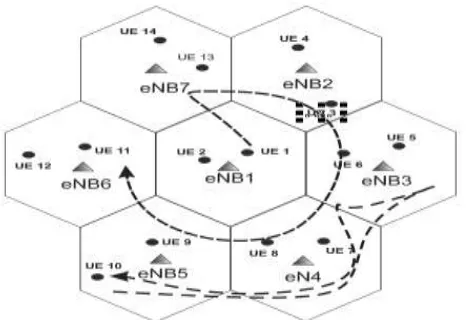
as shown in Fig. 4.
Fig 4 Structure of Cell with Node Movement
Also, it is assumed that a central BS is surrounded by the other 6 BSs. The BSs are assigned a BS number. In
this example, it is assumed that BS1 is surrounded by BS2-BS6. The UE movements are recorded in terms of
cell number and time spent in that cell at every handoff. The recorded mobile movements are pre-processed to
obtain the mobility pattern as described in section 4. B. From the cell-based mobility pattern, the pattern for
UE1 and UE10 are derived for prediction as follows. For UE1, the mobility pattern is
Pi = {(1, f1), (7, f2), (2, f3), (3, f4), (4, f5), (5, f6), (6, f7)}, with seven handoffs. For UE10, the mobility pattern
Pi = {(5, f1), (4, f2), (3, f3), (4, f4), (5, f5)}, with five handoffs.
By observing the patterns for each user, the corresponding sub patterns are obtained. These patterns are recorded
for certain duration of time. In the recorded patterns, many incomplete patterns or irrelevant data may be
present. These incomplete or irrelevant patterns are eliminated using prefix tree sequence mining algorithm.
These sub patterns are then used for training the predictive model. Consider UE 1 to extract the training data set
for the predictive model. The mobility pattern of UE1 is arranged in the form given in Table 2. It is arranged in
a form suitable for training the predictive model. This training data is fed to the predictive model. Here, Pattern
No.1 and Pattern No.2 are the training pattern while Pattern No.3 is considered as the test pattern. P1 to P4 are
fed as the input to the predictive model while P5 is considered to be the desired output. It is assumed that the
above 3 patterns has occurred many times in the recorded mobility history of UE 1. The network is trained using
a number of iterations until the error reduced below the error tolerance value of 0.001. The trained network is
tested on the testing data for prediction.
VI. ALAYSIS OF THE SUGGESTED HANDOFF SCHEME
Testing of the proposed Wireless handoff scheme is done for LTE Network [15] on ns2 simulator. All the
Wireless layers namely, PDCP, RLC, RRC, MAC, X2, S1 and
Physical are implemented on the ns2 simulator. The test scenario models a 7 cell hexagonal network model
where all the cells experience interference characteristics. All the BSs are connected to the gateway node via a
wired link. The experimental parameters are as given below in Table 3.
Parameter
Settings
Cell Radius
1.5 km
Speeds
Upto 100 km/hr
Mobility
Random
Cell
Deployment
7 cell ring
Experiment
Duration
250 sec
Table 3) Simulation Parameter
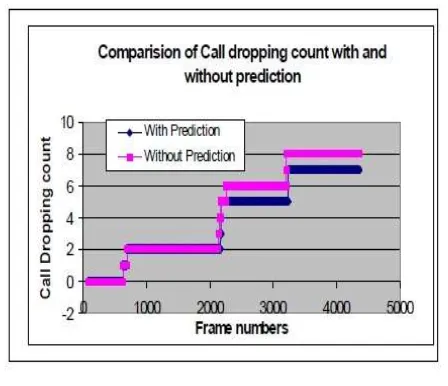
Figure 5 shows the cumulative call dropping count comparison with and without using Predictive model. As
shown in Figure 5, the prediction starts only when there is sufficient data that can be used for training the neural
network. Without using predictive model we see that call dropping count is higher compared to when predictive
model is used. The reason for this behavior can be attributed to overlapping cells where the UE is handed over
to any adjacent BS without being aware of the subsequent movement of the UE and resource availability at
target BSs. Using predictive model, the UE is handed over to the appropriate BS based on its trajectory. Thus
the number of handovers are reduced which in turn reduces call dropping. Here cumulative call dropping count
Fig 5 Call Drop With and Without Prediction Modelling
In Table 4 we present the data from our simulation. We define four parameters as given below:
TS: Average Time at which a UE is attached to source BS
TT: Average Time for which threshold level goes down below the handoff trigger threshold
TTR: Average Time at which UE is connected to target BS
TD: Average Handoff delay time
Time (m/sec)
With prediction
Without Prediction
UE TS
TT
TTR TD TS
TT
TTR TD
2
59
127 112
42
51
121 126
48
5
116 140 134
54
110 138 147
67
7
143 182 170
27
169 170 176
46
9
99
99
106
44
92
98
100
74
Table 4) Parameters Compared
Table 4 presents the data for different UE in the simulation experiment. From the table we can observe that the
reduction in handover delay with the predictive model.
Also the average dwell time of a UE at the BS increases with use of predictive model. We can observe that
while using the predictive model handover is performed early when compared to without using the scheme. This
enables to minimize call drop. In this current experiment e minimize the effect of false prediction by data
preparation process where inconsistent data is removed from the training data set.
VII. CONCLUSION
The handover procedure of wireless networks is successfully modified by adding a prediction model. A
Predictive Model based on data mining was designed and developed for making predictions about the next BS
Id as well as the optimal time for a proactive handoff to takes place. The average prediction accuracy was
measured to be around 84 %. It is said that the suggested method helps in reducing the time of handoff by
spirited performing the handoff. The system is able to predict the next best handoff cell location as well as the
best handoff time. The benefit of using the proposed data clean up method can be tested with a more complex
REFERENCES
[1] M. Morzy. “Mining frequent trajectories of moving objects for location prediction,” MLDM, volume 4571
of LNCS, pp. 667–680. Springer, 2007.
[2] Shilpy Gupta et al., An improved framework for enhancing QoS in MIPv6, International Journal on
Computer Science and Engineering 3 (2011).
[3] S.L. Menezes, Optimization of handovers in present and future mobile communication networks, Doctor
of philosophy in computer science, University of Texas at Dallas, 2010.
[4] G. Yavas, D. Katsaros et al., A data mining approach for location prediction in mobile environments, Data
& Knowledge Engineering 54 (2005) 121-146.
[5] A.E. Bergh, N. Ventura, Prediction Assisted Fast Handovers for Mobile IPv6, IEEE MILCOM 2006
Unclassified Technical Sessions, Washington D.C., 2006.
[6] C.H. Tran, V.T.T. Duong, Mobile IPv6 Fast Handover Techniques, in: The 13th International Conference
Advanced Communication Technology, 2011, pp.1304-1308, Korea.
[7] D. Taniar, J. Goh, On mining movement pattern from mobile users, International journal of distributed
sensor networks 3 (2007) 69-86.
[8] S.T. Vincent, W.L. Kawuu, Efficient mining and prediction of user behavior patterns in mobile web
systems, Information and Software Technology, Elsevier, 2006, pp. 357-369.
[9] J. Kang, A Frequent pattern based prediction model for moving objects, International journal of computer
science and network security 10 (2010).
[10] Q. Zhao, Mining Deltas of Web Structure: Issues, challenges and solutions, Ph.D. thesis, Nanyang
Technological University, available online at http://www.cais.ntu.edu.sg/qkzhao, 2003.
[11] X.B. Yao, Research Issues in Spatio-temporal Data Mining, workshop on Geospatial Visualization and
Knowledge Discovery, University Consortium for Geographic Information Science, Virginia, 2003.
[12] Thuy Van T. Duong and Dinh Que Tran, An Effective Approach for Mobility Prediction in Wireless
Network based on Temporal Weighted Mobility Rule, International Journal of Computer Science and
Telecommunications [Volume 3, Issue 2, February 2012]
[13] J.W. Lee, O.H. Paek, K.H. Ryu, Temporal moving pattern mining for location-based service, The Journal
of Systems and Software, Elsevier, 2004, pp. 481-490.
[14] Juyoung Kang and Hwan-Seung Yong A Frequent Pattern based Prediction Model for Moving Objects
IJCSNS International Journal of Computer Science and Network Security, VOL.10 No.3, March 2010