Fisheries
Long Term
Monitoring Program
Summary of freshwater survey results:
2000–2005
Queensland the Smart State
November
Queensland the Smart State
Fisheries
Long Term
Monitoring Program
November 2
007
Summary of freshwater survey
results: 2000–2005
Wayne Hagedoorn
Darren Smallwood
Department of Primary Industries and Fisheries Queensland
PR 07–3280
This document may be cited as:
Hagedoorn, W.L., and Smallwood, D.G. (2007). Fisheries Long Term Monitoring Program— Summary of freshwater survey results: 2000–2005. Department of Primary Industries and Fisheries, Brisbane, Australia.
Acknowledgements:
Special thanks goes to the many land owners for allowing staff access to the sampling reaches that are on their properties. Without their support the majority of the work would not have been possible.
The dedication of the Long Term Monitoring Team (north and south) members as well as other DPI&F staff involved in the surveys is gratefully appreciated: Chad Lunow, Terry Vallance, Sarah Kistle, Darren Rose, Sue Helmke, Vincent Brozek, Carissa Fairweather, Paul Thuesen, Steve Bailey, Andrew Kaus, Malcom Pearce, Lloyd Shepherd, Will Bowman, Joseph Sariman, Claire Van Der Geest, Sophie King, Jason McGilvray, Eddie Jebreen, Ian Breddin, Michael Hutchison, Ricky Midgley, Bart Mackenzie, Richard Marsh, Jonathan Yantsch, Jonathan Staunton-Smith, Darren Roy.
Thanks to Bob Mayer for help with data analyses, Joanne Atfield and Darella Chapman for assistance with design and editing, and to John Russell, Sue Helmke, Eddie Jebreen and Malcolm Dunning for reviewing the manuscript. Many thanks to Jeff Johnson from the Queensland Museum for his support in the identification of numerous fish samples.
General disclaimer:
The Department of Primary Industries and Fisheries (DPI&F) seeks to maximise the economic potential of Queensland’s primary industries on a sustainable basis.
While every care has been taken in preparing this publication, the State of Queensland accepts no responsibility for decisions or actions taken as a result of any data, information, statement or advice, expressed or implied, contained in this report.
© The State of Queensland, Department of Primary Industries and Fisheries 2007
Copyright protects this material. Except as permitted by the Copyright Act1968 (Cwth), reproduction by any means (photocopying, electronic, mechanical, recording or otherwise), making available online, electronic transmission or other publication of this material is prohibited without the prior written permission of the Department of Primary Industries and Fisheries, Queensland.
Inquiries should be addressed to:
Intellectual Property and Commercialisation Unit Department of Primary Industries and Fisheries GPO Box 46
Brisbane Qld 4001
Or
Contents
Acronyms iv
Summary 1
Long Term Monitoring Program background 2
Introduction 3
Objectives 4
Methods 4
Sites 4
Rivers 5
Reach selection and sampling 6
Times 6
On-site procedures 7
Species of interest 9
Data summaries and analysis 10
Data limitations 10
Results and discussion 11
Gregory River 11
Mitchell River 17
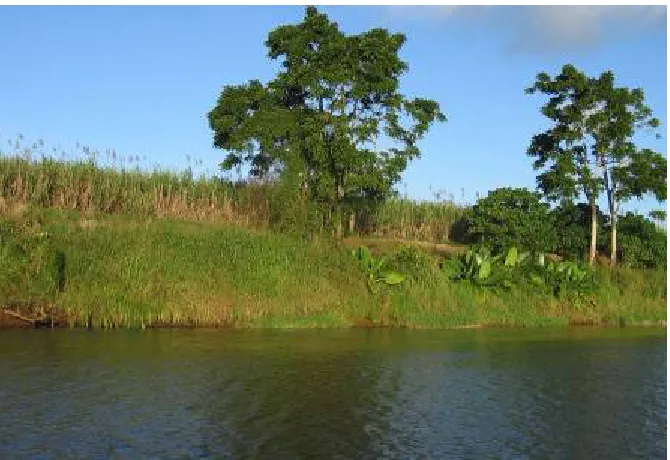
Daintree River 23
Johnstone River 30
Herbert River 37
Mary River 43
Noosa River 49
Logan-Albert River 55
Condamine-Balonne River 61
Warrego River 66
Conclusions 72
References 73
Acronyms
CPUE Catch per unit of effort
CREB Track Cairns Regional Electricity Board Track
DPI&F Department of Primary Industries and Fisheries, Queensland
LTMP Long Term Monitoring Program, DPI&F
Summary
This report is a summary of the data collected in the Fisheries Long Term Monitoring Program freshwater fish surveys from 2000 to 2005.
Queensland’s freshwater reaches contain a diverse array of freshwater fish fauna. Over 130 native species are recognised in north eastern Australia which is approximately half of the freshwater fish fauna of the Australian continent (Pusey et al. 2004).
The sustainability of freshwater fish is highly dependent on suitable riverine habitat as species diversity and populations are closely linked to habitat conditions. Exotic fish species including carp (Cyprinus carpio), tilapia (Tilapia, Oreochromis spp.) and mosquitofish
(Gambusia spp.) may compete with, or prey on, the eggs and juveniles of native species.
The Department of Primary Industries and Fisheries (DPI&F) Long Term Monitoring Program (LTMP) has monitored the freshwater fish of 10 river systems in Queensland since 2000. The program uses electrofishing sampling techniques to collect annual information on populations of key recreational, commercial and exotic fish species. The program also collects ancillary information on water quality and habitat conditions that may help to correlate changes in fish community structure.
Species diversity in most rivers has remained fairly stable throughout the period of the study. Six exotic fish species have been encountered, with goldfish, European carp and tilapia being of major concern to state agencies.
Long Term Monitoring Program background
The Department of Primary Industries and Fisheries (DPI&F), Queensland, manages the State’s fish, mollusc and crustacean species and their habitats. As part of this commitment, DPI&F monitors the condition of, and trends in, fish populations and their associated habitats. This information is used to assess the effectiveness of fisheries management strategies and helps ensure that the fisheries remain ecologically sustainable.
DPI&F uses the information to demonstrate that Queensland’s fisheries comply with national sustainability guidelines, allowing exemption from export restrictions under the Australian Government’s Environment Protection and Biodiversity Conservation Act 1999.
DPI&F initiated a statewide Long Term Monitoring Program (LTMP) in 1999, in response to a need for enhanced data used in the assessment of Queensland’s fisheries resources. The LTMP is managed centrally by a steering committee with operational aspects of the program managed regionally from the Southern and Northern Fisheries Centres located at Deception Bay and Cairns respectively. The regional teams are responsible for organising and undertaking the collection of data used for monitoring key commercial and recreational species, and for preparing data summaries and preliminary resource assessments.
A series of stock assessment workshops in 1998 identified the species to include in the LTMP. These workshops used several criteria to evaluate suitability including:
• the need for stock assessment • the suitability of existing datasets
• the existence of agreed indicators of resource status • the practical capacity to collect suitable data.
Resources monitored in the program include saucer scallops, spanner crabs, stout whiting, yellowfin bream, sand whiting, dusky flathead, rocky reef fish, eastern king prawns, blue swimmer crabs, sea mullet and tailor in southern Queensland; tiger and endeavour prawns and coral trout and redthroat emperor in northern Queensland; and mud crabs, barramundi, spotted and Spanish mackerel and freshwater fish throughout the state. Various sampling methods are used to study each species.
The LTMP collects data for resource assessment (ranging from analyses of trends in stock abundance indices to more complex, quantitative stock assessments) and management strategy evaluations.
Stock assessment models have already been developed for saucer scallops, spanner crabs, stout whiting, mullet, tailor, barramundi, tiger and endeavour prawns, redthroat emperor, and spotted and Spanish mackerel. In some cases management strategy evaluations have also been completed and the data collected in the LTMP proved integral to these activities.
The assessments and evaluations have allowed for improvements to the management of Queensland’s fisheries resources. Enhancements to ongoing monitoring have also been identified, particularly to address the increasing demand for high quality data for dynamic fish population models.
Introduction
Queensland’s freshwater reaches contain a diverse array of freshwater fish fauna. Over 130 native species are recognised in north eastern Australia which is approximately half of the fish fauna of the Australian continent (Pusey et al. 2004). In addition to these freshwater fishes, many other species from marine or estuarine families utilise freshwater riverine reaches of Queensland during some stage of their lifecycle. These include a number of fish species important to recreational, indigenous and commercial fishing, such as mullet (Mugilidae), barramundi (Centropomidae), mangrove jack (Lutjanidae), bigeye trevally (Carangidae), bream (Sparidae) and some sharks and rays (Carcharhinidae and Dasyatidae).
The sustainability of freshwater fish is highly dependent on suitable riverine habitat as species diversity and populations are closely linked to habitat conditions. Changes in the water quality or temperature of the river can stress fish populations and the loss of riparian and instream
vegetation can affect the habitat in which fish live. Barriers such as dams and weirs can impede migrations and movements of fish preventing spawning and access to food. Exotic fish species including carp (Cyprinus carpio), tilapia (Tilapia, Oreochromis spp.) and mosquitofish
(Gambusia spp.) may compete with, or prey on, the eggs and juveniles of native species.
The majority of recreational, indigenous and commercially important fish in rivers are from wild stocks. These fisheries are therefore dependent on the maintenance of viable river systems and the implementation of appropriate fishing regulations to ensure adequate recruitment of fish into the populations.
The Department of Primary Industries and Fisheries (DPI&F) Long Term Monitoring Program (LTMP) has monitored the freshwater fish of 10 river systems in Queensland since 2000. The program uses fishery independent electrofishing sampling techniques to collect annual information on populations of key recreational and commercial species.
The sustainability of native freshwater fish stocks is highly dependent on the condition of the freshwater habitat. The program collects ancillary information on water quality and habitat conditions, and this may help to correlate changes in fish community structure. Data collected may provide early warning on declines, or show increases in fish numbers. Trends in
abundance may be linked to changes in habitat, flow management, construction of fishways or introduction of fisheries regulations.
Objectives
The objectives of the freshwater monitoring program are to monitor selected rivers for changes in:
• species diversity and abundance
• length structure of key recreational and commercial species • occurrence of exotic fish species.
The objectives of this report are to provide a summary of:
• the methods used to conduct annual freshwater surveys
• the annual survey results from 2000 to 2005 including trends in the length and relative abundance of key commercial and recreational fish species for each river system, and trends in the water quality and habitat of each system.
Methods
For detailed sampling protocols see the document “Fisheries Long Term Monitoring Program Sampling Protocol – Freshwater: (2000 onwards) Section 1” DPI&F (2006).
Sites
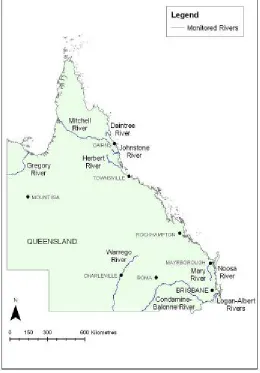
Figure 1. Location of river systems monitored by the Long Term Monitoring Program.
Rivers
The river systems were selected based on the following criteria: • level of recreational angling pressure
• importance to commercial fisheries in adjacent coastal/estuarine areas
• likelihood of changes in the near future (e.g. fishway installation, water infrastructure development)
• previous monitoring at established sites
• representative of a north east coastal, south east coastal, gulf or inland system • level of modification (at least one relatively unmodified river in each region was
chosen).
River systems chosen for monitoring include (Figure 1):
South east coastal drainage • Noosa River • Mary River
• Albert/Logan Rivers
West of the Great Dividing Range • Condamine/Balonne River • Warrego River
Gulf of Carpentaria drainage • Gregory River • Mitchell River
Reach selection and sampling
Sections of each river were selected that were navigable and fishable by an electrofishing boat and normally in the lower two-thirds of the river systems. On all river systems, reaches
upstream of any low weirs, which occasionally or regularly drown out, were included. Reaches upstream of major dams were included on the Condamine and Warrego Rivers as yellowbelly
(Macquaria ambigua), the main angler target species, may have self-sustaining populations
upstream of the major dams. However impounded waters, which inundate more than the width of the main river channel, were excluded. On coastal river systems, tidal freshwaterswere included if they were known to be consistently fresh. This was indicated by the presence of freshwater aquatic plants, including Vallisneriagigantea and by local knowledge.
Selected sections of each river were divided into two kilometre reaches and numbered from the source of the river. Random numbers were used to select seven sampling reaches on each river. If no access was available for a selected reach, the next upstream reach was used. Once reach selection was finalised, Global Positioning System (GPS) coordinates of the upstream and downstream limits were recorded. Reach locations were fixed for all sampling years. Reaches were divided into up to 80 shot locations, 50 m long, and numbered from upstream to downstream alternating from the left to right. Each year, six navigable shot locationswere randomly sampled within each reach.
Times
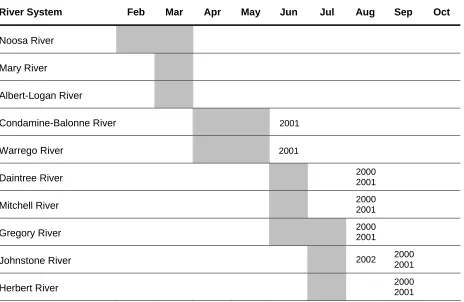
Table 1. Approximate survey times for the LTMP freshwater surveys in north and south Queensland between 2000 and 2005. Shading indicates the regular sampling periods, and years indicate when sampling has been conducted outside regular sampling times.
River System Feb Mar Apr May Jun Jul Aug Sep Oct
Noosa River
Mary River
Albert-Logan River
Condamine-Balonne River 2001
Warrego River 2001
Daintree River 2000 2001
Mitchell River 2000 2001
Gregory River 2000 2001
Johnstone River 2002 2000
2001
Herbert River 2000 2001
On-site procedures
Sampling is conducted using a flat bottomed electrofishing vessel. This method involves an electric current being passed through the water to temporarily stun fish. The current is adjusted at each reach for the prevailing temperature and conductivity.
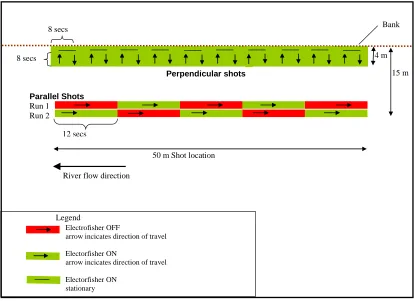
One standard electrofishing shot covers a 50 m section adjacent to the river bank, with total power on time of 5 minutes. Two parallel bank runs are conducted between 10 and 15 mfrom the bank or the edge of emergent vegetation, to ensure the capture of mid-water and pelagic species (Figure 2). The 50 m parallel runs are approximately one minute in duration and both are conducted travelling upstream from the same starting point. To minimise pushing fish ahead of the boat the electrofisher power is alternated on and off at 12 second intervals. Ten
perpendicular runs are then conducted, one at every five metres (Figure 2). During each run into the bank the boat travels four metres for eight seconds, pauses at the bank for
Figure 2. A standard shot, showing the two components: shots parallel and
perpendicular to the bank. During the parallel shot, two runs are made, alternating the sections run with the electrofisher on and off. During the perpendicular shot, the electrofisher remains on for the entire 24 seconds of each shot.
Stunned fish arecollected during and after electrofishing using soft-material dip-nets and are placed in an aerated holding tank. Abundance data are recorded for all species captured. The lengths of fish are also recorded for all commercial and recreational target species and exotic species.
Water quality is measured at the surface (0.5 m depth), with dissolved oxygen, temperature, salinity, conductivity, turbidity and pH being recorded with a digital analyser. In depths of more than three metres a bottom set of water quality measurements are also recorded. A Secchi depth reading is taken as a measure of water clarity.
For each shot location visual estimates are recorded of: • stream structure
• water level • river velocity • disturbance • riparian vegetation • stream habitat • bank habitat • substrate • riparian cover.
Further details of sampling procedures are documented in DPI&F (2006). Legend
Electrofisher OFF
arrow incicates direction of travel
Electorfisher ON
arrow incicates direction of travel
Electorfisher ON stationary
Parallel Shots
Run 1 Run 2
8 secs Bank
15 m
12 secs
50 m Shot location
River flow direction
4 m 8 secs
Species of interest
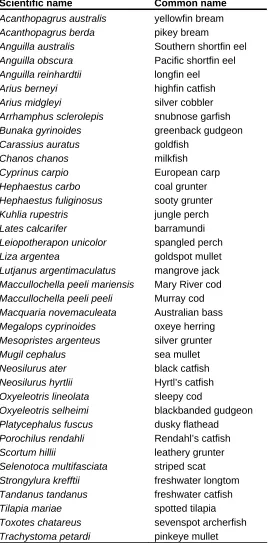
The target commercial, recreational and exotic species for which length and abundance information is collected each year are listed in Table 2.
Table 2. List of freshwater commercial or recreational target species and exotic species for which the Long Term Monitoring Program freshwater surveys collect length and abundance data.
Scientific name Common name
Acanthopagrus australis yellowfin bream
Acanthopagrus berda pikey bream
Anguilla australis Southern shortfin eel
Anguilla obscura Pacific shortfin eel
Anguilla reinhardtii longfin eel
Arius berneyi highfin catfish
Arius midgleyi silver cobbler
Arrhamphus sclerolepis snubnose garfish
Bunaka gyrinoides greenback gudgeon
Carassius auratus goldfish
Chanos chanos milkfish
Cyprinus carpio European carp
Hephaestus carbo coal grunter
Hephaestus fuliginosus sooty grunter
Kuhlia rupestris jungle perch
Lates calcarifer barramundi
Leiopotherapon unicolor spangled perch
Liza argentea goldspot mullet
Lutjanus argentimaculatus mangrove jack
Maccullochella peeli mariensis Mary River cod
Maccullochella peeli peeli Murray cod
Macquaria novemaculeata Australian bass
Megalops cyprinoides oxeye herring
Mesopristes argenteus silver grunter
Mugil cephalus sea mullet
Neosilurus ater black catfish
Neosilurus hyrtlii Hyrtl’s catfish
Oxyeleotris lineolata sleepy cod
Oxyeleotris selheimi blackbanded gudgeon
Platycephalus fuscus dusky flathead
Porochilus rendahli Rendahl’s catfish
Scortum hillii leathery grunter
Selenotoca multifasciata striped scat
Strongylura krefftii freshwater longtom
Tandanus tandanus freshwater catfish
Tilapia mariae spotted tilapia
Toxotes chatareus sevenspot archerfish
Trachystoma petardi pinkeye mullet
Fish species identification in the field and laboratory was facilitated by using several fish
Data summaries and analysis
Water quality results are presented with 95% confidence intervals.
The unit of effort that fish catch rate data are reported on relates to 30 minutes “on time” of electrofishing. This equates to the amount of electrofishing on time fished at each reach surveyed in this study. The application of on time is strictly regulated to standardise both the amount of power applied and the vessel and netter behaviour during the fishing period. This enables separate teams in different parts of the state to undertake a comparative sampling method.
In this summary report, average catch rates (catch per unit effort [CPUE] is the number of fish per 30 minutes of electrofishing on time) are calculated for each reach and averaged across the river for each year, together with length distribution of selected target species.
The Shannon Weaver diversity index (Zar 1984) was calculated for fish species caught during the electrofishing surveys. Diversity was compared between years for each river system.
Data limitations
Results and discussion
Gregory River
River description
The Gregory River is 397 km long, drains into the Gulf of Carpentaria, has a catchment area of 5517 km² and flows into the Nicholson River some 25 km upstream of Escott Station (Figure 3). Baseflows of the Gregory River are fed by spring water discharge from the sandstones and limestones that underlie the Barkly Tableland (Whitehouse, F. 1947). This is reflected in the water chemistry which has relatively high conductivity because of concentrations of bicarbonate ions in the waters.
Many of the reaches on this river are long narrow pools or sections of river with steep, undercut banks (Figure 4). A weir on the river at Escott Station provides a potable water source for the Burketown area. This weir creates a barrier to upstream fish movement at low to medium water levels, being passable for fish at high water levels. Low density cattle grazing occurs throughout the catchment.
Figure 4. Typical bank habitat sampled within the Gregory River.
Habitat
Riparian and in-stream habitat remains in excellent condition throughout the length of the river with disturbance ratings of undisturbed to low predominating (Figure 5). Stream bank
disturbance is chiefly attributed to bank erosion from seasonal high flows, and cattle and pig access. In-stream habitat consists of snags, some extensive areas of aquatic macrophytes, undercut banks, overhanging vegetation, root mass and a light coverage of leaf litter.
In 2002 aquatic macrophytes covered large sections of reaches 1 and 2 as is displayed in Figure 6 with the greater frequency of >200m2 coverage. Snags were present at almost all shot locations along with an overall light covering of leaf litter.
Figure 5. Stream bank disturbance ratings for the Gregory River between 2000 and 2005. The number of shot samples (n) are shown for each year.
Disturbance
n=42 n=42 n=42 n=42 n=41 n=41
0 20 40 60 80 100
2000 2001 2002 2003 2004 2005
Year
F
re
que
nc
y
(
%
) Extreme
High
Moderate
Low
Undisturbed
Figure 6. In-stream habitat parameters for the Gregory River including leaf litter, aquatic macrophytes and snag coverage. The number of shot samples (n) are provided for each year.
Water quality
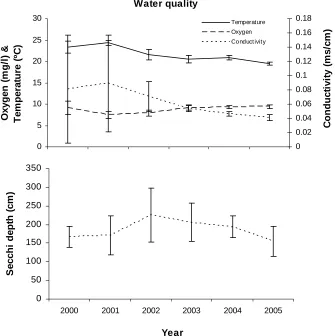
Water clarity in the Gregory River is usually good with turbidity decreasing toward the river source. The lowest mean visibility in Secchi depth of 288 cm was recorded in 2005 (Figure 7). The highest mean visibility across the years was 342 cm in 2002. The high concentrations of bicarbonate ions in the water (reflected in the high conductivity readings) form calcium deposits on the substrate and in-stream vegetation.
Spot sampling for temperature and conductivity suggests that values are fairly uniform from one year to another (Figure 7). Similarly, dissolved oxygen concentrations were relatively stable at between 7 to 8.5 mg L-1, levels that should pose no problems for resident fish populations (Figure 7).
Leaf litter
n=42 n=42 n=42 n=42 n=42 n=42
0 20 40 60 80 100
>200m2 151-200m2 101-150m2 51-100m2 1-50 m2 0m2 Unknow n
Series8
Aquatic macrophytes
0 20 40 60 80 100
Fr
e
que
nc
y
(
%
) >200m2
151-200m2
101-150m2
51-100m2
1-50 m2
0m2
Unknow n
Snags
0 20 40 60 80 100
2000 2001 2002 2003 2004 2005
Year
>200m2
151-200m2
101-150m2
51-100m2
1-50 m2
0m2
Figure 7. Water quality parameters for the Gregory River, including temperature, oxygen and conductivity (top) and Secchi depth measurements (bottom) between 2000 and 2005. Ninety-five percent confidence intervals are shown.
Fish fauna
There was generally a low catch rate (number of fish caught per sample location) for all reaches within this river (Table 3). The depth of pools (often over 4 m just off the bank)and excellent visibility may have decreased the effectiveness of the fishing method.
Sleepy cod (Oxyeleotris lineolata) were the most abundant species encountered across all years. The dominant sleepy cod size classes are from the 60–89 mm to 150–179 mm classes with a second notable size class of larger fish from 360 to 419 mm (Figure 9).
Water quality
0 5 10 15 20 25 30
O
x
y
g
e
n
(
m
g
/l)
&
T
e
m
p
er
atu
re (º
C
)
0 0.1 0.2 0.3 0.4 0.5 0.6 0.7 0.8
C
o
nduc
ti
v
it
y
(
m
s
/c
m
)
Temperature
Oxygen
Conduct ivity
0 100 200 300 400 500
2000 2001 2002 2003 2004 2005
Year
S
e
c
c
hi
de
pt
h (
c
m
Table 3. Fish catch rates (CPUE) in the Gregory River. Target species are highlighted in bold.
Year
Scientific name Common name 2000 2001 2002 2003 2004 2005
Ambassis agassizi Agassiz's glassfish 0.14
Ambassis agrammus sailfin glassfish 0.14
Ambassis macleayi Macleay's glassfish 0.57 1.74 0.43 1.73 0.71 1.72
Ambassis spp a glassfish 0.57 0.14 0.29 0.14 0.14 0.14
Amniataba percoides barred grunter 2.30 2.90 1.30 1.58 2.29 2.01
Arius berneyi highfin catfish 0.14
Arius graffei blue catfish 0.29
Arius leptaspis boofhead catfish 0.14
Belonidae - undifferentiated longtoms 0.14
Brachirus spp a freshwater sole 0.14
Craterocephalus stercusmuscarum flyspecked hardyhead 1.87 1.01 1.44 2.73 0.71 2.44
Craterocephalus stramineus blackmast 1.15 2.03 0.43 0.86 1.00 2.44
Eleotris melanosoma black spine-cheek gudgeon 0.14
Glossamia aprion mouth almighty 4.89 4.78 4.77 5.04 5.00 5.44
Glossogobius aureus golden flathead goby 0.14 0.43
Glossogobius giuris tank goby 0.57
Glossogobius spp a goby 1.01 1.74 0.87 0.72 1.57 0.43
Hephaestus carbo coal grunter 0.29 0.14 0.43
Hephaestus fuliginosus sooty grunter 1.29 0.87 0.58 0.29 0.14 0.43
Lates calcarifer barramundi 3.02 2.61 1.73 0.43 0.29 1.15
Leiopotherapon unicolor spangled perch 0.72 0.58 0.29 0.14
Melanotaenia fluviatilis Murray River rainbowfish 0.14
Melanotaenia inornata a rainbowfish 3.16 2.46 0.87 2.30 1.57 1.72
Nematalosa erebi bony bream 1.58 2.90 0.87 1.44 1.00 1.43
Neosilurus ater black catfish 0.43 0.43 1.16 0.58 0.57 0.29
Neosilurus hyrtlii Hytrl's catfish 0.14
Neosilurus spp a catfish 0.14
Oxyeleotris lineolata sleepy cod 10.20 22.01 11.41 10.79 9.72 10.17
Oxyeleotris selheimi blackbanded gudgeon 1.44 2.03 2.31 2.30 0.57
Porochilus rendahli Rendahl's catfish 0.14
Scortum hillii leathery grunter 0.29
Scortum ogilbyi Gulf grunter 0.14 0.14
Scortum spp a grunter 0.14
Strongylura krefftii freshwater longtom 0.72 0.58 0.29 0.14 0.86 0.29
Thryssa scratchleyi freshwater anchovy 0.29 0.14 0.57
Toxotes chatareus sevenspot archerfish 7.04 13.32 1.30 4.46 2.86 3.87
Toxotidae - undifferentiated archerfishes 0.29
0 0.5 1 1.5 2 2.5 3
2000 2001 2002 2003 2004 2005
Year
D
iver
si
ty
Figure 9. Length frequency distribution of sleepy cod (Oxyeleotris lineolata) in the Gregory River between 2000 and 2005.
Sleepy Cod 0 10 20 30 40 50 0 - 29
30 - 59
60 - 89
90 - 119
120 - 14
9 150 -
179 180
- 20 9 210
- 239 240 -
269 270
- 29 9 300
- 329 330
359 360
- 38 9 390
419 420
449 450
- 479 480
509 2000
n = 71
0 10 20 30 40 50
0 - 2930 - 59
60 - 89
90 - 11 9 120
- 149 150
- 179 180
- 20 9 210
- 239 240
- 269 270
- 29 9 300
- 329 330
359 360
- 389 390
419 420
449 450
- 479 480
509 2001
n = 152
0 10 20 30 40 50
0 - 2930 - 5960 - 89 90 -
119 120 -
149 150
- 179 180
209 210 -
239 240
- 269 270
299 300 -
329 330
- 35 9 360 -
389 390 -
419 420
- 44 9 450 -
479 480 -
509 F re quen cy ( % ) 2002
n = 79
0 10 20 30 40 50
0 - 2 9
30 - 59 60 - 89 90 - 11 9 120 -
149 150
- 179 180
209 210 -
239 240
- 269 270
299 300 -
329 330
- 35 9 360 -
389 390
- 419 420
- 44 9 450 -
479 480
- 509 2003
n = 75
0 10 20 30 40 50
0 - 2930 - 5960 - 89
90 - 11
9 120
149 150
- 17 9 180 -
209 210
239 240
- 26 9 270 -
299 300
329 330
- 359 360
389 390
- 41 9 420
- 449 450
479 480
- 50 9 2004
n = 68
0 10 20 30 40 50 0 2 9 30 59 60 89 90 119 120 149 150 179 180 209 210 239 240 269 270 299 300 329 330 359 360 389 390 419 420 449 450 479 480 509
Size class (mm)
2005
Mitchell River
River description
The Mitchell River has the second highest flow of any river in Australia. It has a catchment area of 7464 km2, stretching westward for 660 km from the peaks of the Great Dividing Range near Mareebato the Gulf of Carpentaria near Kowanyama (Figure 10). The Mitchell River catchment is subject to low intensity grazing in the mid and lower reaches with some high intensity
cropping in the upper reaches. The Mitchell River falls form a barrier for the upstream migration of catadromous (fish that live in freshwater but breed in saltwater) species such as barramundi, while small weirs in the upper catchment restrict fish passage during periods of low to medium flow and in some cases may prevent upstream movement all together. Much of the river is shallow and sandy with rock bars and many larger pools (Figure 11). Some of these pools have been selected as survey sites.
Figure 10. Location of the reaches sampled annually within the Mitchell River.
Habitat
Overall habitat condition is good with generally low ratings of stream bank disturbance ( Figure 12). Disturbance is generally from livestock and some erosion. In-stream habitat is plentiful but patchy, denoted by snags, rocks, some leaf litter and root masses (Figure 13).
Aquatic macrophytes are notably absent from the majority of shots within all reaches although there were occasional shots with a coverage of >200 m2 (Figure 13). In 2004 there were no aquatic macrophytes recorded. The absence of aquatic macrophytes may be due to the high flows and mobile sediments experienced during the wet season floods.
Figure 12. Stream bank disturbance ratings for the Mitchell River between 2000 and 2005. The number of shot samples (n) are shown for each year.
Disturbance
n=36 n=32 n=42 n=42 n=30 n=42
0 20 40 60 80 100
2000 2001 2002 2003 2004 2005
Year
Fr
e
que
nc
y
(
%
)
Extreme
High
Moderate
Low
Undisturbed
Figure 13. In-stream habitat parameters for the Mitchell River, including leaf litter, aquatic macrophytes and snag coverage. The number of shot samples (n) are provided for each year.
Water quality
Water quality in this river appeared to be good, with dissolved oxygen levels ranging between 7.1–8.9 mg L-1 (Figure 14). Water clarity was generally good with the lowest mean visibility (in Secchi depth) of 132 cm recorded in 2005 (Figure 14).
Leaf litter
n=36 n=32 n=42 n=42 n=30 n=42
0 20 40 60 80 100
2000 2001 2002 2003 2004 2005
>200m2 151-200m2 101-150m2 51-100m2 1-50 m2 0m2 Unknow n
Series8
Aquatic macrophytes
0 20 40 60 80 100
2000 2001 2002 2003 2004 2005
Fr
e
que
nc
y
(
%
) >200m2
151-200m2
101-150m2
51-100m2
1-50 m2
0m2
Unknow n
Snags
0 20 40 60 80 100
2000 2001 2002 2003 2004 2005
Year
>200m2
151-200m2
101-150m2
51-100m2
1-50 m2
0m2
Figure 14. Water quality parameters for the Mitchell River, including temperature, oxygen and conductivity (top) and Secchi depth measurements (bottom) between 2000 and 2005. Ninety-five percent confidence intervals are shown.
Fish fauna
The predominant recreational species that were encountered included sooty grunter, sleepy cod and sevenspot archerfish (Table 4). Other common non-target species included barred grunter, bony bream and rainbow fish.
Sleepy cod encountered throughout the years ranged in size from 30 mm to 479 mm with an absence of fish greater than 299 mm in 2004 (Figure 16).
Water quality
0 5 10 15 20 25 30
O
x
y
g
e
n
(
m
g
/l)
&
T
e
m
p
er
atu
re (º
C
)
0 0.02 0.04 0.06 0.08 0.1 0.12 0.14 0.16 0.18 0.2
C
onduc
ti
v
it
y
(
m
s
/c
m
)
Temperature
Oxygen
Conduct ivity
0 50 100 150 200 250
2000 2001 2002 2003 2004 2005
Year
S
e
c
c
hi
de
pt
h (
c
m
Table 4. Fish catch rates (CPUE) in the Mitchell River. Target species are highlighted in bold.
Year
Scientific name Common name 2000 2001 2002 2003 2004 2005
Ambassis agassizi Agassiz's glassfish 0.14
Ambassis agrammus sailfin glassfish 0.17
Ambassis macleayi Macleay's glassfish 0.69 0.19 0.72 1.86 0.20 2.44
Ambassis spp a glassfish 0.86 1.13 0.14 0.29 0.20 0.14
Amniataba percoides barred grunter 2.76 2.81 4.49 4.59 2.64 3.31
Anodontiglanis dahli toothless catfish 0.52 2.06 1.45 0.29 0.58
Arius berneyi highfin catfish 3.28 0.94 3.77 0.29 1.01
Arius graffei blue catfish 0.17 1.88 0.72 0.29 1.01 8.63
Arius leptaspis boofhead catfish 0.14
Arius midgleyi silver cobbler 4.49 0.94 3.62 1.86 2.84 0.86
Arius spp a fork tail catfish 0.17 0.19
Brachirus spp a sole 0.35 0.19 0.14
Clupeidae - undifferentiated herrings 0.17
Craterocephalus stercusmuscarum flyspecked hardyhead 0.35 0.75 1.30 1.72 1.62 0.86
Brachirus selheimi freshwater sole 0.17 0.38 0.87 1.00 0.61 0.58
Glossamia aprion mouth almighty 2.93 2.81 2.46 2.15 1.22 2.16
Glossogobius sp.1 [in Allen,1991] square blotch goby 0.29
Glossogobius spp a goby 2.76 3.75 3.91 4.44 4.47 3.45
Gobiidae - undifferentiated gobies 0.38 0.14
Hemiramphidae - undifferentiated garfishes 0.19
Hephaestus carbo coal grunter 0.00 0.19 0.14
Hephaestus fuliginosus sooty grunter 5.70 8.44 10.28 2.58 3.45 3.59
Lates calcarifer barramundi 2.24 1.13 4.49 0.72 0.20
Leiopotherapon unicolor spangled perch 8.80 12.94 5.94 5.59 22.33 9.49
Megalops cyprinoides oxeye herring 0.17
Melanotaenia inornata a rainbowfish 3.63 3.94 2.46 2.44 3.45 3.59
Melanotaenia splendida Eastern rainbowfish 0.17 0.29 0.57 0.14
Nematalosa erebi bony bream 4.66 3.19 3.33 3.44 1.83 4.74
Neosilurus ater black catfish 1.73 1.31 0.72 0.43 1.22 1.15
Neosilurus hyrtlii Hytrl's catfish 0.35 0.14
Neosilurus spp a catfish 0.86
Oxyeleotris lineolata sleepy cod 15.02 15.01 14.05 7.74 7.51 10.78
Oxyeleotris selheimi blackbanded gudgeon 0.69 0.94 0.29 0.43 0.14
Oxyeleotris spp a sleepy cod 0.19 0.14 1.15
Pingalla gilberti Gilbert's grunter 0.29 0.14 0.41
Porochilus rendahli Rendahl's catfish 0.17
Scortum hillii leathery grunter 2.07
Scortum ogilbyi Gulf grunter 2.03 2.15 0.61 1.73
Scortum spp a grunter 2.25
Strongylura krefftii freshwater longtom 0.69 0.38 0.43 2.29 0.81 1.29
Thryssa scratchleyi freshwater anchovy 0.19 0.14
Toxotes chatareus sevenspot archerfish 4.32 2.44 2.90 2.29 5.48 6.90
Toxotes jaculatrix banded archerfish 0.14
Zenarchopterus dispar Spoonfin River garfish 0.14
Zenarchopterus spp a garfish 0.19
0 0.5 1 1.5 2 2.5 3
2000 2001 2002 2003 2004 2005
Year
D
iver
si
ty
Figure 16. Length frequency distribution of sooty grunter and sleepy cod in the Mitchell River between 2000 and 2005.
Sooty Grunter 0 10 20 30 40 50 0 -29 30 -59 60 -89 90 -119 120 -149 150 -179 180 -209 210 -239 240 -269 270 -299 300 -329 330 -359 360 -389 2000 n = 33
0 10 20 30 40 50 0 -29 30 -59 60 -89 90 -119 120 -149 150 -179 180 -209 210 -239 240 -269 270 -299 300 -329 330 -359 360 -389 2001 n = 45
0 10 20 30 40 50 0 -29 30 -59 60 -89 90 -119 120 -149 150 -179 180 -209 210 -239 240 -269 270 -299 300 -329 330 -359 360 -389 F reque nc y ( % ) 2002 n = 71
0 10 20 30 40 50 0 -29 30 -59 60 -89 90 -119 120 -149 150 -179 180 -209 210 -239 240 -269 270 -299 300 -329 330 -359 360 -389 2003 n = 18
0 10 20 30 40 50 0 -29 30 -59 60 -89 90 -119 120 -149 150 -179 180 -209 210 -239 240 -269 270 -299 300 -329 330 -359 360 -389 2004 n = 17
0 10 20 30 40 50 0 2 9 30 59 60 89 90 11 9 120 14 9 150 17 9 180 20 9 210 23 9 240 26 9 270 29 9 300 32 9 330 35 9 360 38 9
Size class (mm)
2005 n = 25
Sleepy Cod 0 5 10 15 20 25 30
0 - 2930 -
59 60
- 89
90 -
119
120
- 149
150 - 17
9
180
209
210
- 23
9
240 - 26
9
270
299
300
- 32
9
330 - 35
9
360
389
390
- 41
9
420 - 44
9
450
479
480
- 50
9
2000 n = 87
0 5 10 15 20 25 30
0 - 2930 -
59
60 -
89
90 -
119
120
149
150
17 9
180
- 20 9
210
239
240
- 26
9
270
- 299
300
32 9
330
- 35
9
360
- 38 9
390
41 9
420
- 44
9
450
- 47 9
480
50 9
2001 n = 80
0 5 10 15 20 25 30
0 - 2930 -
59
60 -
89
90 -
119
120
149
150
17 9
180
- 20 9
210
23 9
240
26 9
270
- 29 9
300
32 9
330
35 9
360
- 389
390
41 9
420
- 44
9
450
- 479
480
50 9 F reque nc y ( % ) 2002 n = 97
0 5 10 15 20 25 30
0 - 2930 -
59
60 -
89
90 -
119
120
14 9
150
179
180
- 20 9
210
23 9 240 - 26 9 270
- 299
300
329 330 - 35 9 360 - 38 9
390
419 420 - 44 9 450 - 47 9
480
509
2003 n = 54
0 5 10 15 20 25 30
0 - 2930 -
59
60 -
89
90 -
119
120 - 14
9
150
179
180
- 20
9
210 - 23
9
240
269
270
- 29
9
300 - 32
9
330
359
360
- 38
9
390 - 41
9
420
449
450
- 47
9
480 - 50
9
2004 n = 37
0 5 10 15 20 25 30 0 2 9 30 59 60 89 90 11 9 120 14 9 150 17 9 180 20 9 210 23 9 240 26 9 270 29 9 300 32 9 330 35 9 360 38 9 390 41 9 420 44 9 450 47 9 480 50 9
Size class (mm)
Daintree River
River description
The Daintree River in the Wet Tropics of North Queensland flows uninterrupted for 118 km from its source in the Main Coast Range (Figure 17). It has a catchment area of about 1342 km2 with natural forests covering 94% of the total area, including wetlands and tropical rainforest (Russell
et al. 1998) (Figure 18). Agricultural land use is predominantly beef cattle grazing (3.25%) and
some sugar cane production (1.05%) in the lower catchment (Russell et al. 1998). Eco-tourism is a significant industry with companies operating river-boat tours year-round.
Sample reaches are grouped close together from the four lower, tidally influenced reaches accessed via the Daintree township boat ramp, to the three reaches above the Cairns Regional Electricity Board (CREB) Track crossing (Figure 17).
Figure 17. Location of the reaches sampled annually within the Daintree River.
Habitat
Overall river condition remains reasonable with disturbance indices mostly moderate or less than moderate (Figure 19). Disturbance ratings from moderate to extreme are mostly attributed to the lower four reaches. Disturbances include land clearing close to the main river channel, damage from livestock, feral pigs and some bank erosion. In-stream habitat remains plentiful including Vallisneria (eel grass) beds, snags, leaf litter, root mass and undercut banks.
Sites with heavy macrophyte coverage (>200m2) made up more than 20% of the assessments in 2002 and 2003 (Figure 20).
Figure 19. Stream bank disturbance ratings for the Daintree River between 2000 and 2005. The number of shot samples (n) are shown for each year.
Disturbance
n=42 n=42 n=36 n=42 n=42 n=36
0 20 40 60 80 100
2000 2001 2002 2003 2004 2005
Year
Fr
e
que
nc
y
(
%
) Extreme
High
Moderate
Low
Undisturbed
Figure 20. In-stream habitat parameters for the Daintree River, including leaf litter, aquatic macrophytes and snag coverage. The number of shot samples (n) are provided for each year.
Water quality
Water clarity was good with the lowest mean visibility of 131 cm in 2004. A rise in conductivity in 2004is the result of a salt wedge intrusion at the furthest downstream reach (Figure 21).
Aquatic macrophytes
0 20 40 60 80 100
2000 2001 2002 2003 2004 2005
Fr
e
que
nc
y
(
%
)
>200m2
151-200m2
101-150m2
51-100m2
1-50 m2
0m2
Unknow n
Leaf litter
n=42 n=42 n=36 n=42 n=42 n=36
0 20 40 60 80 100
2000 2001 2002 2003 2004 2005
>200m2 151-200m2 101-150m2 51-100m2 1-50 m2 0m2 Unknow n
Series8
Snags
0 20 40 60 80 100
2000 2001 2002 2003 2004 2005
Year
>200m2
151-200m2
101-150m2
51-100m2
1-50 m2
0m2
Figure 21. Water quality parameters for the Daintree River including temperature, oxygen and conductivity (top) and Secchi depth measurements (bottom) between 2000 and 2005. Ninety-five percent confidence intervals are shown.
Fish fauna
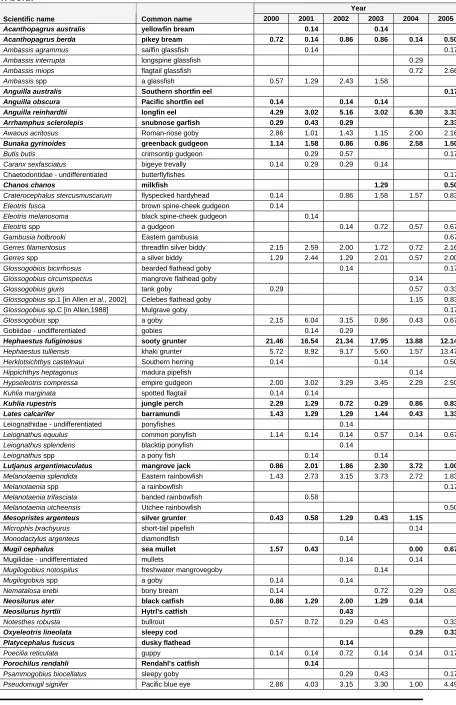
Target species of recreational, commercial or indigenous significance in the Daintree River included longfin eel, barramundi and mangrove jack (Table 5). Other common non target species were gudgeon, silver biddies and pacific blue eyes. The relatively high catch rates of barramundi, mangrove jack and longfin eel compared to other rivers in the survey may reflect both the abundance of prey fish and high incidence of in-stream cover the Daintree River provides. The high number of fish species encountered is probably a reflection of contributions from estuarine species present in the inter-tidal reaches surveyed, abundance of in-stream habitat and absence of natural or man made barriers to fish movement.
The majority of barramundi and mangrove jack captured are under the Queensland minimum legal size limit (580 mm and 350 mm respective Total Length) (Figure 23). Young-of-the-year cohorts for mangrove jack were particularly strong from 2002 to 2005.
Water quality
0 5 10 15 20 25 30
O
x
y
g
e
n
(
m
g
/l)
&
T
e
m
p
er
at
u
re (
ºC
)
-0.05 0 0.05 0.1 0.15 0.2 0.25 0.3 0.35
C
o
n
d
u
c
ti
vi
ty
(
m
s/
cm)
Temperat ure
Oxygen
Conductivit y
0 50 100 150 200 250 300
2000 2001 2002 2003 2004 2005
Year
S
e
c
c
hi
de
pt
h (
c
m
Table 5. Fish catch rates (CPUE) in the Daintree River. Target species are highlighted in bold.
Year
Scientific name Common name 2000 2001 2002 2003 2004 2005
Acanthopagrus australis yellowfin bream 0.14 0.15 0.50
Acanthopagrus berda pikey bream 0.14 0.34 0.87 1.17
Ambassis interrupta longspine glassfish 1.46 1.34
Ambassis miops flagtail glassfish 1.46 1.34
Ambassis spp a glassfish 1.42 2.45 1.86 2.03 0.17
Amniataba caudavittata yellowtail grunter 0.29
Anguilla obscura Pacific shortfin eel 0.14 0.14 0.34 0.15 0.33
Anguilla reinhardtii longfin eel 13.31 9.22 8.77 2.46 10.22 5.86
Arrhamphus sclerolepis snubnose garfish 3.54 2.46 0.44 4.18
Awaous acritosus Roman-nose goby 1.98 1.01 1.18 0.72 1.75 1.17
Brachirus spp a sole 0.29
Bunaka gyrinoides greenback gudgeon 3.11 3.60 0.67 1.45 1.46 4.02
Butis butis crimsontip gudgeon 0.14 0.29 0.17 0.29 0.44 1.34
Carangidae - undifferentiated trevallies 0.14 0.14
Caranx sexfasciatus bigeye trevally 0.67 0.00 1.90 0.50
Chanos chanos milkfish 0.14 0.34
Clupeidae - undifferentiated herrings 0.29
Dasyatidae - undifferentiated stingrays 0.17
Eleotris fusca brown spine-cheek gudgeon 0.17
Eleotris melanosoma black spine-cheek gudgeon 0.86 0.17 0.14 0.17
Eleotris spp a gudgeon 0.14 2.19 2.17 0.44 0.67
Gerres filamentosus threadfin silverbiddy 2.97 4.18 4.72 4.20 2.92 4.69
Gerres spp a silver biddy 2.12 4.18 3.04 3.04 2.92 4.02
Giurus margaritacea snakehead gudgeon 1.13 1.73 0.34 0.29 1.02 0.17
Glossamia aprion mouth almighty 0.85 1.15 2.36 4.64 3.65 3.01
Glossogobius circumspectus mangrove flathead goby 0.15
Glossogobius giuris tank goby 0.17 0.29 0.17
Glossogobius sp.1 [in Allen et al., 2002] Celebes flathead goby 0.58 0.50
Glossogobius spp a goby 4.25 3.60 0.67 0.58 0.29 0.84
Gobiidae - undifferentiated gobies 0.14 0.29 0.17 0.14
Gymnothorax polyuranodon freshwater moray 0.17
Hemiramphus regularis ardelio Eastern river garfish 0.14
Hephaestus spp a grunter 0.28
Hephaestus tulliensis khaki grunter 0.67 0.14 0.58 0.33
Herklotsichthys castelnaui Southern herring 0.17
Hippichthys heptagonus madura pipefish 0.14 0.17 0.15
Hyporhamphus spp a garfish 0.28 0.58 0.17
Hypseleotris compressa empire gudgeon 4.53 4.47 4.22 3.91 3.36 3.51
Kuhlia marginata spotted flagtail 0.14
Kuhlia rupestris jungle perch 0.57 1.30 0.84 1.01 1.46 1.17
Lates calcarifer barramundi 6.23 6.77 8.10 3.91 2.19 5.86
Leiognathus equulus common ponyfish 1.27 1.73 0.17 1.02 1.34
Leiognathus spp a pony fish 0.28 0.72 0.87
Lutjanus argentimaculatus mangrove jack 7.50 5.62 7.76 13.76 6.42 9.20
Megalops cyprinoides oxeye herring 0.72 0.58 0.15 0.67
Melanotaenia splendida Eastern rainbowfish 3.96 0.86 2.36 3.04 3.65 2.01
Mesopristes argenteus silver grunter 3.54 3.60 1.69 1.16 1.75 3.35
Monodactylus argenteus diamondfish 1.01 0.17
Mugil cephalus sea mullet 0.99 1.15 0.51 0.58 0.73 0.17
Nematalosa erebi bony bream 0.57 0.58 0.72 1.02 0.84
Nematalosa spp a herring 0.14
Neosilurus ater black catfish 0.99 1.01 1.18 0.29 0.44 1.51
Notesthes robusta bullrout 0.99 1.01 1.35 0.72 0.88 0.50
Ophisternon gutturale swamp eel 0.14 0.14
Ophisternon spp a swamp eel 0.14
Oxyeleotris aruensis Aru gudgeon 0.43
Pardachirus spp a sole 0.34
Plectorhinchus gibbosus brown sweetlips 0.14 0.17
Poecilia reticulata guppy 0.14 0.14
Psammogobius biocellatus sleepy goby 0.14
Pseudomugil signifer Pacific blue eye 3.68 5.62 1.35 1.45 3.07 3.85
Redigobius bikolanus speckled goby 1.70 2.45 0.51 0.72 1.17 3.01
Redigobius chrysosoma spotfin goby 0.29 0.51 0.43 0.84
Scatophagus argus spotted scat 0.57 0.58 0.17 0.58 0.29 0.84
Sillago spp a whiting 0.58
Stenogobius psilosinionus teardrop goby 0.17
Syngnathidae - undifferentiated pipefishes 0.58 0.15
Year
Scientific name Common name 2000 2001 2002 2003 2004 2005
Toxotes chatareus sevenspot archerfish 0.00 0.51 1.16 1.17 1.00
Toxotes jaculatrix banded archerfish 0.14 0.14 0.17 0.29 0.17
0 0.5 1 1.5 2 2.5 3
2000 2001 2002 2003 2004 2005
Year
Di
v
e
rs
it
y
Figure 23. Length frequency distribution of mangrove jack and barramundi in the Daintree River between 2000 and 2005.
Mangrove Jack 0 10 20 30 40
0 39 40 -79 80 -119 120 -159 160 -199 200 -239 240 -279 280 -319 320 -359 360 -399 400 -439 440 -479 2000 n = 53
0 10 20 30 40
0 39 40 -79 80 -119 120 -159 160 -199 200 -239 240 -279 280 -319 320 -359 360 -399 400 -439 440 -479 2001 n = 39
0 10 20 30 40
0 39 40 -79 80 -119 120 -159 160 -199 200 -239 240 -279 280 -319 320 -359 360 -399 400 -439 440 -479 F re que nc y ( % ) 2002 n = 46
0 10 20 30 40
0 39 40 -79 80 -119 120 -159 160 -199 200 -239 240 -279 280 -319 320 -359 360 -399 400 -439 440 -479 2003 n = 95
0 10 20 30 40
0 39 40 -79 80 -119 120 -159 160 -199 200 -239 240 -279 280 -319 320 -359 360 -399 400 -439 440 -479 2004 n = 44
0 10 20 30 40 0 3 9 40 79 80 119 1 20 159 1 60 199 2 00 239 2 40 279 2 80 319 3 20 359 3 60 399 4 00 439 4 40 479
Size class (mm)
2005 n = 55
Barramundi 0 10 20 30 40 50 150 -199 200 -249 250 -299 300 -349 350 -399 400 -449 450 -499 500 -549 550 -599 600 -649 650 -699 700 -749 750 -799 2000 n = 44
0 10 20 30 40 50 150 -199 200 -249 250 -299 300 -349 350 -399 400 -449 450 -499 500 -549 550 -599 600 -649 650 -699 700 -749 750 -799 2001 n = 47
0 10 20 30 40 50 150 -199 200 -249 250 -299 300 -349 350 -399 400 -449 450 -499 500 -549 550 -599 600 -649 650 -699 700 -749 750 -799 F re que nc y ( % ) 2002
n = 48
0 10 20 30 40 50 150 -199 200 -249 250 -299 300 -349 350 -399 400 -449 450 -499 500 -549 550 -599 600 -649 650 -699 700 -749 750 -799 2003 n = 27
0 10 20 30 40 50 150 -199 200 -249 250 -299 300 -349 350 -399 400 -449 450 -499 500 -549 550 -599 600 -649 650 -699 700 -749 750 -799 2004 n = 15
0 10 20 30 40 50 1 50 199 2 00 249 2 50 299 3 00 349 3 50 399 4 00 449 4 50 499 5 00 549 5 50 599 6 00 649 6 50 699 7 00 749 7 50 799
Size class (mm)
Johnstone River
River description
The Johnstone River, incorporating both the North and South Johnstone Rivers, flows east for 210 km from its source on the Atherton Tablelands to drain into the Coral Sea near Innisfail and is unregulated (Figure 24). The catchment of 244 km² consists of dairy and agriculture in the upstream reaches on the Atherton Tablelands, rainforest and steep rocky gorges in the mid-catchment and primarily banana and sugarcane production on the lower coastal strip (Figure 25).
Figure 24. Location of the reaches sampled annually within the Johnstone River.
Habitat
Overall river condition at the sampling locations was poor with a high frequency of moderate, high and extreme disturbance ratings recorded for most years (Figure 26). The riparian zone is not intact in places and evidence of bank erosion and sedimentation are obvious. Introduced grasses and plants often dominate the bank cover in the lower reaches and intrude into the stream. In-stream habitat is sparse within the coastal sites, with few snags and macrophyte beds being heavily impacted upon by the large flows during the wet seasons. The frequency distributions of aquatic macrophytes show increased frequencies of greater coverage in 2003 and 2005 (Figure 27). In the upper reaches boulders are the dominant habitat feature although there is some snag cover (Figure 27).
Stream bank disturbance ratings are similar for all years with the exception in 2001 where the extreme rating was mostly replaced by the high rating (Figure 26). The frequency of low disturbance sites was generally less than 20%.
Figure 26. Stream bank disturbance ratings for the Johnstone River between 2000 and 2005. The number of shot samples (n) are shown for each year.
Disturbance
n=42 n=41 n=42 n=42 n=42 n=36
0 20 40 60 80 100
2000 2001 2002 2003 2004 2005
Year
F
re
que
nc
y
(
%
) Extreme
High
Moderate
Low
Undisturbed
Figure 27. In-stream habitat parameters for the Johnstone River including leaf litter, aquatic macrophytes and snag coverage. The number of shot samples (n) are provided for each year.
Water quality
Water clarity, as indicated by Secchi disk depth, was excellent with the lowest mean visibility of just 155 cm in 2005 (Figure 28). Lower reaches are tidal and had a salt wedge in 2000 and 2001. As the efficiency of the electrofisher was reduced under these conditions, the catch rates in the pelagic runs were reduced in those years. Other water quality parameters however, indicated excellent conditions for fish (Figure 28).
Leaf litter
n=42 n=42 n=42 n=42 n=42 n=36
0 20 40 60 80 100
2000 2001 2002 2003 2004 2005
>200m2 151-200m2 101-150m2 51-100m2 1-50 m2 0m2 Unknow n
Series8
Aquatic macrophytes
0 20 40 60 80 100
2000 2001 2002 2003 2004 2005
Fr
e
que
nc
y
(
%
) >200m2
151-200m2
101-150m2
51-100m2
1-50 m2
0m2
Unknow n
Snags
0 20 40 60 80 100
2000 2001 2002 2003 2004 2005
Year
>200m2
151-200m2
101-150m2
51-100m2
1-50 m2
0m2
Figure 28. Water quality parameters for the Johnstone River, including temperature, oxygen and conductivity (top) and Secchi depth measurements (bottom) between 2000 and 2005. Ninety-five percent confidence intervals are shown.
Fish fauna
The highest catch rates were for sooty grunter, khaki grunter, longfin eel and Pacific blue eye (Table 6). Species diversity was high including several diadromous species such as
barramundi, sea mullet and bigeye trevally (Figure 29). Species richness was high with 61 species identified across the years. The introduced pest species tilapia, mosquito fish, guppies and platys are also present in this system possibly highlighting the disturbed nature of the system (Table 6).
Water quality
0 5 10 15 20 25 30
O
x
y
g
e
n
(
m
g
/l)
&
T
e
m
p
er
at
u
re (
ºC
)
0 0.02 0.04 0.06 0.08 0.1 0.12 0.14 0.16 0.18
C
onduc
ti
v
it
y
(
m
s
/c
m
)
Temperature
Oxygen
Conduct ivity
0 50 100 150 200 250 300 350
2000 2001 2002 2003 2004 2005
Year
S
e
c
c
hi
d
e
pt
h (
c
m
Table 6. Fish catch rates (CPUE) in the Johnstone River. Target species are highlighted in bold.
Year
Scientific name Common name 2000 2001 2002 2003 2004 2005
Acanthopagrus australis yellowfin bream 0.14 0.14
Acanthopagrus berda pikey bream 0.72 0.14 0.86 0.86 0.14 0.50
Ambassis agrammus sailfin glassfish 0.14 0.17
Ambassis interrupta longspine glassfish 0.29
Ambassis miops flagtail glassfish 0.72 2.66
Ambassis spp a glassfish 0.57 1.29 2.43 1.58
Anguilla australis Southern shortfin eel 0.17
Anguilla obscura Pacific shortfin eel 0.14 0.14 0.14
Anguilla reinhardtii longfin eel 4.29 3.02 5.16 3.02 6.30 3.33
Arrhamphus sclerolepis snubnose garfish 0.29 0.43 0.29 2.33
Awaous acritosus Roman-nose goby 2.86 1.01 1.43 1.15 2.00 2.16
Bunaka gyrinoides greenback gudgeon 1.14 1.58 0.86 0.86 2.58 1.50
Butis butis crimsontip gudgeon 0.29 0.57 0.17
Caranx sexfasciatus bigeye trevally 0.14 0.29 0.29 0.14
Chaetodontidae - undifferentiated butterflyfishes 0.17
Chanos chanos milkfish 1.29 0.50
Craterocephalus stercusmuscarum flyspecked hardyhead 0.14 0.86 1.58 1.57 0.83
Eleotris fusca brown spine-cheek gudgeon 0.14
Eleotris melanosoma black spine-cheek gudgeon 0.14
Eleotris spp a gudgeon 0.14 0.72 0.57 0.67
Gambusia holbrooki Eastern gambusia 0.67
Gerres filamentosus threadfin silver biddy 2.15 2.59 2.00 1.72 0.72 2.16
Gerres spp a silver biddy 1.29 2.44 1.29 2.01 0.57 2.00
Glossogobius bicirrhosus bearded flathead goby 0.14 0.17
Glossogobius circumspectus mangrove flathead goby 0.14
Glossogobius giuris tank goby 0.29 0.57 0.33
Glossogobius sp.1 [in Allen et al., 2002] Celebes flathead goby 1.15 0.83
Glossogobius sp.C [in Allen,1988] Mulgrave goby 0.17
Glossogobius spp a goby 2.15 6.04 3.15 0.86 0.43 0.67
Gobiidae- undifferentiated gobies 0.14 0.29
Hephaestus fuliginosus sooty grunter 21.46 16.54 21.34 17.95 13.88 12.14
Hephaestus tulliensis khaki grunter 5.72 8.92 9.17 5.60 1.57 13.47
Herklotsichthys castelnaui Southern herring 0.14 0.14 0.50
Hippichthys heptagonus madura pipefish 0.14
Hypseleotris compressa empire gudgeon 2.00 3.02 3.29 3.45 2.29 2.50
Kuhlia marginata spotted flagtail 0.14 0.14
Kuhlia rupestris jungle perch 2.29 1.29 0.72 0.29 0.86 0.83
Lates calcarifer barramundi 1.43 1.29 1.29 1.44 0.43 1.33
Leiognathidae - undifferentiated ponyfishes 0.14
Leiognathus equulus common ponyfish 1.14 0.14 0.14 0.57 0.14 0.67
Leiognathus splendens blacktip ponyfish 0.14
Leiognathus spp a pony fish 0.14 0.14
Lutjanus argentimaculatus mangrove jack 0.86 2.01 1.86 2.30 3.72 1.00
Melanotaenia splendida Eastern rainbowfish 1.43 2.73 3.15 3.73 2.72 1.83
Melanotaenia spp a rainbowfish 0.17
Melanotaenia trifasciata banded rainbowfish 0.58
Melanotaenia utcheensis Utchee rainbowfish 0.50
Mesopristes argenteus silver grunter 0.43 0.58 1.29 0.43 1.15
Microphis brachyurus short-tail pipefish 0.14
Monodactylus argenteus diamondfish 0.14
Mugil cephalus sea mullet 1.57 0.43 0.00 0.67
Mugilidae - undifferentiated mullets 0.14 0.14
Mugilogobius notospilus freshwater mangrovegoby 0.14
Mugilogobius spp a goby 0.14 0.14
Nematalosa erebi bony bream 0.14 0.72 0.29 0.83
Neosilurus ater black catfish 0.86 1.29 2.00 1.29 0.14
Neosilurus hyrtlii Hytrl's catfish 0.43
Notesthes robusta bullrout 0.57 0.72 0.29 0.43 0.33
Oxyeleotris lineolata sleepy cod 0.29 0.33
Platycephalus fuscus dusky flathead 0.14
Poecilia reticulata guppy 0.14 0.14 0.72 0.14 0.14 0.17
Porochilus rendahli Rendahl's catfish 0.14
Year
Scientific name Common name 2000 2001 2002 2003 2004 2005
Redigobius bikolanus speckled goby 1.57 3.60 2.29 3.88 3.29 3.66
Scatophagus argus spotted scat 0.29 0.14 0.14 0.29 0.17
Schismatogobius sp. [in Allen, 1989, and
Allen et al., 2002] scaleless goby 0.14
Tandanus tandanus freshwater catfish 1.43 0.58 0.72 0.43 0.43 0.17
Tilapia mariae spotted tilapia 5.87 1.15 1.00 4.88 0.72 4.99
Toxotes chatareus sevenspot archerfish 0.14 0.57 0.14 0.14 0.17
Toxotes jaculatrix banded archerfish 0.14
unknown species unknown species 0.14
Xiphophorus maculatus platy 0.17
0 0.5 1 1.5 2 2.5 3
2000 2001 2002 2003 2004 2005
Year
D
iver
si
ty