1
RVC OPEN ACCESS REPOSITORY – COPYRIGHT NOTICE
This is the peer reviewed version of an accepted journal article – ‘Differential
pharmacokinetics and pharmacokinetic/pharmacodynamic modelling of robenacoxib and ketoprofen in a feline model of inflammation’ – which has been published in final form at
http://dx.doi.org/10.1111/jvp.12107.
This draft has been made available on the RVC’s Open Access publications repository in accordance with the College’s Open Access policy.
This article may be used for non-commercial purposes in accordance with the publisher’s self-archiving policy, which can be found at http://olabout.wiley.com/WileyCDA/Section/id-820227.html.
The full details of the published version of the article are as follows:
TITLE: Differential pharmacokinetics and pharmacokinetic/pharmacodynamic modelling of robenacoxib and ketoprofen in a feline model of inflammation
AUTHORS: Pelligand, L and King, J N and Hormazabal, V and Toutain, P L and Elliott, J and Lees, P
JOURNAL TITLE: Journal of Veterinary Pharmacology and Therapeutics
VOLUME/EDITION: 37/4
PUBLISHER: Wiley
PUBLICATION DATE: August 2014
Differential
pharmacokinetics
and
pharmacokinetic/pharmacodynamic
1
modelling of robenacoxib and ketoprofen in a feline model of inflammation
2
L. PELLIGAND* 3
J.N. KING† 4
V. HORMAZABAL‡ 5
P.L. TOUTAIN§ 6
J. ELLIOTT* 7
P. LEES* 8
9
*Department of Comparative and Basic Sciences, Royal Veterinary College, Hawkshead
10
Campus, Hatfield, Hertfordshire, UK; †Novartis Animal Health Inc., Clinical Development,
11
Basel, Switzerland (J.N.K.); ‡Department of Food Safety and Infection Biology, The Norwegian
12
School of Veterinary Science, Oslo, Norway (V.H.); §UMR 1331 Toxalim INRA/INP/UPS. Ecole
13
Nationale Vétérinaire de Toulouse, Toulouse, France (P.L.T.)
14
Corresponding author: Ludovic Pelligand, Department of Comparative and Basic Sciences,
15
Royal Veterinary College, Hawkshead Campus, Hatfield, Hertfordshire, UK. Email:
16
lpelligand@rvc.ac.uk
17
Short title: robenacoxib and ketoprofen in the cat 18
Key words: Robenacoxib, NSAIDs, feline, tissue cage, PK/PD 19
ABSTRACT 21
Robenacoxib and ketoprofen are acidic non-steroidal anti-inflammatory drugs (NSAIDs). Both 22
are licensed for once daily administration in the cat, despite having short blood half-lives. This 23
study reports the pharmacokinetic/pharmacodynamic (PK/PD) modelling of each drug in a feline 24
model of inflammation. Eight cats were enrolled in a randomised, controlled, three period cross-25
over study. In each period, sterile inflammation was induced by injection of carrageenan into a 26
subcutaneously implanted tissue cage, immediately before the subcutaneous injection of 27
robenacoxib (2 mg/kg), ketoprofen (2 mg/kg) or placebo. Blood samples were taken for 28
determination of drug and serum thromboxane (Tx)B2 concentrations (measuring COX-1 29
activity). Tissue cage exudate samples were obtained for drug and prostaglandin(PG)E2 30
concentrations (measuring COX-2 activity). Individual animal pharmacokinetic and 31
pharmacodynamic parameters for COX-1 and COX-2 inhibition, were generated by PK/PD 32
modelling. S(+) ketoprofen clearance scaled by bioavailability (CL/F) was 0.114 L/kg/h 33
(elimination life =1.62 h). For robenacoxib, blood CL/Fwas 0.684 L/kg/h (elimination half-34
life =1.13 h). Exudate elimination half-lives were 25.9 and 41.5 h for S(+) ketoprofen and 35
robenacoxib, respectively. Both drugs reduced exudate PGE2 concentration significantly between 36
6 and 36 h. Ketoprofen significantly suppressed (>97%) serum TxB2 between 4 min and 24 h, 37
whereas suppression was mild and transient with robenacoxib. In vivo IC50COX-1/IC50COX-2 38
ratios were 66.9:1 for robenacoxib and 1:107 for S(+) ketoprofen. The carboxylic acid nature of 39
both drugs may contribute to the prolonged COX-2 inhibition in exudate, despite short half-lives 40
in blood.
INTRODUCTION
42
Non-steroidal anti-inflammatory drugs (NSAIDs) inhibit cyclooxygenase (COX) and have been 43
used for many decades to alleviate inflammation-related pain in human and veterinary medicine. 44
COXibs belong to a class of NSAIDs that selectively inhibit the COX isoform up-regulated in 45
inflammation (COX-2), with much less inhibition of the constitutively expressed COX isoform 46
(COX-1) responsible for the production of so-called “housekeeping” eicosanoids. Several 47
COXibs were associated with an increased risk of myocardial infarction or stroke in man when 48
evaluated against non-selective NSAID comparators and administered at recommended dose 49
rates (Bombardier et al., 2000; Silverstein et al., 2000). However, lumiracoxib contrasted with 50
other COXibs by displaying favourable cardiovascular and gastrointestinal safety profiles in a 51
study incorporating more than 18,000 human patients (Farkouh et al., 2004). 52
53
Despite a short plasma half-life (2 to 6.5 h) in man, lumiracoxib was authorised for once daily 54
administration (Mysler, 2004), whereas rofecoxib and celecoxib were both administered twice 55
daily, despite their long respective half-lives of 17 and 19 to 32 h (Vasquez-Bahena et al., 2010). 56
The persistent clinical efficacy of lumiracoxib may be related to a prolonged residence of the 57
drug in inflamed joints (Scott et al., 2004; Brune & Furst, 2007). 58
59
Robenacoxib is a structural analogue of lumiracoxib, licensed for use in cats (and dogs). Both 60
drugs are structurally related to diclofenac (Fig. 1), containing a carboxylic acidic function 61
instead of the methylsulphone (as for rofecoxib) or the sulphonamide (as for celecoxib) groups 62
subcutaneous administration in the cat (Pelligand et al., 2012b) but is as effective as an analgesic 64
as meloxicam (half-life 37 h) for at least 22 h post-operatively (Kamata et al., 2012). 65
66
Ketoprofen is a COX-1 selective NSAID (Fig. 1), licensed for once daily administration in man 67
and cats (Warner et al., 1999; Schmid et al., 2010) despite short elimination half-lives for the 68
eutomer S(+) ketoprofen of 1.2 h in the cat and 2 to 3 h in man (Rudy et al., 1998; Lees et al., 69
2003). 70
We hypothesised that robenacoxib and ketoprofen would be similarly effective as anti-71
inflammatory drugs in a feline model of inflammation, despite the differences in COX 72
selectivity, because of similar concentration-time profiles and potency for COX-2 inhibition. 73
Several models of inflammation have been developed in the cat (Giraudel et al., 2005b; 74
Pelligand et al., 2012a) but only the carrageenan-based tissue cage model of Pelligand et al.
75
(2012a) allows serial measurement of NSAID concentrations in blood and at the site of 76
inflammation, as well as determination of the magnitude and time-profiles of COX-1 and COX-2 77
inhibition. We have previously described exudate sampling from these cages for serial 78
measurement of NSAID and Prostaglandin(PG)E2 concentrations, the latter inflammatory 79
mediator as a surrogate of COX-2 activity, together with blood sampling for measurement of 80
serum thromboxane(Tx)B2 as a surrogate of COX-1 activity (Pelligand et al., 2012a; Pelligand et 81
al., 2012b). The model further enables calculation of pharmacodynamic parameters of NSAIDs, 82
namely Imax (efficacy), IC50 (potency) and n (slope of the concentration-effect relationship). 83
These parameters are used to calculate dosage regimens for clinical use (Lees et al., 2004). 84
The aims of this study were to: (i) compare the pharmacokinetic and the pharmacodynamic 86
profiles of robenacoxib and ketoprofen in feline blood and exudate; (ii) compare in vivo IC50 87
COX-2, ex vivo IC50 COX-1 and COX inhibition selectivity for each drug; and (iii) compare and 88
contrast the pharmacokinetic and pharmacodynamic profiles of two carboxylic acid sub-groups 89
of NSAIDs, the profens and COXibs, in the cat. 90
91
MATERIALS AND METHODS
92
Animals
93
Eight domestic short hair cats (all neutered, 5 males and 3 females, aged 1 to 3 years), weighing 94
4.0±0.39 kg, were enrolled into the study after an acclimatisation period of one month. Health 95
checks were performed before the start of each sampling period. Between study periods, the cats 96
were grouped housed altogether. They were fed a dry commercial diet (RF23, Royal Canin, 97
Aimargues, France) in two equal portions daily, based on their metabolic requirements. Drinking 98
water was available ad libitum. The room was lit from 7.00 am to 7.00 pm. 99
100
The study complied with United Kingdom Home Office regulations (Project License Number 101
70/6132). The protocol was approved by the Royal Veterinary College Ethics and Welfare 102
Committee. All tissue cages were electively removed under general anaesthesia 6 months after 103
implantation, before the cats were re-homed, as no long lasting sequelae resulted from the 104
protocol. 105
106
Animal preparation and induction of inflammation
Four tissue cages were implanted surgically in each cat, as previously described (Pelligand et al., 108
2012b). Briefly, medical grade silicone cylindrical tissue cages (SF Medical, Fresno, CA, USA) 109
were prepared to the following dimensions: 70 mm length, 15.9 mm external diameter, 12.7 mm 110
internal diameter (6.7 cm3 internal volume) with 12 holes at each pole providing a total surface 111
exchange area of 3.0 cm2 per cage. They were sterilised and surgically inserted subcutaneously, 112
under isoflurane (IsoFlo, Abbott Animal Health, Maidenhead, UK) general anaesthesia, parallel 113
to the vertebral column in the flank and thorax areas. Analgesia was provided intra- and post-114
operatively as described by Pelligand et al. (2012a). The tissue cages were flushed with sterile 115
saline under general anaesthesia 7 weeks after implantation to remove any remaining cellular 116
debris and subsequently used experimentally, not earlier than 10 weeks after implantation. On 117
the day before dosing, the fur over the cages was clipped and a double-lumen catheter 118
(CS15402E, Arrow International Ltd, Uxbridge, UK) was inserted in a jugular vein under 119
general anaesthesia (Pelligand et al .2012a). 120
121
On day 1 of each period, 1 mL of a 2% sterile carrageenan solution (Viscarin, FMC biopolymers, 122
Philadelphia, PA, USA) was injected into a naïve tissue cage (Pelligand et al., 2012b) and this 123
tissue cage was used to harvest exudate in that period. A different tissue cage was stimulated for 124
each subsequent period. 125
126
Experimental design
127
The experiment was conducted as a three-period, three-sequence, cross-over with 28 day 128
washout intervals. The treatment for the first period was allocated following a randomised 129
incomplete latin square design. All cats received each of the treatments. The three treatments, 131
administered subcutaneously in the neck area, were: robenacoxib 2 mg/kg (Onsior 2.0% solution, 132
Novartis Animal Health, Basel, Switzerland); racemic ketoprofen 2 mg/kg (Ketofen 1% solution, 133
Merial Animal Health, Harlow, Essex, UK); and 0.9% saline (0.1 mL/kg) as placebo. On each 134
test day, the cats were fed 2 h before dosing and again after the final blood sample of the day (12 135
h after dosing). The carrageenan-stimulated cages were sampled (1.0 to 1.3 mL of exudate on 136
each occasion) before and at 3, 6, 9, 12, 24, 34, 48, 72, 96 and 120 h after carrageenan injection 137
(11 serial samples from the same cage). Samples were transferred immediately to 1.5 mL 138
Eppendorf tubes containing 10 µg indomethacin (Sigma Aldrich, Poole, Dorset, UK) to prevent 139
artefactual ex vivo eicosanoid generation. The tube was mixed by gentle inversion and placed on 140
ice until centrifugation at 1000 g, 4° C for 10 min. The supernatant was aliquoted and frozen at -141
80°C prior to measurement of exudate PGE2 and concentrations of ketoprofen or robenacoxib. 142
143
Blood samples (maximum 1.5 mL per sample) were taken from the distal port jugular catheter 144
before dosing and at 4, 15, 30 min, then 1, 1.5, 2, 3, 4, 6, 9, 12, 24 and 48 h after dosing. An 145
aliquot of each blood sample (0.2 mL) was allowed to clot in a glass tube (Chromacol, Welwyn 146
Garden City, Herts., UK) whilst incubated in a water bath at 37º C for 1 h then centrifuged (1500 147
g, 4º C, 10 min) and the supernatant stored at -80º C prior to measurement of serum TxB2. The 148
remainder of the sample (1.3 mL) was transferred into an EDTA tube (International Scientific 149
Supplies Ltd., Bradford, Yorks., UK) for blood robenacoxib measurement or a heparin tube for 150
plasma ketoprofen measurement and stored at -80º C. 151
To ensure accuracy of pharmacokinetic calculations, cats were weighed on the day of catheter 153
placement, actual injected doses were calculated by weighing syringes before and after injection 154
and actual rather than nominal times of blood sampling were used. 155
156
Measurement of NSAID concentrations
157
Plasma (ketoprofen), blood (robenacoxib) and exudate (both drugs) were spiked with known 158
drug concentrations to establish standard curves, and quality controls (QCs) were prepared and 159
dispersed over the sequence of unknown samples, to monitor the overall performance of each 160
analytical method. The percentage of back-calculated concentrations of standards within ±15% 161
of their nominal value and the percentage of QCs within ±15% of their theoretical value were 162
calculated. Imprecision (indicator of between day repeatability) was expressed as the coefficient 163
of variation (CV%) between standard concentrations run on different days. Inaccuracy was 164
expressed as the deviation of the mean (% Relative Error) from the theoretical concentration 165
spiked into blank matrix. 166
167
Robenacoxib concentrations in feline blood were measured using a sensitive analytical method, 168
as described by Jung et al. (2009). Briefly, the method involved an initial analysis by HPLC-UV, 169
covering the range of 500-20,000 ng/mL and, if required, a subsequent analysis by LC-MS, 170
covering the range of 3-100 ng/mL for blood. Depending on the results obtained by UV analysis, 171
samples were diluted if necessary in order not to exceed a concentration of 100 ng/mL in the MS 172
method. The same method was used for exudate, except that 250 µL of sample were extracted 173
and diluted two-fold with water, instead of using 500 µL of blood. For blood with the MS 174
the exudate was diluted two fold, the MS method had a range of 6-200 ng/mL for exudate in the 176
initial method validation, but this was extended subsequently to 3.5 – 200 ng/mL, as it was 177
established during the analysis that reliable results were obtained at the lower end of the range. 178
For robenacoxib, inaccuracy was less than 10.4% and imprecision was less than 9.3%. 179
180
R(-) ketoprofen and S(+) ketoprofen concentrations were measured in exudate and plasma by 181
liquid chromatography mass-spectrometry (API 2000 LC/MS/MS system, Applied Biosystems, 182
Ontario, Canada). The method, previously validated for cat and piglet plasma (Fosse et al., 2011 183
and Hormazábal, unpublished data), had lower and upper limits of quantification of 10 and 8,000 184
ng/mL for both matrices. After extraction, filtration and centrifugation of 0.5 mL 185
plasma/exudate, 50 µL of the supernatant was separated on a 100 x 4.6 mm Chirobiotic R 186
column packed with 5 µm ristocetin A particles (Chirobiotic R, Astec, NJ, USA) at 18°C. The 187
mobile phase comprised 46% of 10 nM ammonium acetate (containing 0.3% formic acid) and 188
54% methanol. Flow rate was 0.6 mL/min. A guard column with similar sorbent was used (20 x 189
4.0mm). Average retention times were 4.9 and 5.4 min for S(+) and R(-) ketoprofen, 190
respectively. The detector operated in multiple reactions monitoring (MRM) mode and collected 191
ion data in positive mode. The protonated molecular ion was m/z 255. The product ion m/z 209.1 192
was used for screening and quantification, while the ratios with the product ion m/z 105.2 were 193
used for confirmation of the identity. For ketoprofen enantiomers, inaccuracy was less than 1.3% 194
and imprecision was less than 0.7%. 195
196
Pharmacodynamic measurements
In vivo generation of exudate PGE2 and ex vivo generation of serum TxB2 were used as 198
surrogates for COX-2 and COX-1 activities, respectively. Although the main source of TxB2 in 199
serum is platelet COX-1, a minor contribution from COX-2 or from other cells cannot be 200
completely excluded. Additionally, COX-1 may contribute to the synthesis of PGE2 in exudate 201
(Nantel et al., 1999; Wallace et al., 1999), but the magnitude of this production is likely to be 202
negligible, based on the fact that COX-1 is not induced in carrageenan inflammatory models 203
(Tomlinson et al., 1994). 204
205
Serum TxB2 and exudate PGE2 concentrations were measured with competitive radio-206
immunoassays, adapted from Higgins et al. (1984) as described in a previous validation paper 207
(Pelligand et al., 2012a). Two concentrations of pooled samples were aliquoted, and used as 208
quality controls, dispersed over the sequences of unknown samples to calculate inter- and intra-209
assay variability. Exudate PGE2 intra-assay variability was 3% for the high control concentration 210
(2.9 ng/mL) and 23.9% for the low control concentration (0.13 ng/mL). Inter-assay variability 211
was 2.1% for the high control and 31% for the low control concentrations. Serum TxB2 intra-212
assay variability was 7.2% for the high control (235.1 ng/mL) and 13.2% for the low control 213
(56.5 ng/mL) concentrations. Inter-assay variability was 2.3% and 11.3% for the high and low 214
control concentrations, respectively. All validation data complied with analytical 215
recommendations guidelines (Kelley & DeSilva, 2007; Viswanathan et al., 2007) except for 216
PGE2 inter-assay variability. Therefore, all samples from the same cats were always analysed in 217
the same batch. 218
219
Pharmacokinetic data analysis
Pharmacokinetics and PK/PD modelling were performed by the least-squares regression method, 221
using commercial software (WinNonlin version 5.2, Pharsight Corporation, Mountain View, CA, 222
USA). Goodness of fit and selection of the appropriate model were evaluated using the Akaike 223
Information Criterion estimate (Yamaoka et al., 1978) and by visual inspection of the fitted 224
curves and residuals. 225
Blood robenacoxib and plasma ketoprofen enantiomer concentrations C(t) were fitted for each 226
cat using an equation corresponding to drug disposition in a two-compartmental model with 227
absorption phase (subcutaneous administration, Eq. 1): 228 ) .( 2 ) .( 1 ) .( 2 1 2 1 . . ). ( )
(t Y Y e ka t tlag Y e t tlag Y e t tlag
C (Eq. 1)
229
where λ1 and λ2 are the initial and terminal slopes (/h), Y1 and Y2 the intercepts on the Y axis 230
(ng/mL), when C(t) is plotted on a semi-logarithmic scale, ka is the first-order absorption rate
231
constant (/h) and tlag the absorption lag time after subcutaneous administration. Data were 232
weighted by the reciprocal of the estimated value for blood or plasma concentration when 233
necessary. 234
235
Exudate concentrations of robenacoxib or ketoprofen enantiomers Ce(t) were fitted for the data 236
from each cat using an equation corresponding to drug disposition in a bicompartmental model 237
with an absorption phase after dose normalisation (Eq. 2): 238 t e t e t k e e e e e
ea Y e Y e
e Y Y t
C 2 .
. 1 . 2 1 2 1 . . ). ( )
( (Eq. 2)
239
where λe1 and λe2 are the initial and terminal slopes (/h), Ye1 and Ye2 the intercepts on the Y axis 240
(ng/mL) when Ce(t) is plotted on a semi-logarithmic scale, and kea is the first-order invasion rate
241
constant in exudate (/h). No weighting was applied to the data for fitting. It was assumed that 242
pharmacokinetics in exudate had no effect on the time-course of drug disposition in the rest of 244
the body. 245
246
Pharmacokinetic parameters were generated for robenacoxib (in blood and exudate) and S(+) and 247
R(-) ketoprofen (in plasma and exudate) by non-compartmental analysis for individual cats, as 248
follows: Maximum NSAID concentration, Cmax, Time of maximum NSAID concentration, Tmax, 249
Area under NSAID concentration-time curve, AUC0-inf, Area under first the Moment Curve, 250
AUMC0-inf, NSAID Mean Residence Time (MRT) = AUMC0-inf /AUC0-inf, NSAID terminal half-251
life, t½=ln(2)/λz, where λz is the slope of the drug elimination phase, computed by linear 252
regression of the logarithmic concentration versus time curve during the elimination phase, 253
NSAID clearance scaled by bioavailability (F), CL/F= dose/(F x AUC0-inf), where F is the 254
bioavailability for extravascular administration, Apparent volume of distribution of NSAID 255
during the elimination phase, Varea/F = (dose/F)/(AUC0-inf x λz). 256
257
Pharmacodynamic data analysis and PK/PD modelling
258
A user program was purposely written in WinNonlin for PK/PD modelling. The equations of 259
robenacoxib and S(+) ketoprofen enantiomer disposition in blood/plasma C(t) or in exudate Ce(t) 260
were obtained by compartmental pharmacokinetic analysis by fitting equations (1) or (2), 261
respectively, to the observed data. Individual pharmacokinetic parameters were entered as 262
constants to solve the PK/PD models in a 2 stages analysis (Giraudel et al., 2005a). 263
In vivo generation of exudate PGE2 was used as a surrogate for COX-2 activity in order to carry 264
out PK/PD modelling of the NSAIDs in exudate (Lees et al., 2004). An indirect response model 265
ketoprofen on exudate PGE2 production. The model did not include the R(-) enantiomer, as it 267
was considered to be devoid of activity on cyclooxygenase at the concentrations achieved. 268
Indeed, S(+) ketoprofen is the eutomer of the S(+)/R(-) ketoprofen enantiomeric pair (Lees et al., 269
2003). The response is indirect because it is the consequence of a dynamic physiologic 270
equilibrium between PGE2 production after carrageenan injection, the natural clearance of PGE2 271
from exudate and the reversible inhibition of COX-2 by NSAIDs, preventing the build-up of 272
PGE2 in exudate as in Equation 3 (Dayneka et al., 1993): 273
2 Kin(t) Kout PGE2
dt
dPGE
(Eq. 3)
274
where dPGE2/dt (ng/mL/h) is the rate of change of PGE2 concentration in exudate, Kout (/h) is a 275
first order parameter expressing PGE2 disappearance rate and Kin(t) (ng/mL/h) is a zero-order 276
time-function expressing PGE2 production rate. Kin is considered as a time-dependent parameter, 277
influenced by carrageenan administration and NSAID concentration (in the periods when 278
administered). To express the action of carrageenan on Kin, a stimulation function (named 279
stimulPLACEBO and stimulNSAIDs was selected as Eq. 4 and Eq. 5 for the placebo and NSAID
280
periods, respectively: 281
k (t tlag1) k (t tlag1)
PLACEBO2
1 e
e carrag
stimul (Eq. 4)
282
k (t tlag2) k (t tlag2)
NSAIDs2
1 e
e carrag
stimul (Eq. 5)
283
where k1 and k2 are the first-order rate constants (/h) describing the time-development of the 284
carrageenan stimulation, carrag is a scalar factor, and tlag1 and tlag2 represent the delays in the 285
onset of inflammation for the placebo and NSAID periods, respectively. Consequenlty, tlag is 286
assume that the effect of carrageenan stimulation of COX builds up progressively (as reflected 288
by k2) after injection, then steadily decreases (as reflected by k1) (Lepist & Jusko, 2004). 289
It was assumed that robenacoxib and ketoprofen suppressed the carrageenan action in exudate 290
through an Imax function (Lees et al., 2004) of the form (Eq. 6): 291
n e n 50 n e max ) t ( C IC ) t ( C I 1 t I (Eq. 6)
292
I(t) is a time-dependant scalar. Imax is a scalar fixed to 1, expressing the fact that robenacoxib can 293
totally inhibit carrageenan pro-inflammatory effect. IC50 expresses the NSAID potency against 294
carrageenan effect; n is the Hill exponent expressing the steepness of the NSAID concentration 295
versus effect curve. Finally, incorporating Eq. 4 (placebo) or Eq. 5 and Eq. 6 (NSAID) in the 296
general Eq. 3, the time development of PGE2 concentration in exudate was described by Eq. 7 297
(placebo) and Eq. 8 (NSAID): 298 2 out PLACEBO in 2 out in
2 K (t) K PGE K stimul K PGE
dt
dPGE
(Eq. 7) 299 2 out n e n 50 n e NSAIDs in
2 K .PGE
) t ( C IC ) t ( C 1 stimul K dt dPGE
(Eq. 8)
300
The time-courses of exudate PGE2 were modelled simultaneously for placebo and robenacoxib, 301
then placebo and S(+) ketoprofen, as the equations for placebo and NSAIDs share several 302
common parameters in the same cat (Kin, Kout and carrag, k1 and k2). Nine parameters were 303
estimated by the model, namely kin, carrag, k1, k2, tlag1, tlag2, kout IC50 and n. 304
305
Ex vivo generation of serum TxB2 was used as a surrogate marker of COX-1 activity for PK/PD 306
serum TxB2 synthesis according to the following sigmoid Imax model selected to fit the serum 308
TxB2 data (Eq.9): 309
n n50 n max 0 0 ) t ( C IC ) t ( C ) I I ( t I )) t ( C ( I
(Eq. 9)
310
where I0 (t)is the baseline serum TxB2 concentration (ng/mL) for an individual cat, Imax (%) is the 311
percentage of maximal TxB2 suppression (corresponding to the lower limit of quantification of 312
the assay) relative to I0(t), IC50 (ng/mL) is the concentration that achieves half of the maximal 313
TxB2 suppression and n is the slope of the NSAID concentration-effect curve. In most cats, the 314
serum TxB2 concentration had drifted below baseline by the end of the period when placebo was 315
administered, as also reported in a previous study (Pelligand et al., 2012b). This drift of baseline 316
throughout the course of the experiment was modelled as (Eq. 10): 317 t d I ) t (
I0 0 (Eq. 10)
318
where d represents the slope of the baseline function for an individual cat and I0 the initial TxB2 319
concentration during the treatment period (Ollerstam et al., 2006). The slope was calculated for 320
each cat by linear regression of the serum TxB2 concentration after placebo administration. As 321
blood samples were collected for 48 h during the ketoprofen period but only for 24 h after 322
placebo and robenacoxib dosing, the drift was not applied between 24 h and 48 h (Eq. 11): 323 24 d I ) h 24 t (
I0 0 (Eq. 11)
324
325
Calculation of potency indices and estimation of extent of COX-2 blockade centrally
326
Individual concentration-effect curves for (i) in vivo inhibition of COX-2 and (ii) ex vivo
327
inhibition of COX-1 were simulated using calculated pharmacodynamic parameters expressing 328
relationship (n). An average curve for COX-1 and COX-2 was fitted to the individual curves 330
previously simulated (naïve pooled approach) using the same Hill equation (Giraudel et al., 331
2005b; Pelligand et al., 2012b). The corresponding average parameter values (aIC50 and an) and 332
95% confidence intervals were derived to calculate the selectivity indicesto describe the relative 333
in vivo selectivity.. Finally, the predicted percentage of COX-1 inhibition was calculated for 50, 334
80, 95 and 99% inhibition of COX-2. 335
336
Statistical analysis
337
Figures and potency curve fitting were computed using Prism version 5 (GraphPad, La Jolla, 338
CA, USA). Statistics were performed with PASW Statistics (version 17, IBM, New York, USA) 339
using a linear mixed model for PGE2 and TxB2. Treatment, time and treatment-time interaction 340
were entered as fixed effects and cat was entered as a random effect. Time was nested within 341
treatment and cat, a first order autoregressive covariance structure (AR1) was used (Littell et al., 342
1998; Kristensen & Hansen, 2004). The normality assumption of the residuals was assessed by 343
visual inspection and was verified after a log transformation of exudate PGE2 and serum TxB2 344
concentrations. All reported P values are two-tailed, with statistical significance defined as P 345
<0.05. In the post hoc tests, multiple analyses were corrected using the Bonferroni method. 346
Arithmetic, geometric and harmonic means are presented (in tables only) as mean ± SD, mean 347
[95% Confidence Interval] and mean ± pseudoSD (obtained by the Jackknife method), 348
respectively (Lam et al., 1985). 349
350
351
RESULTS
Pharmacokinetics
353
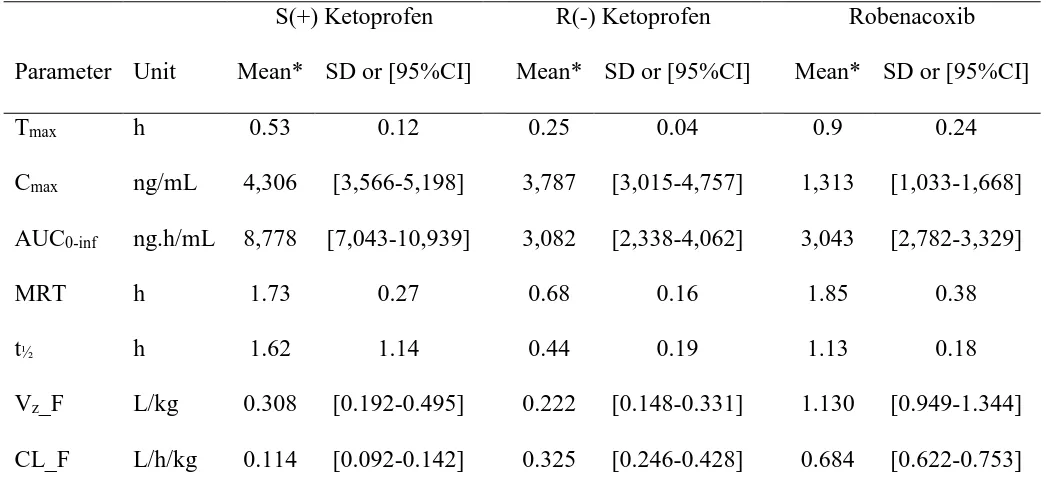
Pharmacokinetic parameters for plasma ketoprofen and blood robenacoxib concentrations are 354
summarised in Table 1. The plasma concentration-time curve of ketoprofen was best described 355
by a bicompartmental model with first order absorption for the S(+) enantiomer and a 356
monocompartmental model with first order absorption for the R(-) enantiomer (Fig. 2). Peak 357
plasma concentrations were 4,306 ng/mL for S(+) ketoprofen (Tmax= 0.53 h) and 3,787 ng/mL 358
for R(-) ketoprofen (Tmax= 0.25 h). Apparent clearances (CL/F) were 0.114 L/kg/h for S(+) 359
ketoprofen and 0.325 L/kg/h for R(-) ketoprofen. Terminal elimination half-life was longer for 360
S(+) ketoprofen (t½=1.62 h, MRT=1.7 h) than for R(-) ketoprofen (t½=0.44 h, MRT=0.7 h). 361
362
The blood concentration-time curve of robenacoxib was best described by a bicompartmental 363
model with first order absorption (Fig. 3). Peak plasma concentration of 1,313 ng/mL was 364
reached after 0.9 h and the mean absorption tlag was 0.05 h. Apparent blood robenacoxib 365
clearance was moderate (0.684 L/kg/h) (Toutain & Bousquet-Melou, 2004) and elimination half-366
life was 1.13 h. 367
368
Pharmacokinetic parameters for exudate are summarised in Table 2. The exudate ketoprofen 369
enantiomer concentrations followed a bi-exponential decay (Fig. 2). Harmonic mean penetration 370
half-lives of S(+) and R(-) ketoprofen in exudate were 2.93 h and 2.06 h, respectively. Maximum 371
exudate concentrations were reached at 7.9 h and 6.0 h after injection for S(+) and R(-) 372
ketoprofen, respectively. The mean peak exudate concentration of S(+) ketoprofen was 169 373
25.9 h for S(+) and 22.5 h for R(-) ketoprofen, accounting for correspondingly long MRTs of 375
35.9 h and 36.2 h. 376
377
Exudate robenacoxib concentration followed a bi-exponential decay (Fig. 3 and 4). One cat (D2) 378
had peak robenacoxib exudate concentration (351 ng/mL) that was approximately 4-fold higher 379
than the average Cmax value observed in the other seven cats. However, its exudate 380
concentrations were similar to those observed in the other seven cats by the 12th hour postdose. 381
Since a similar inconsistency was not observed when this cat was administered ketoprofen and 382
because this cat did not behave as an outlier during the pharmacodynamics or blood level PK 383
component of this investigation, it was assumed that these high initial robenacoxib 384
concentrations were a function of experimental error. Accordingly, cat D2 was excluded from 385
the robenacoxib exudate evaluations. However, it should be noted that in the absence of a 386
confirmed source of this error, it is impossible to exclude the possibility that the exudate profiles 387
associated with cat D2 reflect an idiosyncrasy that may exist in a subpopulation of cats. That 388
said, the maximal robenacoxib concentration for the seven other cats was 85.2 ng/mL, attained at 389
8.1 h after dosing. Harmonic mean penetration half-life of robenacoxib in inflammatory exudate 390
was 4.9 h. Exudate elimination half-life and MRT were 41.5 h and 45.7 h, respectively. 391
392
393
Pharmacodynamics 394
Both ketoprofen and robenacoxib reduced exudate PGE2 concentrations significantly between 6 395
and 36 h (Fig. 5). Maximum PGE2 inhibition, at 9 h, was 92.1% for robenacoxib and 90.9% for 396
398
Maximal TxB2 suppression with robenacoxib was 51.2 % at 2 h and this was the only time when 399
the effect of robenacoxib was significantly different from placebo (Fig. 6). TxB2 had returned to 400
placebo level at 3 h. With ketoprofen, serum TxB2 inhibition occurred rapidly, commencing 4 401
min after injection (97.1%) and suppression was maximal (97.9%) at 1 h (Fig. 6). Compared to 402
placebo, ketoprofen significantly suppressed serum TxB2 between 4 min and 24 h. Serum TxB2 403
was 11.8% and 58.2% of the placebo concentration at 24 and 48 h, respectively. 404
405
406
PK/PD analysis
407
For COX-2 inhibition, the PK/PD model for estimation of pharmacodynamic parameters gave 408
good results in 6 of 8 cats for both S(+) ketoprofen and robenacoxib. In two cats, the model did 409
not converge, because exudate PGE2 concentrations were reduced below the limit of 410
quantification of the assay or did not recover to the levels in the placebo group within 120 h. 411
Means of individual estimates of the pharmacodynamic COX-2 parameters for the carrageenan 412
model, and after administration of ketoprofen and robenacoxib, are presented in Table 3. The 413
geometric mean COX-2 IC50 was 44.7 ng/mL (0.14 µM) for robenacoxib and 45.0 ng/mL (0.18 414
µM) for S(+) ketoprofen. 415
416
PK/PD modelling for COX-1 was successful in all animals with robenacoxib and in 6 of 8 cats 417
with S(+) ketoprofen. For the latter, in two cases, the number of blood samples was too low to 418
allow bi-compartmental fitting of plasma concentrations and thus prevented PK/PD modelling. 419
ng/mL (0.67 nM) for S(+) ketoprofen (Table 4). Imax was 97.3 % for S(+) ketoprofen and 96.8 % 421
for robenacoxib. 422
423
Individual concentration-effect curves were simulated using the pharmacodynamic parameters 424
aforementioned. Average pharmacodynamic parameters (aImax, aIC50 and an) for S(+) ketoprofen 425
and robenacoxib for inhibition of COX-1 in serum and COX-2 in exudate were calculated by 426
naïve pooled data analysis (Table 5 and Fig. 7). The concentration-effect curves for COX-1 427
required re-scaling to a maximal effect of 100%. The aIC50 values for COX-1 were 0.45 and 2,56 428
ng/mL for S(+) ketoprofen and robenacoxib and the slopes (an) were 0.66 and 0.87, respectively. 429
Corresponding aIC50 values for COX-2 were 48.5 and 38.2 ng/mL for S(+) ketoprofen and 430
robenacoxib, respectively, and corresponding slopes were 1.04 and 1.46. 431
432
Three categories of indices were used to describe the selectivity of robenacoxib, determined by 433
simultaneous fitting of individual percentage inhibition values from COX-1 and COX-2 assays 434
(Table 6). The IC50COX-1/IC50COX-2 ratio was 1:107 for S(+) ketoprofen and 66.9:1 for 435
robenacoxib. The selectivity of robenacoxib for COX-2 was confirmed at virtually maximal 436
inhibition, as IC99COX-1/IC99 COX-2 was 585:1. The IC20 COX-1/IC80 COX-2 ratio was 1:3,260 437
for S(+) ketoprofen and 1.4:1 for robenacoxib. Predicted percentage inhibitions of COX-1 versus 438
COX-2 are illustrated in Fig. 8; the inhibition of COX-1 by S(+) ketoprofen would be almost 439
maximal for all COX-2 inhibition percentages between 50 and 99%, whereas only 28.2% of 440
COX-1 activity would be inhibited by robenacoxib at 99% COX-2 inhibition. 441
442
DISCUSSION
444
445
S(+) ketoprofen was the predominant enantiomer in the cat, as previously reported for the dog, 446
rat and horse (Foster & Jamali, 1988; Delatour et al., 1993; Landoni & Lees, 1995a). Chiral 447
inversion of R(-) to S(+) ketoprofen occurs in the liver, so that the R(-) enantiomer, although 448
itself of very low potency, is a pro-drug. Therefore, the apparent clearance of R(-) ketoprofen 449
incorporates both elimination and inversion to the S(+) eutomer. Consequently, the drug input 450
for S(+) ketoprofen comprises both the administered drug and S(+) ketoprofen formed by chiral 451
inversion. The inversion rate has been calculated in the cat by separate administration of each 452
enantiomer (Castro et al., 2000; Lees et al., 2003). Simultaneous enantiomer pharmacokinetic 453
modelling was not possible, as the inversion rate could not be identified from the data of the 454
present study. This study confirmed the short half-life of both ketoprofen enantiomers in the cat. 455
The pharmacokinetics of robenacoxib after subcutaneous administration was also consistent with 456
the findings from previous studies (Pelligand et al., 2012b; King et al., 2013), with a short 457
elimination half-life (1.1 h). 458
459
Despite having short elimination half-lives in blood, ketoprofen and robenacoxib demonstrated 460
marked negative hysteresis. Both drugs suppressed exudate PGE2 significantly for up to 36 h. 461
The likely explanation is accumulation of drugs in and slow clearance from the tissue cage. It 462
would have been relevant to test this hypothesis by directly injecting the test article into the 463
tissue cages. The IC50 COX-2 for robenacoxib was somewhat higher at 38.2 ng/mL (0.117 µM) 464
in the present study compared with 14.1 ng/mL (0.043 µM) reported in Pelligand et al. (2012b). 465
COX-1 of 2,557 ng/mL (7.81 µM) in the present study and 2,416 ng/mL (7.38 µM) in the 467
previous investigation. 468
469
The persistence and duration of effect in exudate of ketoprofen enantiomers were similarly long 470
as for robenacoxib. For 2-arylpropionates in general, and for ketoprofen in particular, COX 471
inhibition activity resides almost exclusively with the S(+) enantiomer (Hayball et al., 1992; 472
Suesa et al., 1993; Landoni et al., 1996) in several species including the cat. It is, indeed, 473
probable that COX inhibition in the cat after R(-) ketoprofen administration is attributable solely 474
to the S(+) enantiomer formed in vivo by chiral inversion (Lees et al., 2003). It was therefore 475
justified, in this study, to conduct PK/PD modelling solely on S(+) ketoprofen concentration. 476
477
The IC50 COX-2 for S(+) ketoprofen of 48.5 ng/mL (0.191 µM) was very similar to the IC50 for 478
robenacoxib in the present study (38.2 ng/mL) but was lower than the IC50 reported by Schmid et 479
al. (2010) in in vitro whole blood assays: 119.9 ng/mL (0.472 µM). In serum, the ex vivo IC50 for 480
COX-1 in the present study was 0.454 ng/mL (0.0018 µM) which was lower than the IC50 of 481
5.92 ng/mL (0.023 µM) reported by Schmid et al. (2010) in in vitro assays. Inter-laboratory 482
differences in experimental methodology (ex vivo versus in vitro) and differences in modelling 483
techniques are well recognised as the basis for differing results, even of this relatively high 484
magnitude (Warner et al., 1999). In consequence, we report an IC50 COX-1 / IC50 COX-2 ratio of 485
1:107, which is lower than that obtained by Schmid et al. of 1:20. Despite these numerical 486
differences, both studies confirm that ketoprofen is COX-1 selective in the cat. The time-course 487
of inhibition of TxB2 with ketoprofen was similar to that reported after intravenous 488
490
The present data indicate that ketoprofen and robenacoxib exhibit similar pattern for distribution 491
to a site of acute inflammation, whilst possessing opposite selectivities for inhibition of COX 492
isoforms, ketoprofen for COX-1 and robenacoxib for COX-2. As discussed by (Brune & Furst, 493
2007), the first generation selective COX-2 inhibitors (sulphonamides and methylsulphones) 494
combined reduced gastrointestinal toxicity with prolonged inhibition of constitutively-expressed 495
COX-2 in the vascular wall and kidney. This may explain, at least partially, the reported 496
toxicities of these COXibs with long terminal half-lives and large volumes of distribution. It is 497
therefore likely that tissue selectivity is a potential advantage of second generation COXibs 498
(carboxylic acids) with shorter elimination half-lives. If these drugs exert only a short duration of 499
action on constitutively expressed COX-2 in the central pharmacokinetic compartment, this 500
might provide a higher safety profile, for example for cardiovascular and renal side-effects. As 501
developed in our laboratory, the tissue cage model has allowed investigation of the distribution 502
of robenacoxib and ketoprofen (selected for this study for both their differing COX inhibition 503
profiles and long durations of action despite short half-lives in the central pharmacokinetic 504
compartment) to a site of acute inflammation. It may be regarded as an appropriate model to 505
further our understanding of other carboxylic acid NSAIDs, with similar chemical structures and 506
pharmacokinetic profiles, such as lumiracoxib (COX-2 selective) and diclofenac (COX non-507
selective) (Fig. 8) (Brune & Furst, 2007). 508
509
It should, however, be noted that all tissue cage models are “model dependent”, in that drug 510
diffusion into and from exudate in the cage is influenced by tissue cage geometry (including 511
as drug molecule properties, including protein binding, pKa and lipid solubility. Therefore, tissue 513
cage models cannot mimic either accurately or quantitatively all clinical circumstances. 514
Nevertheless, it is of interest to note that lumiracoxib accumulated in inflamed joints in humans 515
and its concentration was maintained in excess of plasma concentrations for up to 18 h after 516
dosing (Scott et al., 2004). Similarly, ketoprofen penetrated readily into acutely inflamed joints 517
of the horse. At one h after dosing the concentration in synovial fluid was six times higher in 518
inflamed compared to non-inflamed joints (Owens et al., 1994). On the other hand, 519
concentrations of etoricoxib (a coxib of the sulphonamide group) in wound fluids did not exceed 520
plasma concentrations after pre-emptive administration before hip surgery (Renner et al., 2010; 521
Renner et al., 2012). 522
523
It is unlikely that the slow clearance of ketoprofen and robenacoxib from tissue cages was 524
limited by passive diffusion. This is suggested by serum and exudate clearance data. For 525
creatinine, an endogenous, non-protein bound small molecule, a MRTexudate/MRTserum ratioof 526
3.6:1 was obtained by Pelligand et al. (2012a). In contrast, robenacoxib and S(+) ketoprofen 527
MRTexudate/MRTblood ratios in the present study were substantially higher, 24.9:1 and 20.4:1 528
respectively. These high ratios are explained by two factors, slow drug clearance from the tissue 529
cages and short half-lives in plasma. Despite the use of tissue cages of different geometry 530
(spherical polypropylene cages instead of silicon cylinders similar to the feline tissue cages), 531
previous workers showed that the ketoprofen MRT ratio was also high (11.5:1) in the goat 532
(Arifah et al., 2003) and in the calf (10.6:1) (Landoni & Lees, 1995b) though not in the horse 533
selective; the MRTexudate/MRTblood ratio for firocoxib in the dog (a methylsulphone related to 535
rofecoxib) was 1.06:1 and similar to meloxicam 1.08:1 (P. Lees, unpublished data). 536
537
The binding of drugs to and slow release from a component of the inflammatory process, such as 538
protein or a specific cell population, could account for these differing results for NSAIDs 539
(Pelligand et al., 2012b). For example, the search for the ideal radiolabelled marker for imaging 540
COX-2 expression revealed that a radioiodinated derivative of lumiracoxib had a higher affinity 541
and in vitro cell uptake for COX-2 induced macrophages than normal macrophages (Kuge et al., 542
2009). A similar mechanism might explain the slow clearance of robenacoxib from exudate. 543
The prolonged plasma half-life of the sulphonamide COXibs (celecoxib, etoricoxib and 544
valdecoxib) is explained both by slow clearance and relatively high volume of distribution. In 545
contrast, the volume of distribution of carboxylic acid COXibs is very small compared to other 546
classes of COXibs. Thus, lumiracoxib steady state volume of distribution was 9 L in humans 547
(0.13L/kg for a 70kg person, Mysler, 2004) and the distribution volume for robenacoxib was 548
likewise low, 0.19 L/kg in the cat and 0.24 L/kg in the dog (Jung et al., 2009; Pelligand et al., 549
2012b). 550
551
The sulphonamide moiety of a radioiodinated derivative of celecoxib had a high affinity for 552
carbonic anhydrase and this could explain both the preferential distribution into rat erythrocytes 553
(88%) and slow clearance from blood (Boddy et al., 1989; Kuge et al., 2006). Substitution of the 554
sulphonamide moiety to a methylsulphone moiety decreased erythrocyte binding to 18% and 555
increased blood clearance (Kuge et al., 2006). 556
In conclusion, the present data suggest that, despite a short blood half-life, NSAIDs can have a 558
long-lasting local action, as a consequence of high inflammatory tissue selectivity. However, 559
drug distribution into tissue cage fluid is model dependant and cannot be a precise predictor of 560
penetration time course to other anatomical sites. This will indeed depend on a wide range of 561
factors, including specific tissue blood flow and possibly the degree of acute inflammation. 562
Tissue selectivity might be advantageous for carboxylic acids COXibs and some older NSAIDs 563
such as ketoprofen and diclofenac, as systemic side-effects related to COX-1 and COX-2 564
inhibition could be reduced, whilst efficacy in experimental inflammation persists for 24 h or 565
longer after a single dose. 566
567
568
ACKNOWLEDGEMENTS 569
This study was supported by Novartis Animal Health, Inc and the Biotechnology and Biological 570
Sciences Research Council UK (Industrial CASE Award) [grant number: BB/E528544/1] 571
awarded to L.P. We thank Birgit Ranheim for initiating the collaboration with the Oslo School of 572
Veterinary Science. 573
574
DECARATIONS OF INTEREST 575
L. Pelligand received a CASE award from BBSRC and Novartis Animal Health 576
J.N. King is an employee of Novartis Animal Health 577
P. Lees has acted as a consultant to Novartis Animal Health 578
579
581
Arifah, A.K., Landoni, M.F. & Lees, P. (2003) Pharmacodynamics, chiral pharmacokinetics and 582
PK-PD modelling of ketoprofen in the goat. Journal of Veterinary Pharmacology and
583
Therapeutics, 26(2), 139-150. 584
Boddy, A., Edwards, P. & Rowland, M. (1989) Binding of sulfonamides to carbonic anhydrase: 585
influence on distribution within blood and on pharmacokinetics. Pharm Res, 6(3), 203-586
209. 587
Bombardier, C., Laine, L., Reicin, A., Shapiro, D., Burgos-Vargas, R., Davis, B., Day, R., 588
Ferraz, M.B., Hawkey, C.J., Hochberg, M.C., Kvien, T.K. & Schnitzer, T.J. (2000) 589
Comparison of upper gastrointestinal toxicity of rofecoxib and naproxen in patients with 590
rheumatoid arthritis. VIGOR Study Group. New England Journal of Medicine, 343(21), 591
1520-1528. 592
Brune, K. & Furst, D.E. (2007) Combining enzyme specificity and tissue selectivity of 593
cyclooxygenase inhibitors: towards better tolerability? Rheumatology (Oxford), 46(6), 594
911-919. 595
Castro, E., Soraci, A., Fogel, F. & Tapia, O. (2000) Chiral inversion of R(-) fenoprofen and 596
ketoprofen enantiomers in cats. Journal of Veterinary Pharmacology and Therapeutics, 597
23(5), 265-271. 598
Dayneka, N.L., Garg, V. & Jusko, W.J. (1993) Comparison of four basic models of indirect 599
pharmacodynamic responses. Journal of pharmacokinetics and biopharmaceutics, 21(4), 600
457-478. 601
Delatour, P., Benoit, E., Bourdin, M., Gobron, M. & Moysan, F. (1993) [Comparative 602
enantioselectivity of the disposition of two non-steroidal anti-inflammatory agents, 603
ketoprofen and carprofen, in man and animals]. Bulletin de l'Académie nationale de
604
médecine., 177(3), 515-526. 605
Farkouh, M.E., Kirshner, H., Harrington, R.A., Ruland, S., Verheugt, F.W., Schnitzer, T.J., 606
Burmester, G.R., Mysler, E., Hochberg, M.C., Doherty, M., Ehrsam, E., Gitton, X., 607
Krammer, G., Mellein, B., Gimona, A., Matchaba, P., Hawkey, C.J. & Chesebro, J.H. 608
(2004) Comparison of lumiracoxib with naproxen and ibuprofen in the Therapeutic 609
Arthritis Research and Gastrointestinal Event Trial (TARGET), cardiovascular outcomes: 610
randomised controlled trial. Lancet, 364(9435), 675-684. 611
Fosse, T.K., Horsberg, T.E., Haga, H.A., Hormazabal, V. & Ranheim, B. (2011) 612
Enantioselective pharmacokinetics of ketoprofen in piglets: the significance of neonatal 613
age. Journal of Veterinary Pharmacology and Therapeutics, 34(2), 153-159. 614
Foster, R.T. & Jamali, F. (1988) Stereoselective pharmacokinetics of ketoprofen in the rat. 615
Influence of route of administration. Drug metabolism and disposition, 16(4), 623-626. 616
Giraudel, J.M., Diquelou, A., Laroute, V., Lees, P. & Toutain, P.L. (2005a) 617
Pharmacokinetic/pharmacodynamic modelling of NSAIDs in a model of reversible 618
inflammation in the cat. Br J Pharmacol, 146(5), 642-653. 619
Giraudel, J.M., Diquelou, A., Lees, P. & Toutain, P.L. (2005b) Development and validation of a 620
new model of inflammation in the cat and selection of surrogate endpoints for testing 621
anti-inflammatory drugs. J Vet Pharmacol Ther, 28(3), 275-285. 622
Hayball, P.J., Nation, R.L. & Bochner, F. (1992) Enantioselective pharmacodynamics of the 623
nonsteroidal antiinflammatory drug ketoprofen: in vitro inhibition of human platelet 624
Higgins, A.J. & Lees, P. (1984) Arachidonic acid metabolites in carrageenin-induced equine 626
inflammatory exudate. Journal of Veterinary Pharmacology and Therapeutics, 7(1), 65-627
72. 628
Jung, M., Lees, P., Seewald, W. & King, J.N. (2009) Analytical determination and 629
pharmacokinetics of robenacoxib in the dog. Journal of Veterinary Pharmacology and
630
Therapeutics, 32(1), 41-48. 631
Kamata, M., King, J.N., Seewald, W., Sakakibara, N., Yamashita, K. & Nishimura, R. (2012) 632
Comparison of injectable robenacoxib versus meloxicam for peri-operative use in cats: 633
Results of a randomised clinical trial. The Veterinary Journal, 193(1), 114-118. 634
Kelley, M. & DeSilva, B. (2007) Key elements of bioanalytical method validation for 635
macromolecules. The AAPS journal, 9(2), E156-163. 636
King, J.N., Jung, M., Maurer, M.P., Seewald, W., Schmid, V. & Lees, P. (2013) Effects of route 637
of administration and feeding schedule on pharmacokinetics of robenacoxib in cats. Am J
638
Vet Res, 74(3), 465-472. 639
Kristensen, M. & Hansen, T. (2004) Statistical analyses of repeated measures in physiological 640
research: a tutorial. Adv Physiol Educ, 28(1-4), 2-14. 641
Kuge, Y., Katada, Y., Shimonaka, S., Temma, T., Kimura, H., Kiyono, Y., Yokota, C., 642
Minematsu, K., Seki, K., Tamaki, N., Ohkura, K. & Saji, H. (2006) Synthesis and 643
evaluation of radioiodinated cyclooxygenase-2 inhibitors as potential SPECT tracers for 644
cyclooxygenase-2 expression. Nucl Med Biol, 33(1), 21-27. 645
Kuge, Y., Obokata, N., Kimura, H., Katada, Y., Temma, T., Sugimoto, Y., Aita, K., Seki, K., 646
Tamaki, N. & Saji, H. (2009) Synthesis and evaluation of a radioiodinated lumiracoxib 647
derivative for the imaging of cyclooxygenase-2 expression. Nucl Med Biol, 36(8), 869-648
876. 649
Lam, F.C., Hung, C.T. & Perrier, D.G. (1985) Estimation of variance for harmonic mean half-650
lives. J Pharm Sci, 74(2), 229-231. 651
Landoni, M.F., Foot, R., Frean, S. & Lees, P. (1996) Effects of flunixin, tolfenamic acid, R(-) 652
and S(+) ketoprofen on the response of equine synoviocytes to lipopolysaccharide 653
stimulation. Equine veterinary journal, 28(6), 468-475. 654
Landoni, M.F. & Lees, P. (1995a) Comparison of the anti-inflammatory actions of flunixin and 655
ketoprofen in horses applying PK/PD modelling. Equine veterinary journal, 27(4), 247-656
256. 657
Landoni, M.F. & Lees, P. (1995b) Pharmacokinetics and pharmacodynamics of ketoprofen 658
enantiomers in calves. Chirality, 7(8), 586-597. 659
Lees, P., Giraudel, J., Landoni, M.F. & Toutain, P.L. (2004) PK-PD integration and PK-PD 660
modelling of nonsteroidal anti-inflammatory drugs: principles and applications in 661
veterinary pharmacology. Journal of Veterinary Pharmacology and Therapeutics, 27(6), 662
491-502. 663
Lees, P., Taylor, P.M., Landoni, F.M., Arifah, A.K. & Waters, C. (2003) Ketoprofen in the cat: 664
pharmacodynamics and chiral pharmacokinetics. The Veterinary Journal, 165(1), 21-35. 665
Lepist, E.I. & Jusko, W.J. (2004) Modeling and allometric scaling of s(+)-ketoprofen 666
pharmacokinetics and pharmacodynamics: a retrospective analysis. Journal of Veterinary
667
Pharmacology and Therapeutics, 27(4), 211-218. 668
Littell, R.C., Henry, P.R. & Ammerman, C.B. (1998) Statistical analysis of repeated measures 669
Mysler, E. (2004) Lumiracoxib (Prexige): a new selective COX-2 inhibitor. Int J Clin Pract, 671
58(6), 606-611. 672
Nantel, F., Denis, D., Gordon, R., Northey, A., Cirino, M., Metters, K.M. & Chan, C.C. (1999) 673
Distribution and regulation of cyclooxygenase-2 in carrageenan-induced inflammation. 674
Br J Pharmacol, 128(4), 853-859. 675
Ollerstam, A., Visser, S.A., Persson, A.H., Eklund, G., Nilsson, L.B., Forsberg, T., Wiklund, 676
S.J., Gabrielsson, J., Duker, G. & Al-Saffar, A. (2006) Pharmacokinetic-677
pharmacodynamic modeling of drug-induced effect on the QT interval in conscious 678
telemetered dogs. Journal of pharmacological and toxicological methods, 53(2), 174-679
183. 680
Owens, J.G., Kammerling, S.G. & Keowen, M.L. (1994) Anti-inflammatory effects and 681
pharmacokinetics of ketoprofen in a model of equine synovitis. In Abstract of the 6th 682
EAVPT Congress. Journal of Veterinary Pharmacology and Therapeutics, 27(s1), 170-683
171. 684
Pelligand, L., House, A.K., Summers, B.A., Hatzis, A., Tivers, M., Elliott, J. & Lees, P. (2012a) 685
Development and validation of a tissue cage model of acute inflammation in the cat. 686
Journal of Veterinary Pharmacology and Therapeutics, 35, 239-248. 687
Pelligand, L., King, J.N., Toutain, P.L., Elliott, J. & Lees, P. (2012b) PK-PD modelling of 688
robenacoxib in a feline tissue cage model of inflammation. Journal of Veterinary
689
Pharmacology and Therapeutics, 35(1), 19-32. 690
Renner, B., Walter, G., Strauss, J., Fromm, M.F., Zacher, J. & Brune, K. (2012) Preoperative 691
administration of etoricoxib in patients undergoing hip replacement causes inhibition of 692
inflammatory mediators and pain relief. European Journal of Pain, 16(6), 838-848. 693
Renner, B., Zacher, J., Buvanendran, A., Walter, G., Strauss, J. & Brune, K. (2010) Absorption 694
and distribution of etoricoxib in plasma, CSF, and wound tissue in patients following hip 695
surgery--a pilot study. Naunyn Schmiedebergs Arch Pharmacol, 381(2), 127-136. 696
Rudy, A.C., Liu, Y., Brater, C. & Hall, S.D. (1998) Stereoselective pharmacokinetics and 697
inversion of (R)- ketoprofen in healthy volunteers. J Clin Pharmacol, 38(2 Suppl), 3S-698
10S. 699
Schmid, V.B., Seewald, W., Lees, P. & King, J.N. (2010) In vitro and ex vivo inhibition of COX 700
isoforms by robenacoxib in the cat: a comparative study. Journal of Veterinary
701
Pharmacology and Therapeutics, 33(5), 444-452. 702
Scott, G., Rordorf, C., Reynolds, C., Kalbag, J., Looby, M., Milosavljev, S., Weaver, M., Huff, 703
J.P. & Ruff, D.A. (2004) Pharmacokinetics of lumiracoxib in plasma and synovial fluid. 704
Clinical Pharmacokinetics, 43(7), 467-478. 705
Silverstein, F.E., Faich, G., Goldstein, J.L., Simon, L.S., Pincus, T., Whelton, A., Makuch, R., 706
Eisen, G., Agrawal, N.M., Stenson, W.F., Burr, A.M., Zhao, W.W., Kent, J.D., 707
Lefkowith, J.B., Verburg, K.M. & Geis, G.S. (2000) Gastrointestinal toxicity with 708
celecoxib vs nonsteroidal anti-inflammatory drugs for osteoarthritis and rheumatoid 709
arthritis: the CLASS study: A randomized controlled trial. Celecoxib Long-term Arthritis 710
Safety Study. Journal of the American Medical Association, 284(10), 1247-1255. 711
Suesa, N., Fernandez, M.F., Gutierrez, M., Rufat, M.J., Rotllan, E., Calvo, L., Mauleon, D. & 712
Carganico, G. (1993) Stereoselective cyclooxygenase inhibition in cellular models by the 713
Tomlinson, A., Appleton, I., Moore, A.R., Gilroy, D.W., Willis, D., Mitchell, J.A. & 715
Willoughby, D.A. (1994) Cyclo-oxygenase and nitric oxide synthase isoforms in rat 716
carrageenin-induced pleurisy. Br J Pharmacol, 113(3), 693-698. 717
Toutain, P.L. & Bousquet-Melou, A. (2004) Plasma clearance. J Vet Pharmacol Ther, 27(6), 718
415-425. 719
Vasquez-Bahena, D.A., Salazar-Morales, U.E., Ortiz, M.I., Castaneda-Hernandez, G. & 720
Troconiz, I.F. (2010) Pharmacokinetic-pharmacodynamic modelling of the analgesic 721
effects of lumiracoxib, a selective inhibitor of cyclooxygenase-2, in rats. Br J Pharmacol, 722
159(1), 176-187. 723
Viswanathan, C.T., Bansal, S., Booth, B., DeStefano, A.J., Rose, M.J., Sailstad, J., Shah, V.P., 724
Skelly, J.P., Swann, P.G. & Weiner, R. (2007) Quantitative bioanalytical methods 725
validation and implementation: best practices for chromatographic and ligand binding 726
assays. Pharm Res, 24(10), 1962-1973. 727
Wallace, J.L., Chapman, K. & McKnight, W. (1999) Limited anti-inflammatory efficacy of 728
cyclo-oxygenase-2 inhibition in carrageenan-airpouch inflammation. Br J Pharmacol, 729
126(5), 1200-1204. 730
Warner, T.D., Giuliano, F., Vojnovic, I., Bukasa, A., Mitchell, J.A. & Vane, J.R. (1999) 731
Nonsteroid drug selectivities for cyclo-oxygenase-1 rather than cyclo-oxygenase-2 are 732
associated with human gastrointestinal toxicity: a full in vitro analysis. Proc Natl Acad
733
Sci U S A, 96(13), 7563-7568. 734
Yamaoka, K., Nakagawa, T. & Uno, T. (1978) Application of Akaike's information criterion 735
(AIC) in the evaluation of linear pharmacokinetic equations. J Pharmacokinet Biopharm, 736
6(2), 165-175. 737
738 739
Figure legends: 741
Figure 1: Chemical formulae for ketoprofen and diclofenac related COXibs: lumiracoxib and 742
robenacoxib 743
744
Figure 2: Observed plasma S(+) ketoprofen (●), R(-) ketoprofen (■), exudate S(+) ketoprofen (○) 746
and exudate R(-) ketoprofen (□) concentrations (ng/mL) versus time (h) profiles after 747
subcutaneous administration of racemic ketoprofen at a total dose of 2 mg/kg. Results from eight 748
cats are presented as mean ±SD. 749
750
Figure 3: Observed blood (●) and exudate (○) robenacoxib concentration (ng/mL) versus time 751
(h) profiles after subcutaneous administration of a 2 mg/kg dose. Results from 8 cats are 752
presented as mean +SD. 753
Figure 4: Individual exudate robenacoxib concentration (ng/mL) versus time (h) profiles after 755
subcutaneous administration of a 2 mg/kg dose. 756
757
Figure 5: Exudate PGE2 concentration (ng/mL) versus time (h) profiles after carrageenan 758
injection and placebo, racemic ketoprofen (2mg/kg total dose) and robenacoxib (2 mg/kg) 759
subcutaneous administration. PK/PD modelling is relevant to the time-response profile as a 760
whole rather than to the response at sampling times taken separately and therefore values are 761
presented as mean ±SEM. Statistical comparison of effect of treatment versus placebo (* = P 762
<0.05) at different times (linear mixed effect model). 763
Figure 6: Serum TxB2 concentration (ng/mL) versus time (h) profile after placebo, racemic 765
ketoprofen (2 mg/kg total dose) and robenacoxib (2 mg/kg) subcutaneous administration. PK/PD 766
modelling is relevant to the time-response profile as a whole rather than to the response at 767
sampling times taken separately and therefore values are presented as mean ±SEM. Statistical 768
comparison of effect of ketoprofen versus placebo (* = P <0.05) and robenacoxib versus placebo 769
(£ = P <0.05) at different times (linear mixed effect model). 770
771
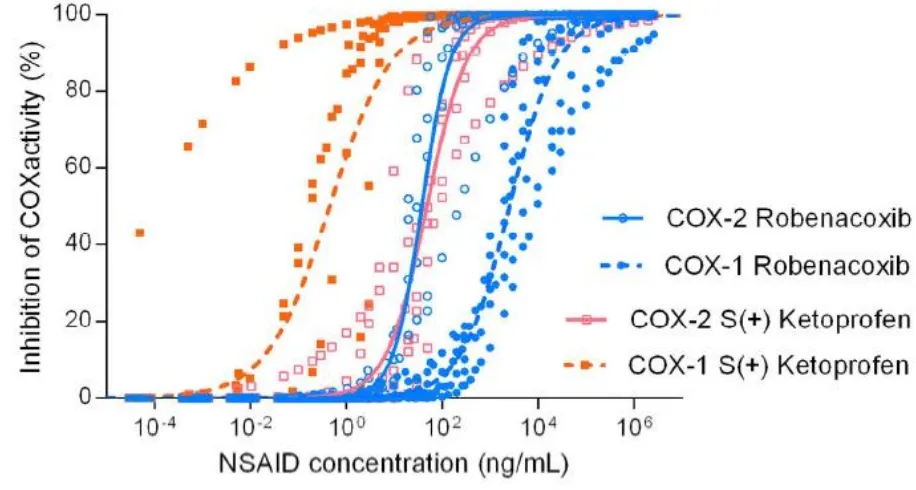
Figure 7: Observed and fitted COX inhibition (%) versus S(+) ketoprofen (red) and robenacoxib 773
(blue) concentrations (ng/mL). Open and closed symbols represent COX-2 and COX-1, 774
respectively. COX-1 data were rescaled for 100% Imax. In a naïve pooled data analysis, average 775
regression curves for COX-1 and COX-2 were fitted with a sigmoid Imax model to all individual 776
curves (n= 6 to 8 cats for each regression curve). 777
778
Figure 8: Inhibition percentage of COX-2 and corresponding inhibition percentages of COX-1 780
for a range of concentration of S(+) ketoprofen and robenacoxib. Mean inhibition curves were 781
computed by non-linear regression, fitting an average Hill equation (Imax model) to individual 782
concentration-effect profiles (ranging from 0 to Imax and rescaled on 0-100% scales), previously 783
obtained by solving PK/PD models for serum TxB2 inhibition (COX-1 activity) and exudate 784
PGE2 inhibition (COX-2 activity). Average NSAID concentrations for given inhibition 785
percentages of COX-2 were used to determine corresponding COX-1 inhibition percentage. 786
Dotted lines indicate cut off values for inhibition of COX-1 (above 20% inhibition of COX-1 787
increased risk of side-effects) and COX-2 (above 80% inhibition of COX-2 correlates with good 788
clinical efficacy). 789