Article
1
Microgrid as a Cost-Effective Alternative for Rural
2
Network Underground Cabling for Adequate
3
Reliability
4
Sanna Uski 1,*, Erkka Rinne 1 and Janne Sarsama 1,*
5
1 Technical Research Centre of Finland Ltd; [email protected]
6
* Correspondence: [email protected]; Tel.: +358-20-722-5052
7
8
Abstract: Microgrids can be used for securing power supply during network outages. Underground
9
cabling of distribution networks is another effective, but conventional and expensive alternative to
10
enhance reliability of power supply. This paper presents firstly an analysis method for the
11
determination of microgrid power supply adequacy during islanded operation, and secondly, a
12
comparison method for overall cost calculation of microgrids vs. underground cabling. The
13
microgrid power adequacy during a rather long network outage is required in order to indicate high
14
level of reliability of supply. The overall cost calculations consider the economic benefits and costs
15
incurred combined for both the distribution network company and the consumer. Whereas the
16
microgrid setup determines the islanded operation power adequacy and thus the reliability of
17
supply, the economic feasibility results from the normal operations and services. The methods are
18
illustrated by two typical, and even critical, case studies in rural distribution networks: an
electric-19
heated detached house and a dairy farm. These case studies show that even in case of a single
20
consumer, a microgrid option could be more economical than network renovation by underground
21
cabling of a branch in order to increase reliability.
22
Keywords: battery energy storage system (BESS), PV, micro CHP, microgrid, islanded operation,
23
distribution network, network outage, reliability, underground cable
24
25
1. Introduction
26
By definition, a microgrid is a cluster of sources, storage systems and loads, forming a
semi-27
autonomous, controllable, and flexible small electrical entity at the connection point towards the
28
wider power system [1,2]. The capability to operate at times as an intentionally disconnected island
29
from the rest of the power system was added to the definition of a microgrid only later [3,4]. As a
30
microgrid has a variety of operational functions and technical requirements, microgrid systems
31
become complex [5].
32
Potential microgrid revenue streams that can offset investment and business-as-usual costs
33
according to [5] are:
34
• Participation in Demand Response programs;
35
• Export of on-site generation to the electricity grid;
36
• Reduced costs due to added resiliency against outages and lost loads;
37
• Participation in local microgrid energy markets.
38
The profitability possibilities of residential microgrids as aggregator-based solution from the
39
perspective of different stakeholders, e.g., utility, aggregator, and prosumer, were analyzed in [6].
40
The feasibility and profitability of microgrids participating in primary frequency control reserve
41
(FCR) market through an aggregator were assessed in [7]. Furthermore, [8] analyzed battery energy
42
storage system (BESS) usage on the frequency regulation market.
43
According to [9] underground cabling of the network is an effective way for distribution system
44
operators (DSOs) to increase the reliability of power supply. However, underground cabling is
45
expensive.
46
Today, farming is highly automated and electricity dependent [10] and even short power
47
interruptions are very detrimental. Farming is an energy intensive industry [11], and thus farmers
48
value reliability of electricity supply more than most of the other customer groups.
49
Farms are located naturally in rural areas, possibly on the long distribution network radial
50
branches with low electricity customer density. The majority of farmers have back-up generators (e.g.
51
[11]). Farmers having own power production to cover a portion of their electricity need is gaining
52
popularity.
53
Several recent studies have focused on microgrid islanded mode operation, microgrid energy
54
management system, and power supply adequacy and forecast, e.g. [12–14]. Ref. [12] assessed power
55
supply capability in islanded mode operation within a couple of hours by using a simulation time
56
step of maximum 1 minute. Electro-technical aspects of an unexpected microgrid islanded operation
57
were also analyzed in [14] while considering optimal energy management of the microgrid and
58
anticipating an outage at any hour. Grid-connected microgrid economic operating strategy was
59
proposed in [15] to minimize the operating cost for the operating period of 24 hours-ahead.
60
Characteristics of, e.g. the Finnish rural medium voltage (MV) networks are long distances and
61
low loads, and thus, underground cabling to increase reliability is not an economical option as-is for
62
the distribution network development. However, the legislation steers towards underground cabling
63
and cabling is incentivized by the regulation framework.
64
Ref. [16] posed a question, on which reliability indices the network development actions actually
65
should be based on, optimizing the number of faults, duration of faults, outages cost, or yet on some
66
other index. The indices in several Finnish studies considering the economics of cabling and
67
increasing reliability of power supply, are based on the results and data of a study from 2005, and the
68
regulation model framework, e.g., [16–19]. The studies evaluate the DSO investment profitability
69
only compared to the outage costs (or cost of energy not supplied, CENS). The customer-side and
70
possible co-operative technical and shared economic alternatives have not been considered.
71
Studies have shown other alternatives’ feasibility potential instead of underground cabling, e.g.,
72
BESS as back-up to cope with short interruptions up to a couple of hours, [19,20]. BESS sizing methods
73
in different microgrid application have been reviewed in [21], and [22] presented an analytical
74
approach in general level for the sizing of a backup storage unit.
75
The legislation and regulation - as subject to changes - are omitted in this study. Compared to
76
network cabling, the primary focus is on using microgrids as a means to increase consumer reliability
77
of power supply in addition to increasing energy self-sufficiency of the prosumer, and possibly
78
benefit from other revenue streams. Microgrid option being the overall optimal economic solution, it
79
would provide cost reductions either for electricity users, the DSO, or both. The incentives and
80
possibilities to invest in microgrids, however, might not be common for all the relevant stakeholders.
81
This paper presents a cost and performance analysis of microgrid to be enabled up to a few days
82
islanded operation compared to underground cabling option as means to reach a high level of
83
reliability of power supply. Two case studies of typical and significant rural customers are analyzed
84
for demonstrating the assessment framework and to illustrate the potential economic feasibility of
85
the microgrid option over underground cabling.
86
Section 2 presents background information for the framework, the assessment method for
87
microgrid power adequacy is presented in section 3, the economic comparison method in section 4,
88
the case studies data is given in section 5, and the results in section 6. Finally, the results are discussed
89
in section 7 and conclusions are provided in 8.
90
2. Distribution networks, reliability and microgrids – formation of the case studies
94
General distribution network cabling and reliability issues, especially in Finland where the study
95
cases are located, are discussed in section 2.1, background for the microgrid cases for the study in
96
section 2.2, electricity market data in section 2.3, covering general consumer electricity purchase and
97
small-scale producer electricity sales, as well as other possible microgrid income options.
98
2.1. Distribution network reliability and underground cabling
99
The maximum interruption duration to be endured is difficult to determine. The average
100
interruption duration may be only a few hours, but individual interruptions may last for several days.
101
The probability of short interruptions is higher, but long interruptions cause bigger damages to
102
consumers. The required BESS back-up power supply capacity and related costs depend greatly on
103
the dimensioning interruption duration. A relatively long network outage durations should be
104
considered, and thus up to a few days duration is assumed in this study.
105
Farms in practice invest in a reserve power generator sets to prepare for outages. A simple
106
generator set with low investment cost is assumed in this study (see Appendix A).
107
A DSO considers profitability and costs from its own perspective in accordance to the regulation,
108
and the consumers consider their own finances. In the alternative method presented in this paper,
109
specific network cabling case overall costs are compared in a straightforward manner to the
110
microgrid option overall costs, combining the costs of the consumer/microgrid owner and the
111
network company. The data used is presented in Appendix A. Cable costs are rough mean costs of
112
the cost data used in the network regulation model in Finland [23].
113
2.2. Microgrid case studies
114
Small microgrids consisting of a single customer or a few of them, most likely will require a BESS
115
and some local electricity production in order to guarantee reliability of supply in islanded operation.
116
The microgrid profitability increases the more useful functions the microgrid and its components
117
have.
118
In addition to BESS contributing to secure power supply during network outages, it would be
119
used for balancing own power production with consumption, and enable to handle
electro-120
technically the microgrid islanded operation in a stable manner. Appropriate measures and careful
121
technical planning is required, but the technical and control aspects are not considered in this study.
122
The selected case studies are (i) a large dairy farm and (ii) a regular size detached house with
123
electric heating. The case studies reflect well the typical rural area electricity users and the main
124
customer groups, and are among those with most critical needs of uninterrupted electricity supply
125
within the respective customer groups.
126
Both case studies include a BESS and PV production. In addition the farm has a micro CHP plant
127
operating with wood chips (which technology feasibility is already proven). Microgrid data is
128
provided in Appendix A.
129
2.3. Electricity market data
130
For the electricity consumption, general electricity cost and distribution fee in Finland are
131
considered. The possible excess power in the microgrid can be sold to the network, and typical
132
electricity price and power transmission fee for grid-infeed power are considered. The electricity
133
purchase and sales figures presented in Appendix A are roughly estimated based on recent historical
134
prices in Finland. Small-scale production of electricity to one’s own use in Finland is tax free.
135
Relevant reserve market and revenue possibility for the microgrid with BESS capacity is on the
136
frequency control reserve for disturbances (FCR-D). Prosumer participation to the reserve market
137
would take place via an aggregator service provider (e.g., as in [6,7]), which would take care of the
138
formalities against a reasonable fee for the services. This fee is expected to be relatively small and
139
Load response could be an opportunity also for earnings as a system service, as well as a means
141
to prioritize produced electricity own use and minimize exchange of electricity with the network.
142
Demand response or load control was not considered for simplicity in this study.
143
3. Electricity supply adequacy assessment in microgrids during network outages
144
The microgrid electricity supply adequacy is assessed considering a full year from an hour to
145
hour. For the assessment, hourly data and simulation is used. Intra-hour variability and control is
146
assumed to be able to be handled with the BESS and other possible microgrid components. Hourly
147
time sampling is needed in order to catch the variability of PV generation, diurnal electricity
148
consumption behavior in addition to seasonal and weekly variations, combined with the requirement
149
of having sufficient electricity supply to meet the consumption at all times during network outages.
150
The calculation of the power supply adequacy is implemented in a MATLAB script. The general,
151
normal state, analysis is described in section 3.1, and section 3.2 describes the subroutine for the
152
islanded operation calculations.
153
3.1. Microgrid operation under normal state
154
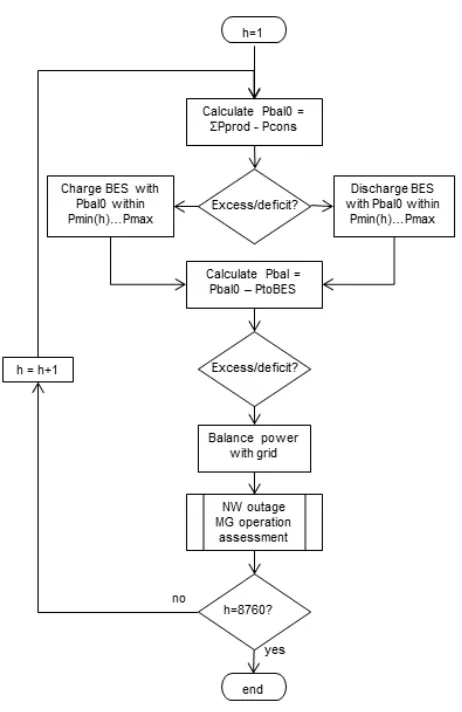
The principles of the proposed calculation procedure are presented by a flowchart in Figure 1.
155
In order to prepare for an unexpected network outage taking place at any time, a minimum charge
156
in the BESS is maintained. The minimum charge may be, e.g., a fixed constant charging level of the
157
BESS throughout the year, dependent on the historical electricity usage, or dependent on the time of
158
the year. The momentary BESS charge level can be i) at minimum charge limit, ii) below observation
159
hour minimum charge limit, iii) fully charged, or iv) between the minimum limit and full.
160
Considering the observation hour electricity consumption and total own power production, the BESS
161
is charged and discharged depending on the status of the BESS, and the microgrid electricity deficit
162
or surplus. For simplicity, this is not depicted in the flowchart.
163
166
Figure 1. The procedure used in the MATLAB script for calculating the hourly power balance and
167
power supply adequacy throughout the year in normal operation.
168
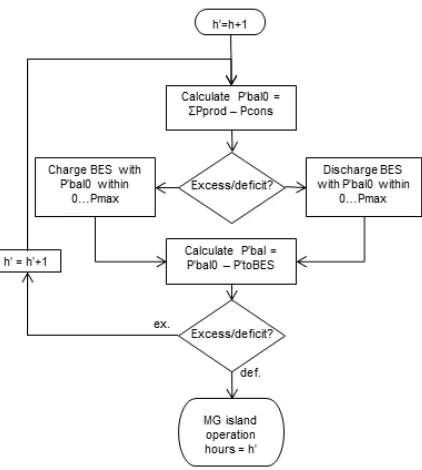
3.2. Microgrid operation during network outage
169
The microgrid should be prepared for a network outage at all times. The duration of the possible
170
outages are unknown. As the microgrid option (to increase reliability of power supply) is compared
171
to the distribution network underground cabling option, the microgrid power supply adequacy
172
should reflect similar reliability as that of the cabled network. Thus a couple of days islanded
173
operation capability is used as the target.
174
In an islanded mode operation, the micro CHP plant is assumed to be able to put in operation
175
within an hour and it would be able to produce maximum electric power during islanded operation.
176
The microgrid options – by varying different parameters and assumptions used – can be
177
assessed for the duration of power supply adequacy over the whole year, for each hour of the year.
178
Section 3.1 and flowchart in Figure 1 presented the calculations for the normal states, and thus the
179
initial situations for the microgrid islanded operation for each hour of the year. Flowchart in Figure
180
2 presents the calculation procedure (“MW outage MG operation assessment” sub-procedure in
181
Figure 1 flowchart) for the assessment of microgrid islanded mode operation and electricity supply
182
adequacy for each respective hour.
183
185
Figure 2. The MATLAB script sub-procedure for calculating the power supply adequacy and
186
maximum duration in islanded operation.
187
4. Overall economic comparison and economic influence on stakeholders
188
The DSO’s regulated monopoly business is to provide electricity consumers sufficiently reliable
189
electricity distribution at a reasonable fee. Network company business should also be a profitable for
190
the company owners.
191
Interest rate of 2 % is used. For all the investments, equivalent annual costs are calculated, thus
192
enabling the comparison of costs in an annual level. Value added tax in Finland applicable for most
193
of the relevant taxed items is 24 %. For simplicity, this tax rate is used in the calculations for all the
194
taxed items.
195
The calculations for the overall economic comparison of the underground cabling and microgrid
196
options are described in section 4.1. In addition, the cabling investment and microgrid option
197
economic influence on the different stakeholders (the network company, the consumer, and the state)
198
are presented in section 4.2.
199
4.1. Calculations for the overall economic comparison
200
The overall economical option is determined by comparing the equivalent annual cabling option
201
index costs Ccab,ann,TOT and microgrid option index costs CMG,ann,TOT.
202
Consumer power purchase from the market, and thus the electricity delivered by the network
203
company to the consumer/prosumer affects the network company income from power distribution.
204
As an income to the network company, it is an expense to the consumer. If considering both in the
205
overall economic calculations, distribution fee (which could be even large) would be cancelled out
206
and the distribution fee would not affect the results. The interest of the consumer is considered more
207
significant, and in this context the aim should not be to increase network company income by cabling
208
investments (indirectly through regulation) or prevent decrease of income over possible consumer
209
benefits. Furthermore, the consumer could become a prosumer regardless of the cabling or other
210
means of securing the power supply, e.g. by microgrid option and BESS. Therefore, “index costs”,
211
omitting the DSO power distribution income in the overall economic calculations are being used for
212
the comparative purposes of the two options.
213
4.1.1. Underground cabling option
216
In the underground cabling option, only the investment cost on the cable and the cable trench are
217
considered according to the specified price data provided by the Finnish energy authority. Other
218
component investments are omitted. In the illustrative farm case study an investment on a 20 kV
219
cable of 10 km is considered, and in the detached house case study an investment on a 0.4 kV low
220
voltage cable is considered. The cable investment equivalent annual cost Ccab.inv,ann is calculated.
221
The consumer costs in the cabling option consist of the total annual electricity costs, Ccons.cab,
222
including the energy purchase from the market and power distribution fee. In addition a consumer
223
investment cost, Cgs.inv,ann, of the mandatory generator set for reserve power during outages is
224
considered in the farm case study. The expenses of the possible use of this generator set are omitted.
225
Thus, the total index costs of cabling option for the comparison are
226
Ccab,ann,TOT = Ccab.inv,ann + Ccons,cab + Cgs.inv,ann. (1)
4.1.2. Microgrid option
227
The microgrid option costs consist of the investment costs on the BESS (CBESS.inv,ann), PV (CPV.inv,ann),
228
and CHP power plant (CCHP.inv,ann) as the appropriate share of total plant investment on electricity
229
production (electricity production capacity per total electricity and heat production capacity), all
230
expressed as equivalent annual costs. Other costs consist of annual maintenance with CHP plant
231
fuel-related expenses etc. (Cmaint) and electricity purchase cost (Ccons,MG) including energy and power
232
distribution fees. The possible prosumer income from surplus electricity sales (Yprod, with
233
transmission fees subtracted) and system services (Yserv) are also considered in the cost calculation.
234
The total index costs of the microgrid option for the comparison are
235
CMG,ann,TOT = CBESS.inv,ann + CPV.inv,ann + CCHP.inv,ann + Cmaint + Ccons.MG - Yprod - Yserv. (2)
4.2. Economic influence on the relevant stakeholders
236
The underground cabling and microgrid option may have different influence on the different
237
stakeholders. The same calculation data as in section 4.1 is used for the assessment of economic
238
influence of the two options on different stakeholders, DSO, consumer/prosumer, and the state.
239
240
4.2.1. Distribution system operator
241
A rough assessment of direct economic influence of the cabling and microgrid options on the DSO
242
income are calculated as
243
, = . , − . ,
, = . , + . ,
, (3)
where Ydist.fee,cab and Ydist.fee,MG are the distribution net income of the power supplied to the customer
244
in the cabling and microgrid options respectively, and Ytrans.fee,MG is the power transmission net income
245
of the microgrid power fed to the grid.
246
4.2.2. Consumer / prosumer
247
All the microgrid investments and costs are assumed to be covered by the consumer/prosumer. The
248
economic influence of the cabling and microgrid options for the consumer/prosumer as costs are
249
, = , + . ,
, = . , + . , + . , + + , − − . (4)
4.2.3. State
251
The economic influence of the alternative options on the state tax income may be relevant for a
252
consideration. The very rough estimates are calculated for the assessment of comparison of state tax
253
income level in the cabling and microgrid options in order to get indication of possible significant
254
differences. The calculations are with total component investment costs C and lifetimes L
255
, =
,
+ , + , +
, =
,
+ , , + , + , + + +
, (5)
where s is value added tax, tel the electricity tax, and Ecab and EMG the electricity bought from the grid
256
in cabling and microgrid cases respectively.
257
5. Microgrid data and specifics for the case studies
258
The case study loads are described in section 5.1, BESS units in section 5.2, PV production in
259
section 5.3 and the CHP power plant in section 5.4. The technical and economic data specifics and
260
parameter values for the case studies are presented in Appendix A.
261
5.1. Electricity consumption
262
A pre-determined hourly data series of electricity consumption was used. The consumption was
263
considered independent from the microgrid operating state – network connected or islanded
264
operation. Load was not controlled in order to obtain longer islanded operation capability, nor to
265
minimize power exchange with the network in normal state.
266
In addition to electric heating, the detached house has a fireplace for heating. Thus, it is a rather
267
typical house in rural areas in Finland with high electricity consumption of approximately 14 MWh/a.
268
Actual historical electricity consumption data series of a consumer was used.
269
The dairy farm case was with about 180 cows and corresponding electricity consumption of
270
approximately 261 MWh/a. The farm data series was created based on data from similar size farms.
271
Daily consumption profile was based on diurnal consumption data of a large cowhouse in a winter
272
day, and the variation from day to day throughout the year was approximated by creating sliding
273
data series based on monthly electricity consumption. The dataset was then suitably scaled for the
274
specified annual consumption.
275
5.2. BESS units
276
Despite the significant difference in annual electricity consumption, both case studies were
277
assumed with identical BESS units due to the backup power supply need during long network
278
outages.
279
The calculations presented in this paper do not consider a decrease in electric capability of the
280
BESS units over time. The data was estimated based on the recent global BESS market trends, and the
281
investment costs may easily change. In addition the cost range of used prices has been rather broad
282
in different studies (e.g., [19,20]).
283
Different BESS minimum charge principles were determined for the case studies. In the farm
284
case the minimum charge was predetermined as function of the electricity consumption, ranging
285
from 50 % of Emax,BESS. to Emax,BESS. The hourly minimum was determined by a scaling coefficient
286
calculated as a sliding average of the electricity consumption of 24 previous hours.
287
For the detached house, the BESS minimum charge was predetermined by assessing the
288
consumption and production data. During high consumption and low PV production at winter
289
months, December and January, the limit was set to Emax,BESS, and 75 % of Emax,BESS during the low
consumption and high PV production in the summer time approximately from March to October.
291
For the other times the limit was determined by linear interpolation between 75 % and 100 % of
292
Emax,BESS.
293
In normal operation, the BESS charging level was at least the minimum charge at all times, i.e.
294
at least 50 % in the farm case and 75 % of Emax,BESS in the detached house case. Thus, quite large amount
295
of energy is stored in the BESS and it would be able to provide nominal power easily for a short
296
period of time (from seconds to minutes) without discharging significant portion of energy.
297
Therefore, the BESS minimum charge was considered to be sold as FCR-D reserve on an annual
298
agreement. In the case studies the BESS is charged at least at specified minimum charge level 100 %
299
of the time (excluding possible network outage and post-outage periods). There may be times when
300
the BESS charge cannot be available or is fully needed for the preparation of islanded operation and
301
thus the BESS capacity is assumed to be sold to FCR-D market only 7000 h/a in the study cases. The
302
possible income for activated FCR-D reserve capacity was not taken into account in the calculations.
303
5.3. PV production
304
An hourly PV production data series was created for a specific location (in Finland) based on
305
MERRA-2 time series data on radiation [24] and air temperature [25]. The daily average radiation and
306
temperature were scaled to match monthly values from PVGIS database [26,27]. PV panel generation
307
(in per units) was calculated considering location and temperature, and selected panel tilt given by
308
PVGIS “optimal inclination angle”. The PV generation data series was then scaled appropriately for
309
the selected PV capacity in the case study. The same per unit dataset was used for both the detached
310
house and the farm.
311
5.4. Micro CHP production
312
Gasification based CHP power plants have a cold start time of less than an hour and
313
controllability of 1 kW/s. Furthermore, a wood chip fueled CHP plant can be controlled, whereas its
314
optimal production level and electricity production depends also on heat demand.
315
For this case study – combined with substantial PV production and BESS – the CHP plant was
316
offline during the warm and sunny summer period. At other times, its production was scaled
317
according to pre-determined data series based on the annual total production of 150 MWh, and a
318
scaling coefficient. The coefficient was determined for each hour as a sliding average of the electricity
319
consumption of 24 previous hours.
320
In the case of network outage occurring and CHP plant being offline, the CHP plant is assumed
321
to be started within one hour to support the microgrid islanded operation power supply.
322
6. Case study results
323
The assessment of the microgrid configuration for acceptable reliability of power supply were
324
done based on the procedure described in section 3, and the results are presented here in section 6.1.
325
The calculations for economic comparison of the microgrid and underground cabling option were
326
done in accordance to section 4.1, and the influence on different stakeholders was assessed based on
327
section 4.2. All economic calculation results are presented in section 6.2.
328
6.1. Analysis of reliability of power supply
329
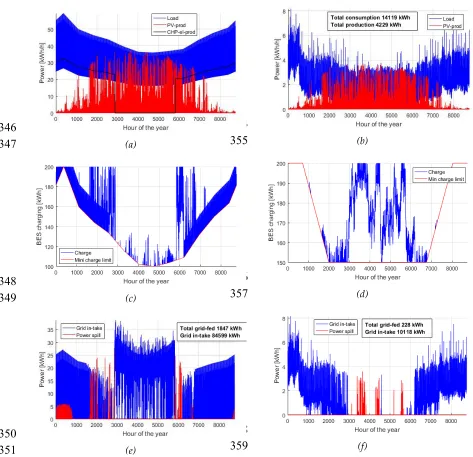
With the specified and adjusted assumptions and data, the microgrid electricity consumption,
330
and electricity production hourly data curves for the whole year are presented in Figure 3(a), the
331
BESS charging level in Figure 3(c), and the power feed-to and in-take-from the network are presented
332
in Figure 3(e) for the farm case. The corresponding data for the detached house case are presented in
333
Figure 3(b), 3(d) and 3(f) respectively. The total consumption and power production of the case study
334
microgrids are presented in Table 1.
335
Table 1. Microgrid consumption and production in the case studies.
337
Case study Cons. [kWh/a] Prod. [kWh/a]
Farm 275 028 192 288
Detached house 14 119 4 229
338
Analysis of islanded operation throughout the year for each hour indicated that the microgrid
339
electricity supply would be sufficient during an interruption at minimum 58 hours in the farm case
340
and 41 hours in the detached house case. The islanded operation capability incidents were binned
341
based on the duration of the adequate power supply. The numbers of occurrences with the shortest
342
durations are presented in Table 2. The rest of the hours of the year, power adequacy was sufficient
343
for more than 3 days.
344
345
346
(a)
347
348
(c)
349
350
(e)
351
352
353
354
(b)
355
356
(d)
357
358
(f)
359
Figure 3. Farm and detached house case study hourly input and result data series for the study year:
360
dynamic minimum charge level and Pn (c - farm, d - detached house), electricity taken from and fed
362
to the grid (e - farm, f - detached house).
363
Table 2. Case study microgrid islanded operation with adequate power supply if less than 3 days.
364
Farm Detached house
Capability
duration
Number of
occurrences % of year
Number of
occurrences % of year
<12 h 0 0.0 % 0 0.0 %
12…<24h 0 0.0 % 0 0.0 %
24h…<2days 0 0.0 % 272 3.1 %
2…<3 days 87 1.0 % 593 6.8 %
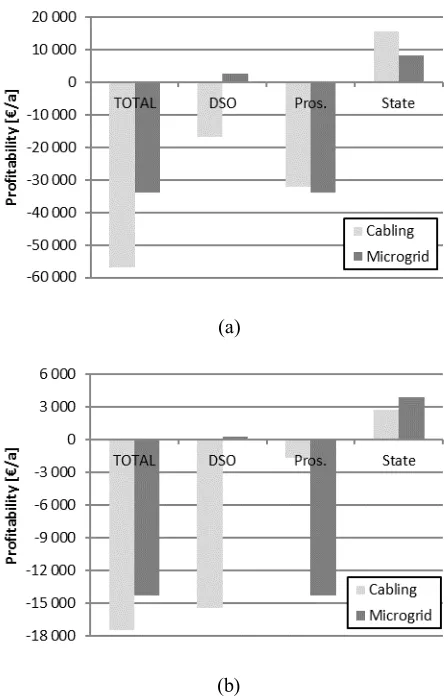
6.2 Calculations for economic comparison
365
The total equivalent annual costs for the cabling and microgrid option were calculated with (1)
366
and (2). In addition, the economic influence of the options was assessed individually on each
367
stakeholder by (3) to (5). The case study results are presented and compared in Figure 4.
368
369
(a)
370
371
(b)
372
Figure 4. Cabling and microgrid option total costs, as well as economic influence on the DSO,
373
consumer/prosumer, and the state in (a) the farm case study, and (b) detached house case study.
374
7. Discussion
376
A number of assumptions were considered, especially regarding the calculation of economic
377
comparison of microgrid option with a distinct underground cabling investment option. The results
378
provide insight for further studies and indication of the results.
379
The two case studies were a single consumer detached house and a farm. Despite almost 20-fold
380
difference in electricity consumption and own PV production of appropriate capacity, both
381
prosumers required identical BESS capacity in order to able to reach approximately the same and
382
sufficiently high level of reliability of power supply in case of network outages. This result implies
383
that own variable production combined with storage may not be sufficient or profitable solution to
384
guarantee reliability of supply in the case of long network outages.
385
In the farm case study, the total costs of the microgrid option are significantly smaller than in
386
the cabling option, thus favoring the microgrid as a means to cope with the reliability of power supply
387
instead of cabling. The most of the costs would be covered by the prosumer. In addition, the
388
microgrid option – with the given assumptions – would be slightly more expensive for the prosumer.
389
The DSO’s income is negative in the cabling case, but positive in the microgrid case. Thus, the benefit
390
and the costs could be shared between the DSO and the prosumer. In the case of the microgrid option,
391
the state tax income would be somewhat smaller than in the cabling option in the reasonable case of
392
the farm.
393
The total costs in the detached house case also indicate the microgrid option to be more economic
394
one. However, the costs would be practically totally covered by the prosumer, and the BESS
395
investment is extremely expensive compared to the prosumer annual costs in the cabling alternative.
396
Thus, this option is not feasible as-is.
397
8. Conclusion
398
Microgrid in rural area could be an economic alternative to underground cabling in specific
399
cases. Underground cabling being costly to the DSO, the microgrid BESS could be partially or fully
400
invested on by the DSO in order to make the microgrid option profitable also to the consumer besides
401
the DSO.
402
Furthermore, combining controllable generation into a microgrid in addition to weather
403
dependent generation, results in a more feasible solution and enables a reasonable duration of
404
islanded operation.
405
The microgrid option would be a solution based on a willingness and common understanding
406
between the DSO and the consumer, among the relevant stakeholders and is a question of shared
407
benefit that also depends on the network company regulation model and its development
408
409
Author Contributions: The literature review, modeling, simulations, and the analysis was done by Sanna Uski.
410
Erkka Rinne created the PV data set and provided the relevant description for the manuscript. Sanna Uski
411
prepared the manuscript and Janne Sarsama contributed on the revision of the manuscript especially on the
412
reliability issues.
413
Funding: This research was funded by Strategic Research Council at the Academy of Finland, under project
414
“Transition to a resource efficient and climate neutral electricity system” (EL-TRAN) grant number 293437.
415
Acknowledgments: Contribution of our colleague Kim Forssén is very much appreciated for the efforts in
416
collecting information and data for the case studies. Authors thank our colleague Riku Pasonen for load data of
417
a detached house and Jari Ihonen for the advice on possibilities to increase BESS profitability. In addition we
418
owe gratitude to Jukka Konttinen and his team in Tampere University of Technology for information and advice
419
regarding micro CHP power plants, and Tapani Jokiniemi from Helsinki University for the efforts providing
420
data of large farms. Furthermore, farmers providing background information for this study are greatly
421
appreciated.
422
Conflicts of Interest: The authors declare no conflict of interest. The funders had no role in the design of the
423
study; in the collection, analyses, or interpretation of data; in the writing of the manuscript, and in the decision
424
426
427
Appendix A
428
Table A.1 Cabling option case study data assumptions.
429
Mandatory farm gen-set:
Cinv,gs investment cost for mandatory gen.set 4 000 €
Lgs expected lifetime / investment period 10 a
Cable investment data:
Cinv,cab investment cost for MV (20 kV) cable1) 55 000 €/km
Cinv,cab investment cost for LV (0.4 kV) cable1) 35 000 €/km
xcab used cable length in the investment 10 km
Lcab expected lifetime / investment period 40 a
1) excluding tax
430
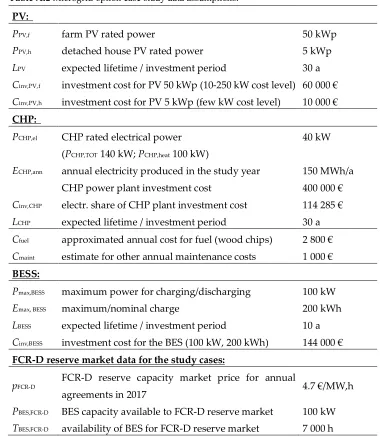
431
Table A.2 Microgrid option case study data assumptions.
432
PV:
PPV,f farm PV rated power 50 kWp
PPV,h detached house PV rated power 5 kWp
LPV expected lifetime / investment period 30 a
Cinv,PV,f investment cost for PV 50 kWp (10-250 kW cost level) 60 000 €
Cinv,PV,h investment cost for PV 5 kWp (few kW cost level) 10 000 €
CHP:
PCHP,el CHP rated electrical power 40 kW
(PCHP,TOT 140 kW; PCHP,heat 100 kW)
ECHP,ann annual electricity produced in the study year 150 MWh/a
CHP power plant investment cost 400 000 €
Cinv,CHP electr. share of CHP plant investment cost 114 285 €
LCHP expected lifetime / investment period 30 a
Cfuel approximated annual cost for fuel (wood chips) 2 800 €
Cmaint estimate for other annual maintenance costs 1 000 €
BESS:
Pmax,BESS maximum power for charging/discharging 100 kW
Emax, BESS maximum/nominal charge 200 kWh
LBESS expected lifetime / investment period 10 a
Cinv,BESS investment cost for the BES (100 kW, 200 kWh) 144 000 €
FCR-D reserve market data for the study cases:
pFCR-D
FCR-D reserve capacity market price for annual
agreements in 2017 4.7 €/MW,h
PBES,FCR-D BES capacity available to FCR-D reserve market 100 kW
433
434
435
Table A.3 Electricity market and other economics data assumptions.
436
Retail electricity costs:
Cel.ret retail electricity price for consumer 0.05 €/kWh
Cel.trans electricity distribution price for consumer 0.065 €/kWh
Cel.sold price paid for sold electricity for prosumer 0.027 €/kWh
Cel.s.tr electricity transmission price for prosumer 0.0007 €/kWh
tel electricity tax (included in electr. distrib. fee) 0.02253 €/kWh
Economics calculation parameters:
r interest rate 2 %
s value added tax 24 %
437
References
438
1. Marnay, C., Robio, F. J. & Siddiqui, A. S. Shape of the microgrid. in 2001 IEEE Power Engineering Society
439
Winter Meeting. Conference Proceedings (Cat. No.01CH37194) 1, 150–153 (2001).
440
2. Lasseter, B. Microgrids. in Power Engineering Society Winter Meeting, 2001. IEEE 1, 146–149 (2001).
441
3. Dimeas, A. L. & Hatziargyriou, N. D. A Multiagent System for Microgrids. in Proceedings of the 13th
442
International Conference on, Intelligent Systems Application to Power Systems 2, 396–401 (2004).
443
4. Lasseter, R. H. & Paigi, P. Microgrid : A Conceptual Solution. in 35th Annual IEEE Power Electronics
444
Specialists Conference 4285–4290 (2004). doi:10.1109/PESC.2004.1354758
445
5. Stadler, M. et al. Value streams in microgrids: A literature review. Appl. Energy 162, 980–989 (2016).
446
6. Vatanparvar, K. & Al Faruque, M. A. Design Space Exploration for the Profitability of a Rule-Based
447
Aggregator Business Model Within a Residential Microgrid. IEEE Trans. Smart Grid 6, 1167–1175 (2015).
448
7. Yuen, C., Oudalov, A. & Timbus, A. The Provision of Frequency Control Reserves from Multiple
449
Microgrids. IEEE Trans. Ind. Electron. 58, 173–183 (2011).
450
8. Avendano-Mora, M. & Camm, E. H. Financial Assessment of Battery Energy Storage Systems for
451
Frequency Regulation Service. in 2015 IEEE Power & Energy Society General Meeting 1–5 (2015).
452
doi:10.1109/PESGM.2015.7286504
453
9. Haakana, J. Impact of Reliability of Supply on Long-Term Development Approaches to Electricity
454
Distribution Networks. (Lappeenranta University of Technology, 2013).
455
10. Ahokas, J. Maatilojen energiankäyttö. Enpos-hankkeen tulokset (In Finnish, Energy use on farms. Results of
456
Enpos project). Department of Agricultural Sciences, Publication 15. University of Helsinki (2013).
457
11. Meta Economics Consulting Group Pty Ltd. Electricity Supply Issues for Farmers. (2013).
458
12. Oliveira, D. Q. et al. A fuzzy-based approach for microgrids islanded operation. Electr. Power Syst. Res.
459
149, 178–189 (2017).
460
13. Liu, G., Starke, M., Xiao, B., Zhang, X. & Tomsovic, K. Microgrid optimal scheduling with
chance-461
constrained islanding capability. Electr. Power Syst. Res. 145, 197–206 (2017).
462
14. Vergara, P. P., López, J. C., Silva, L. C. P. da & Rider, M. J. Security-constrained optimal energy
463
15. El-Hendawi, M., Gabbar, H. A., El-Saady, G. & Ibrahim, E. N. A. Control and EMS of a grid-connected
465
microgrid with economical analysis. Energies 11, 1–20 (2018).
466
16. Haakana, J., Lassila, J., Kaipia, T. & Partanen, J. Comparison of Reliability Indices from the Perspective
467
of Network Automation Devices. IEEE Trans. Power Deliv. 25, 1547–1555 (2010).
468
17. Verho, P. et al. Visionary development of distribution networks. in 19th International Conference on
469
Electricity Distribution 4 (2007).
470
18. Antikainen, J., Repo, S., Järventausta, P. & Verho, P. Interruption Costs Management in Distribution
471
Network by Intentional Islanding Based on Mobile Stand-by Generation Units. in The 8th Nordic
472
Electricity Distribution and Asset Management Conference, NORDAC 2008, 8-9 Sept. 13 (2008).
473
19. Vilppo, O., Markkula, J. & Järventausta, P. Energy storage in low voltage (LV ) network for decreasing customer
474
interruption cost (CIC ). Dept. Elect. Eng., Tampere Univ. of Technology (2016).
475
20. Haakana, J., Lassila, J., Kaipia, T. & Partanen, J. Utilisation of energy storages to secure electricity supply
476
in electricity distribution networks. in 22nd International Conference on Electric Distribution, CIRED 1–4
477
(2013).
478
21. Alsaidan, I., Alanazi, A., Gao, W., Wu, H. & Khodaei, A. State-Of-The-Art in Microgrid-Integrated
479
Distributed Energy Storage Sizing. Energies 10, 14 (2017).
480
22. Mitra, J. Reliability-based sizing of backup storage. IEEE Trans. Power Syst. 25, 1198–1199 (2010).
481
23. Energiavirasto. Päätös xxx/430/2015, Liite 2: Sähkön jakeluverkkotoiminta ja sähkön suurjännitteinen
482
jakeluverkkotoiminta - Valvontamenetelmät neljännellä 1.1.2016 - 31.12.2019 ja viidennellä 1.1.2020 - 31.12.2023
483
valvontajaksolla. 120 (www.energiavirasto.fi, 2015).
484
24. Global Modeling and Assimilation Office (GMAO) (2015), MERRA-2 tavg1_2d_rad_Nx: 2d,1-Hourly,
485
Time-Averaged, Single-Level, Assimilation, Radiation Diagnostics V5.12.4, Greenbelt, MD, USA,
486
Goddard Earth Sciences Data and Information Services Center (GES DISC).
487
25. Global Modeling and Assimilation Office (GMAO) (2015), MERRA-2 tavg1_2d_flx_Nx: 2d,1-Hourly,
488
Time- Averaged, Single-Level, Assimilation, Surface Flux Diagnostics V5.12.4, Greenbelt, MD, USA,
489
Goddard Earth Sciences Data and Information Services Center (GES DISC).
490
26. Huld, T., Müller, R. & Gambardella, A. A new solar radition database for estimating PV performance in
491
Europe and Africa. Sol. Energy 86, 1803–1815 (2012).
492
27. European Communities (2012), PVGIS interactive application. Available:
493
http://re.jrc.ec.europa.eu/pvgis/apps4/pvest.php#.
494