1
Optimization of the anaerobic digestion process of mechanically pretreated
algae
Cristina Rodriguez*, Zaki El-Hassan, Abdul G. Olabi Institute of Engineering and Energy Technologies
University of the West of Scotland, Paisley, UK e-mail: [email protected]
Abed Alaswad
School of Engineering and the Built Environment Birmingham City University, Birmingham, UK
ABSTRACT
The anaerobic digestion of algal biomass is restricted by its complex lignocellulosic structure. In order to reduce the feedstock particle size and to increase the biomass’ specific surface area available to the microorganisms, this paper investigates the mechanical pretreatment effect on the anaerobic digestion process of P. canaliculata seaweeds using the response surface methodology (RSM). Results show that a 60 mins of mechanical pre-treatment has resulted in 74% improvement of methane yield compared with the methane yield obtained from untreated algae. A multi-objective optimization study was carried out with the aim of maximizing the methane yield while minimizing the pretreatment cost. The optimal solution was achieved at 50 min of pretreatment where the net energy at this point was found 2.49 Wh/gVS, a value 28% higher than for untreated algae
KEYWORDS
Biogas, algae, pretreatment, anaerobic digestion, Hollander beater, methane 1. INTRODUCTION
Algae are a diverse group of uni- and multi-cellular photoautotroph. They are plant-like organisms in that they always use photosynthesis, and they are usually aquatic. The efficiency of their photosynthesis is higher than that of other plants, and some species are considered to be among the fastest growing plants in the world [1]. It has been reported that photosynthetic efficiencies for algae range from 3% to 8%, compared with 0.5% for many terrestrial crops [2]. Macroalgae have complex structures similar to terrestrial plants where cellulose and hemicellulose compose a crystalline structure very difficult to biodegrade. Macroalgae are divided into three large groups based on their colouring (red, green and brown) [3]. Methane yields from brown algae are generally higher than those from green algae.
Macroalgae as a source of bioenergy first received intensive scrutiny as part of the US Ocean Food and Energy Farm project in 1973 and resulted in the construction of ocean farms for cultivation of the giant kelp Macrocystis [3]. While farming this species of seaweed in this truly offshore environment presented many technical challenges, the biogas production of macroalgal biomass gave excellent results [4,5]. With most of microalgae’ research has focused on their conversion to liquid biofuels such as biodiesel and ethanol, over 100 species of macroalgae can be used in food, fertilisers, medicines and in the processing of chemicals [6].
2
The so-called “third generation” bio-fuels, which are derived from algae, do not compete with food production unlike the first generation bio-fuels, and do not need large areas of arable land and fresh water resources like the second generation bio-fuels. Some of the advantages of choosing macroalgae as the starting material for the production of biogas as opposed to choosing other types of biomass are list below:
No lignin, low lignocellulose content
Removal of P and N from the sea
Minimal requirement of nutrients
Higher photosynthetic efficiency
Does not compete with agriculture
Less feedstock cost
Algae grows in three dimensions, so the area needed for their cultivation is much smaller than that needed for terrestrial biomass [7–9]. The high protein content in the seaweed can lead to a high ammonium concentration and lead to toxicity, this limitation could be solved with the co-digestion of the algae with other high carbon substrates to increases the methane yields and balance the nutrients in the reactor [10,11]. Another limitation of the anaerobic digestion of macroalgae is the low digestibility of it due to its lignocellulosic structure. Lignocellulosic biomass has a complex internal structure that contains the main components (cellulose, hemicellulose and lignin) which have, in their turn, also complex structures [12]. Before undergoing the anaerobic digestion, macroalgae should be suitably conditioned in order to offer the microorganisms in the digester a larger target surface area and thus to improve and accelerate the degradation process [13–15]. The availability of the substrates for the enzymatic attack will be achieved through the increment of the specific surface area and breakdown the crystalline structure. In recent years different technologies for biomass pretreatment have been developed in order to increase the availability of substrate for anaerobic digestion [16,17]. Breaking down lignin, disrupting the crystalline structure of cellulose and increasing its surface can be attained by pre-treatment methods, so that micro-organisms can more easily access the cellulose [18].
In this paper, an investigation of the anaerobic digestion process of Pelvetia Canaliculata
macroalgae was reported. A parametric analysis has been carried out to investigate the effect of beating time and F/I ratio on the methane yield and the net energy. Furthermore, a multi-objective optimization was conducted with the aim of maximizing the methane yield while minimizing the pre-treatment cost.
2. MATERIALS AND METHODS
2.1 Feedstock and inoculum
3
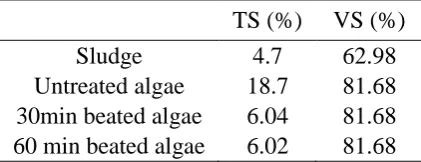
Table 1. Algae and sludge characterization TS (%) VS (%)
Sludge 4.7 62.98
Untreated algae 18.7 81.68 30min beated algae 6.04 81.68 60 min beated algae 6.02 81.68 2.2 Bioreactors
The bioreactor consists of flasks of 500 ml connected through a system of valves and plastic pipes to airtight plastic bags for biogas collection. To clear up any trace of oxygen from the system and preserve the anaerobic conditions, nitrogen is flushed for triplicate for 5 minutes into the reactors. The reactors are placed in water-bath to keep the temperature at 37°C. Reactors were fed with a fixed amount of 200ml of sludge (inoculum), while different quantities of pulp (beated algae) were required to have different F/I ratios as (0.3, 0.5 and 0.7).
2.3 Hollander beater pretreatment
The machine is composed of an oval vessel divided along its major axis by a partition that did not reach the walls, so an elliptic channel is formed. In one of the sides of the channel is placed a bladed drum that spins above a bedplate, churning pulp up over the back fall where it slides down creating momentum to round the curve and continue the loop [19–21]. Samples were taken at 30 and 60 minutes of beating pretreatment. The samples were taken from the bend before the bladed drum in the middle of both the width and height of the channel to take the most representative sample.
2.4 Design of experiments
The experiment is planned according to a response surface methodology (RSM) for two factors, beating time (BT) and feedstock/inoculum ratio (F/I) with three levels; the response is the methane production per g of volatile solids (ml/gVS). The statistical study is performed using the software Design Expert v.9. A second order polynomial is used,
b bixi biixii bijxixj
Y 0 2 (1)
where the values of the model coefficients b0, bi, bii and bij are estimated using regression analysis. The adequacy of the models is tested through the analysis of variance (ANOVA). The statistical significance of the models and of each term is examined using the sequential F-test and lack-of-fit F-test. If the Prob. > F of the model and of each term in the model does not exceed the level of significance (in this case α = 0.05) then the model may be considered adequate within the confidence interval of (1 - α).
2.5 Energy balance calculation
In order to calculate the energy balance related to the use of the pretreatment, a series of equations were employed following the procedure in [22].
2.6 Methane production rate
4
M(t)F(1ekt) (2) where M(t) is the cumulative methane production (ml/gVS), F is the maximum methane production (ml/gVS), k is the methane production rate constant (d-1), and t is the time (d). Biodegradability results were compared after a significance statistical analysis by using analysis of variance (ANOVA) for a single factor. Statistical significance was established at p < 0.05 level.
3. RESULTS AND DISCUSSION
3.1 Methane production
The methane production from P. Canaliculata after beating pretreatment is shown in Figure 1. The inoculum contribution of methane production was never higher than 10%. The methane production from 200 ml of inoculum (control batch) on day 7 was 23.28ml, on day 14 was 38.80 ml and on day 21 was 46.56ml.
The beated samples achieved higher methane yields compared with the respective untreated samples, approximately 74% for the algae beated for 60 min, and 6% for samples beated for 30 min. Beating pretreatment increases the surface area of the biomass making it more accessible to the microorganisms, providing higher biodegradation rates and facilitating a fast hydrolysis. For a ratio F/I 0.3, the methane production increase is most noticeable at early stages of the degradation. On day 7, the methane production from 60 min treated samples was 112% higher than from the untreated samples and on day 14 was 78%. For ratios F/I of 0.5 and 0.7, the effect of pretreatment was much less noticeable. It can also be noticed that by increasing F/I ratio and decreasing the digestion time (DT), the effect of the pretreatment decreases. For a ratio of 0.5, on day 14 of digestion the methane production from 60 min treated samples was 62% higher compared to untreated samples. For the same DT and BT and a ratio F/I 0.7, the increase on methane production was 19%. The methane production increase between treated and untreated samples was more significant at later stages of digestion than at start of the process (Figure 1).
3.2 Energy balance
5
6
Table 2. Energy balance for the beating pretreatment.
Ratio F/I Beating time (min) Net energy (Wh/gVS) Net electric energy (Wh/gVS) 0.3
0 1.95 0.59
30 1.88 0.42
60 2.98 0.61
0.5
0 1.20 0.36
30 0.90 0.13
60 1.47 0.16
0.7
0 1.00 0.23
30 0.27 -0.06
60 0.95 0.00
3.3 Experimental design
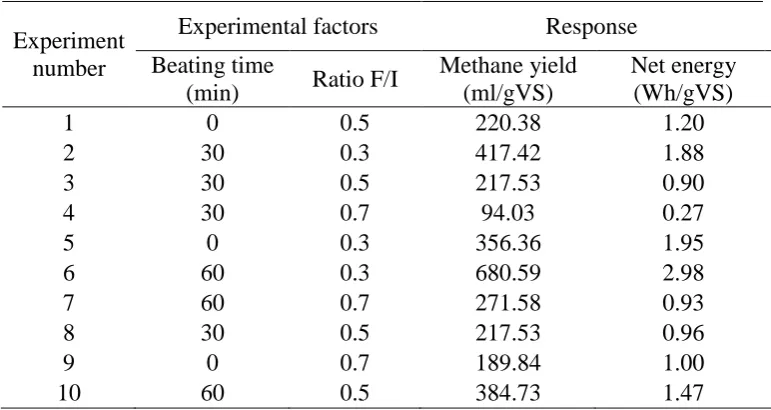
The experiment parameters, BT and F/I were checked in three levels. Beating time varies between 0 and 60 minutes while ratio feedstock/inoculum varies between 0.3 and 0.7. The responses were set as the methane production given in ml per g of volatile solids (ml/gVS) and the net energy (Wh/gVS). Parameters and results are shown in Table 3.
Table 3. Experimental factors and responses for the methane model estimation
Experiment number
Experimental factors Response
Beating time
(min) Ratio F/I
Methane yield (ml/gVS)
Net energy (Wh/gVS)
1 0 0.5 220.38 1.20
2 30 0.3 417.42 1.88
3 30 0.5 217.53 0.90
4 30 0.7 94.03 0.27
5 0 0.3 356.36 1.95
6 60 0.3 680.59 2.98
7 60 0.7 271.58 0.93
8 30 0.5 217.53 0.96
9 0 0.7 189.84 1.00
10 60 0.5 384.73 1.47
Methane yield. For the modelling of the methane production through the RSM, the model F-value of 100.92 implies the model is significant. There is only a 0.03% chance that an F-F-value this large could occur due to noise. The model terms of R2 = 0.9921, adjusted-R2 = 0.9823, predicted-R2 = 0.9329, all these values are very close to 1 and the adjusted-R2 and the predicted-R2 are within 0.2 indicating the adopted model is adequate. The adequate precision, which measures the signal to noise ratio is 33.059. A ratio greater than 4 indicates an adequate signal and the model can be used to navigate the design space.
7
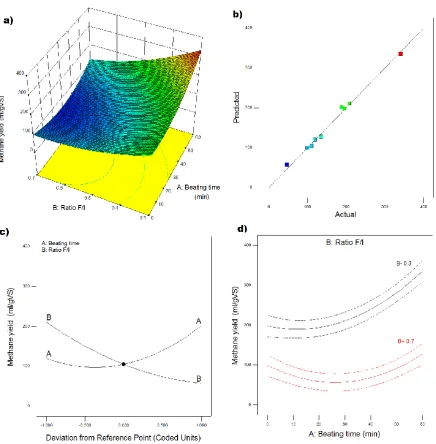
diagonal line and a satisfactory correlation between them is observed. This demonstrates that the model can be effectively applied for mechanical pretreatment with a Hollander beater for
P. Canaliculata. The final mathematical model associated to the response in terms of actual factors (Equation 3) determined by the software is shown below.
2 2
) ( 48 . 736 06
. 0 ) ( * 54 . 4
) ( 73 . 984 08
. 0 51 . 427
I F BT
I F BT
I F BT
yield Methane
(3)
Figure 2. Response surface plots for methane production in 3D (a), scatter diagram (b), perturbation plot (c) and interaction plot (d).
8
Knowing the optimum F/I ratio allows a better exploitation of the feedstock. Feeding the reactor with high quantities of biomass that the inoculum is not able to process lead to a loss of feedstock, that is not digested. Increases of 15-61% in the methane production rate constant were observed in the beated samples for F/I ratio 0.3. For a ratio of 0.5, the methane production rate constant increases by 12.5% for 30 min beating and did not vary for 60min beating. For a ratio of 0.7, the methane production rate constant decreased with increasing beating time.
At the end of the incubation period, with a 50% of methane content, the biogas yield is 356.36 ml/gVS. This result is higher than the value of 196.39ml/gVS reported by Tedesco et al. (2013), but no F/I ratio is mentioned. However the result from Tedesco et al. agreed with the biogas production achieved in the present studio at a F/I ratio of 0.5, 220.38 ml/gVS [24]. An excessive particle size reduction of the substrate accelerates the hydrolysis and acidogenesis in the early stage of anaerobic digestion, resulting in accumulation of volatile fatty acids (VFAs) that leads to a decrease in pH, causing a decrease in methane production [14]. The final pH in this study remained constant around a value of 6.78±0.15 similar to the initial pH. These values did not suggest the occurrence of any strong inhibition due to VFA accumulation
The perturbation plot in Figure 2c shows how the methane yield is affected by the input variables beating time and F/I ratio, both variables have an exponential effect on the methane production. Increasing A (beating time) the methane yield will increase exponentially, meanwhile increasing B (F/I ratio) the methane yield will decrease also exponentially. The effect of pretreatment is seen to be more important at low F/I ratios as can be displayed from the interaction plot (Figure 2d), for a F/I ratio of 0.5, the methane yield improves exponentially with the beating time from a minimum of 12 min. For a F/I ratio of 0.7, the minimum methane yield is achieved at higher beating time (25 min) and then improved until reach a value around 120 ml/gVS.
Net energy. For the modelling of the net energy through the RSM, the model F-value of 78.36 implies the model is significant. There is only a 0.04% chance that an F-value this large could occur due to noise. The model terms of R2 = 0.9899, adjusted-R2 = 0.9773, predicted-R2 = 0.9179, all these values are very close to 1 and the adjusted-R2 and the predicted-R2 are within 0.2 indicating the adopted model is adequate. The adequate precision, which measures the signal to noise ratio is 28.915. A ratio greater than 4 indicates an adequate signal and the model can be used to navigate the design space.
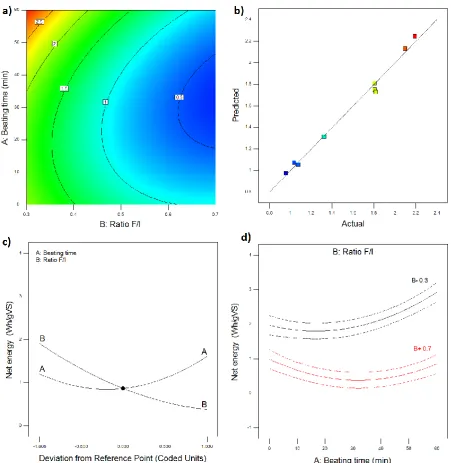
The ANOVA test estimated that the model adopted is significant, values of Prob>F less than 0.0500 indicate model terms are significant. In this case A, B, AB, A2 and B2 are significant model terms. Values greater than 0.1000 indicate the model terms are not significant. The predicted vs. actuals plot (Figure 3b) shows that these values were distributed near to the diagonal line and a satisfactory correlation between them is observed. The final mathematical model associated to the response in terms of actual factors (Equation 4) determined by the software is shown below.
9
Figure 3. Response surface plot for net energy (a), scatter diagram (b), perturbation plot (c) and interaction plot (d).
Figure 3a shows that higher net energy is obtained at high beating times and low F/I ratio. The perturbation plot in Figure 3b shows how the net energy is affected by the beating time and the F/I ratio. Increasing A (beating time) the net energy will increase exponentially, meanwhile increasing B (F/I ratio) the net energy will decrease also exponentially. For a ratio F/I of 0.3, the net energy increasing with increasing pretreatment time, while for a F/I ratio 0.7, the net energy achieved a minimum at 30 min of beating (Figure 3c). This means that both methane yield and net energy are more influenced by pretreatment at low ratios feedstock/inoculum.
10
optimization problems using the desirability approach consists of a technique that combines multiple responses into a dimension-less measure of performance, called an overall desirability function. The numerical optimization provides the ideal input variables levels to achieve the highest methane yield and the graphical method results in a plot that associates the input variables levels to an area of target outputs defined by the user.
The optimization criteria combine the productivity with the cost of the process. The aim is a good treatment of the biomass (maximizing the algae digestibility) while minimizing the energy consumption. For the optimization, methane production was maximized with level 5 and beating time was minimized with level 1 while F/I ratio was permitted to vary in the same range as in Table 4.
Table 4. Criterion for numerical optimization.
Name Goal Lower limit Upper limit Importance
BT Minimize 0 60 1
F/I ratio In range 0.3 0.7 3
Methane yield Maximize 94.03 680.59 5
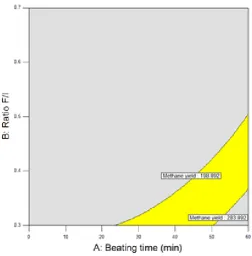
The optimal methane production (283.89ml/gVS) from the numerical optimisation was found at BT= 50 min and F/I ratio= 0.3, allowing 45% extra methane when compared to the maximum methane production for untreated algae. The net energy at this point was found 2.49 Wh/gVS, a value 28% higher than for untreated algae. The graphical optimization allows a selection of the optimum process parameters by means of visual inspection. The grey areas on the overlay plot (Figure 4) represent the values that do not meet the proposed criteria; the target area in yellow is delimited by the curves corresponding to the optimization criteria set by the authors. The lower and upper limits were chosen according to the numerical optimization results, 198.89 ml/gVS and 283.89 ml/gVS.
11
4. CONCLUSIONS
The experimental work shows the effect of beating as a mechanical pretreatment in the methane production through anaerobic digestion of P. Canaliculata. Pretreat the algae for 60 minutes improved the methane production by 74%, from a value of 196.00 ml/gVS correspondent to untreated algae to 340.30 ml/gVS. A pretreatment time of 30 min resulted in a methane yield of 208.71 ml/gVS. The optimum ratio F/I was found 0.3, both for all pretreatment times and for all stages of digestion. An optimization study was performed to reduce the operating costs associated to the pretreatment and maximize the productivity. The aim is maximizing the methane production while minimizing the pretreatment time resulted in a maximized methane production of 283.89ml/gVS for a 50 min beating pretreatment and 0.3 ratio F/I. The study proved the Hollander beater pretreatment increases the anaerobic biodegradation of P. Canaliculata and the process is economically feasible as positive net energy values were achieved.
REFERENCES
[1] A. Demirbas, M.F. Demirbas, Algae Energy - Algae as a New Source of Biodiesel, 2010. http://www.springer.com/engineering/energy+technology/book/978-1-84996-049-6 (accessed February 2, 2015).
[2] L. Lardon, A. Helias, B. Sialve, J.-P. Steyer, O. Bernard, Life-Cycle Assessment of Biodiesel Production from Microalgae, Environ. Sicence Technol. 43 (2009) 6475– 6481.
https://wiki.umn.edu/pub/Biodiesel/WebHome/life_cycle_assesment_of_biodiesel_for m_micro_algae.pdf (accessed February 2, 2015).
[3] A.D. Hughes, M.S. Kelly, K.D. Black, M.S. Stanley, Biogas from Macroalgae: is it time to revisit the idea?, Biotechnol. Biofuels. 5 (2012) 86. doi:10.1186/1754-6834-5-86.
[4] K.T. Bird, P.H. Benson, Seaweed cultivation for renewable resources, Elsevier, 1987. https://books.google.co.uk/books/about/Seaweed_cultivation_for_renewable_resour.ht ml?id=VSUYAQAAIAAJ&pgis=1 (accessed March 2, 2016).
[5] D.L. Wise, D.C. Augenstein, J.H. Ryther, Methane fermentation of aquatic biomass, Resour. Recover. Conserv. 4 (1979) 217–237. doi:10.1016/0304-3967(79)90002-7. [6] B. Santelices, The discovery of kelp forests in deep-water habitats of tropical regions.,
Proc. Natl. Acad. Sci. U. S. A. 104 (2007) 19163–4. doi:10.1073/pnas.0708963104. [7] S. Tanner, Biofuels of the Third Generation Do Microalgae Solve the Energy
Problem ?, 2009.
[8] E.D. Larson, Biofuel production technologies : status, prospects and implications for trade and development, 2008.
[9] D.L. Klass, Biomass for Renewable Energy and Fuels, Encycl. Energy. (2004) 193– 212.
http://www.energytoolbox.org/gcre/bibliography/191_Klass_Biomass_renewable_2004 .pdf (accessed January 30, 2015).
[10] M.O.L. Yusuf, N.L. Ify, The effect of waste paper on the kinetics of biogas yield from the co-digestion of cow dung and water hyacinth, Biomass and Bioenergy. 35 (2011) 1345–1351. doi:10.1016/j.biombioe.2010.12.033.
[11] H.-W. Yen, D.E. Brune, Anaerobic co-digestion of algal sludge and waste paper to produce methane, Bioresour. Technol. 98 (2007) 130–4. doi:10.1016/j.biortech.2005.11.010.
[12] P. Harmsen, W. Huijgen, Literature Review of Physical and Chemical Pretreatment
12
http://www.ecn.nl/docs/library/report/2010/e10013.pdf.
[13] A. Alaswad, M. Dassisti, T. Prescott, A.G. Olabi, Technologies and developments of third generation biofuel production, Renew. Sustain. Energy Rev. 51 (2015) 1446– 1460. doi:10.1016/j.rser.2015.07.058.
[14] C. Rodriguez, A. Alaswad, J. Mooney, T. Prescott, A.G. Olabi, Pre-treatment techniques used for anaerobic digestion of algae, Fuel Process. Technol. 138 (2015) 765–779. doi:10.1016/j.fuproc.2015.06.027.
[15] S. Haghighi Mood, A. Hossein Golfeshan, M. Tabatabaei, G. Salehi Jouzani, G.H. Najafi, M. Gholami, M. Ardjmand, Lignocellulosic biomass to bioethanol, a comprehensive review with a focus on pretreatment, Renew. Sustain. Energy Rev. 27 (2013) 77–93. doi:10.1016/j.rser.2013.06.033.
[16] P. Kumar, D.M. Barrett, M.J. Delwiche, P. Stroeve, Methods for Pretreatment of Lignocellulosic Biomass for Efficient Hydrolysis and Biofuel Production, Ind. Eng. Chem. Res. 48 (2009) 3713–3729. doi:10.1021/ie801542g.
[17] A. Menind, A. Normak, Study on Grinding Biomass as Pre-treatment for Biogasification, 2008. http://agronomy.emu.ee/vol08Spec1/p08s119.pdf.
[18] S. Behera, R. Arora, N. Nandhagopal, S. Kumar, Importance of chemical pretreatment for bioconversion of lignocellulosic biomass, Renew. Sustain. Energy Rev. 36 (2014) 91–106. doi:10.1016/j.rser.2014.04.047.
[19] M. Cerda, Arqueologia industrial, First, Universitat de Valencia, Valencia, 2008. [20] G.A. Osorio, Análisis FMECA a sistema de posicionamiento de platinas de refinadora
de pulpa de papel diseñada para papelera Gubelin Ltda., Universidad Austral de Chile, 2010. http://www.ncbi.nlm.nih.gov.myaccess.library.utoronto.ca/pubmed/11720961. [21] S. Tedesco, Mechanical pretreatment assessment of marine biomass, Dublin City
University, 2013.
[22] M.E. Montingelli, K.Y. Benyounis, J. Stokes, A.G. Olabi, Pretreatment of macroalgal biomass for biogas production, Energy Convers. Manag. 108 (2016) 202–209. doi:10.1016/j.enconman.2015.11.008.
[23] VDI-Gesellschaft Energietechnik, Fermentation of organic materials Characterisation of the substrate, sampling, collection of material data, fermentation tests, VDI-Gesellschaft Energietechnik, Dusseldorf, 2006.