Differential ceRNA Expression and Interaction Analysis in Coronary
Artery Disease
Sheng Kang1 *#, Yong Ye1 #, Guang Xia1, Haibo Liu1 , 2 *
1. Department of Cardiology, Shanghai East Hospital, Tongji Univers
ity, Jimo Road 150, Shanghai 200120, China.
2. Department of Cardiology, Qingpu Branch of Zhongshan Hospital,
Fudan University, 1158 Park East Road, Shanghai 201700, China.
#Sheng Kang and Yong Ye were Co-first authors in the paper.
*Sheng Kang and Haibo Liu were Co -corresponding authors in the paper.
Corresponding authors: Sheng Kang, E-mail: [email protected];
Haibo Liu, E-Mail: [email protected]
Abstract:
Previous studies had shown that mRNA, miRNA and lncRNA wer e
associated with cardiovascular diseases. The study was aimed to explore
the differential expressions of mRNA, lncRNA and miRNA between
coronary artery disease (CAD) and healthy control, and thei r interaction in
CAD. We investigated the differential expression of ceRNA between CAD
and healthy control through data collected from Gene Expression O mnibus
(GEO) microarrays. Furthermore, we investigated the biological function
of these differential expressions of ceRNAs by Gene Ontology (GO),
Kyoto Encyclopedia of Genes and Genomes (KEGG) analyses.
Protein-protein interaction (PPI) network was created to identify the hub
genes. Biosystems and literature search were performed for signaling
pathways and their function of the included differential expression ceRNAs.
A total of 456 miRNA expression profiles, 16,325 mRNA expression
profiles, and 2,869 lncRNA expression profiles were obtained . Eleven Go
and KEGG pathways (count ≥9), top 15 of PPI network node connectivity rank, and
top 15 of ceRNA network node degree centrality rank were achieved at the
statistical significance level (P<0.05) . We further identified that several
differential expressions of ceRNAs and their signaling pathways were
associated with CAD through biosystems and literature search. Based on
eleven Go and KEGG pathways, top 15 of PPI network node connectivity rank, and
top 15 of ceRNA network node degree centrality rank in CAD population, our
findings would contribute to further exploration for the molecular mechanism of
CAD.
1. Introduction
Coronary artery disease (CAD ) is a complex phenotype driven by genetic
and environmental factors. However current therapies focus on addressing
the role of cholesterol and lifestyle in CAD. Despite advances in the
development of lipid -lowering therapies, clinical trials have shown that a
substantial risk of cardiovascular disease persists af ter currently
recommended medical therapy.1 Stratification for subsequent coronary events among patients with CAD is of considerable interest because of the
potential to guide secondary preventive therapies. Recently, eight
microRNAs (miRNAs) were identifi ed to facilitate acute coronary
syndrome diagnosis.2 Targeting Angptl3 messenger RNA (mRNA) retarded the progression of atherosclerosis and reduced levels of atherogenic
lipoproteins.3 The expressing 9p21.3-associated long non-coding RNA ANRIL induces risk CAD phenotypes in non-risk vascular smooth muscle
cells.4 So far, it is not clear the mechanism of these RNAs in CAD and their interaction.
Noticeably, the different types of RNA molecule compe ted to bind to
miRNA, which reduced the inhibitory effect o f miRNA targeting on its
mRNA.5 These competitive endogenous RNA (ceRNA) included various types of RNA transcripts, such as circular RNA (circRNA), long -chain
non-coding RNA (lncRNA), pseudogenes a nd protein-encoded mRNA,
which competed for miRNA through t he "language" mediated by the
miRNA response element (MRE). 6 After that, researchers used bioinformatics methods to predict ceRNA regulatory networks. The effect
of ceRNA on the target gene and the dependence of ceRNA on miRNA
would be verified at the experiments of proteins and RNAs, but the
functional verification would be pe rformed at the experiments of cells and
animal models.
Thus, the study was aimed to explore the d ifferential expressions of
interaction of them, including constructure of ceRNA regulatory netw orks,
which would contribute to the molecular mechanism of CAD.
2. Results
2.1. Basic Information Statistics of Differential Expression Analysis
As described in the Methods, a total of 45 6 miRNA expression profiles
(supplementary Table1), 16,325 mRNA expression profiles (supplementary
Table 2), and 2,869 lncRNA expression profiles were obtained
(supplementary Table 3).
According to the set threshold, 18 differentially expres sed miRNAs were
finally obtained, including 16 down-regulated and 2 up-regulated
(supplementary Table 4). a total of 92 differential lncRNAs were obtained,
including 46 down-regulated and 46 up-regulated (supplementary Table 5).
A total of 610 differential mRNAs were obtained, in cluding 244
down-regulated and 366 up-regulated (supplementary Table 6).
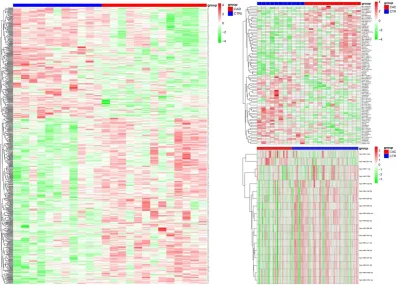
Based on the obtained differential miRNA, lncRNA and mRNA, the heat
map was shown in Figure 1 and the volcano map was shown in Figure 2.
left to right. Top red bar indicates the CAD samples, and blue bar indicates
the control samples
Figure 2. Volcano plot. Note: miRNA, lncRNA, and mRNA are displayed
from left to right. Red indicates up-regulation, blue indicates
down-regulation, grey indicates no significant difference.
2.2. Functional and Pathway Enrichment Analysis of Up- and Down-
regulated MRNA
GOBP, GOMF, GOCC functional enrichment analysis and KEGG
pathway enrichment analysis were performed on the obtained up-regulated
and down-regulated mRNAs, respectively, and the results showe d that a
total of 36 GOBP, 3 GOCC, 15 GOMF and 2 KEGG pa thways were
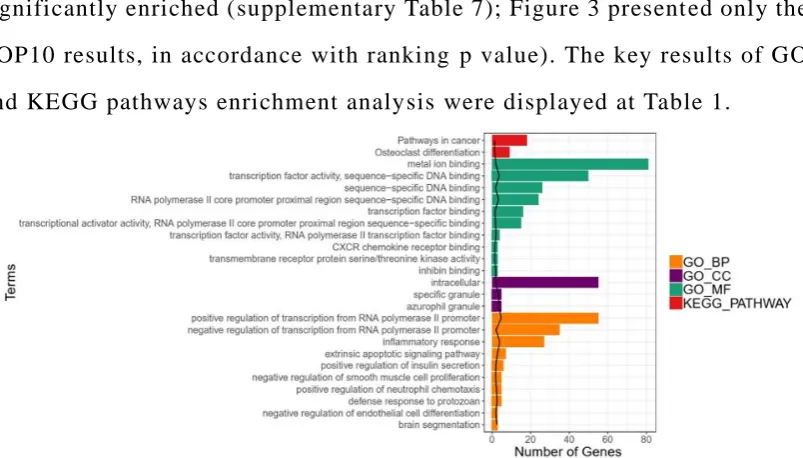
significantly enriched (supplementary Table 7); Figure 3 present ed only the
TOP10 results, in accordance with ranking p value). The key results of GO
and KEGG pathways enrichment analysis were displayed at Table 1.
Figure 3. GO and KEGG PATHWAY enrichment analysis . Note: black lines
genes.
Category Term Count P Value
KEGG_PATHWAY hsa04380: Osteoclast differentiation 9 2.82E-02
KEGG_PATHWAY hsa05200: Pathways in cancer 18 4.33E-02
GOTERM_MF GO: 0003700~transcription factor activity, sequence-specific DNA binding 50 1.77E-04
GOTERM_MF GO: 0000978~RNA polymerase II core promoter proximal region sequence-
specific DNA binding
24 4.40E-04
GOTERM_MF GO: 0001076~transcription factor activity, RNA polymerase II transcription
factor binding
4 7.53E-03
GOTERM_MF GO: 0034711~inhibin binding 3 8.38E-03
GOTERM_MF GO: 0046872~metal ion binding 81 8.79E-03
GOTERM_MF GO: 0001077~transcriptional activator activity, RNA polymerase II core
promoter proximal region sequence-specific binding
15 1.16E-02
GOTERM_MF GO: 0043565~sequence-specific DNA binding 26 1.32E-02
GOTERM_MF GO: 0008134~transcription factor binding 16 2.39E-02
GOTERM_MF GO: 0004675~transmembrane receptor protein serine/threonine kinase
activity
3 2.79E-02
GOTERM_MF GO: 0045236~CXCR chemokine receptor binding 3 2.79E-02
GOTERM_CC GO: 0042582~azurophil granule 5 2.18E-04
GOTERM_CC GO: 0042581~specific granule 5 4.50E-04
GOTERM_CC GO: 0005622~intracellular 55 1.28E-02
GOTERM_BP GO:0045944~positive regulation of transcription from RNA polymerase II
promoter
55 1.47E-05
GOTERM_BP GO: 0006954~inflammatory response 27 9.45E-05
GOTERM_BP GO: 0097191~extrinsic apoptotic signaling pathway 7 1.55E-03
GOTERM_BP GO: 0042832~defense response to protozoan 5 2.23E-03
GOTERM_BP GO: 0035284~brain segmentation 3 2.69E-03
GOTERM_BP GO: 0090023~positive regulation of neutrophil chemotaxis 5 3.93E-03
GOTERM_BP GO: 0000122~negative regulation of transcription from RNA polymerase II
promoter
35 7.00E-03
GOTERM_BP GO: 0032024~positive regulation of insulin secretion 6 7.58E-03
GOTERM_BP GO: 0045602~negative regulation of endothelial cell differentiation 3 8.60E-03
GOTERM_BP GO: 0048662~negative regulation of smooth muscle cell proliferation 5 1.08E-02
Table 1. Go and KEGG pathway enrichment analysis of differential genes
2.3. Protein Interaction Network Construction (PPI) and Module Analysis
relationship pairs, and the network construction was performed using
Cytoscape software as shown in Figure 4. A total of 171 nodes were
included in the network.
Figure 4. Protein interaction relationship network diagram (PPI) . Note: red
indicates up-regulated protein, green indicates down -regulated protein,
gray line indicates protein interaction rela tionship, and node size indicates
connectivity degree.
The network was analyzed for node connectivity according to the
parameters set by the Method, the top15 of Degree Centrality (DC) of each
node was ranked in Table 2. Notably,CXCL8, FPR2, IL6, and PPBP were
ranked in Top15, which might be hub proteins in the network
(supplementary Table 8). The top 15 of PPI network node connectivity rank
were displayed at Table 2.
Node Degree P Value TYPE Name
GNG11 22 0.04065 DOWN G protein subunit gamma 11
CXCL1 18 0.000525 UP C-X-C motif chemokine ligand 1
CXCR4 14 0.000134 UP C-X-C motif chemokine receptor 4
CXCL8 14 0.001358 UP C-X-C motif chemokine ligand 8
SNAP23 14 0.006229 UP synaptosome associated protein 23
FPR3 13 0.003603 DOWN formyl peptide receptor 3
RAB44 13 0.028049 UP RAB44, member RAS oncogene family
SKP2 12 0.000943 UP S-phase kinase associated protein 2
GPR18 12 0.001281 DOWN G protein-coupled receptor 18
GALR3 12 0.001499 UP galanin receptor 3
CXCL6 12 0.002672 UP C-X-C motif chemokine ligand 6
ITCH 12 0.007857 UP itchy E3 ubiquitin protein ligase
S1PR3 12 0.010344 UP sphingosine-1-phosphate receptor 3
GRM2 12 0.010472 UP glutamate metabotropic receptor 2
Table 2. PPI network node connectivity rank(TOP15)
2.4. MRNA and lncRNA Co-expression Analysis
We performed co-expression analysis of differentially expressed mRNAs
and lncRNAs. According to the threshold set by the Methods, we screened
a total of 1487 significantly coordinately expressed relationship pairs,
including 381 mRNAs and 74 lncRNAs ( supplementary Table 9)
2.5. MiRNA Target Genes and Upstream lncRNA Prediction Analysis
Based on the differentially expressed miRNAs and differential lncRNAs,
a total of 452 lncRNA-miRNA relationship pairs were predicted as
described in the Methods (supplementary Table 10), including 18 miRNAs,
and 72 lncRNAs.
Also based on differenti ally expressed miRNAs, target gene prediction
was performed using mirWalk as described in t he Methods, after taking the
intersection with the differential mRNAs, 276 miRNA -mRNA relationship
pairs were obtained, including 17 miRNAs, and 170
mRNAs (supplementary Table 11)
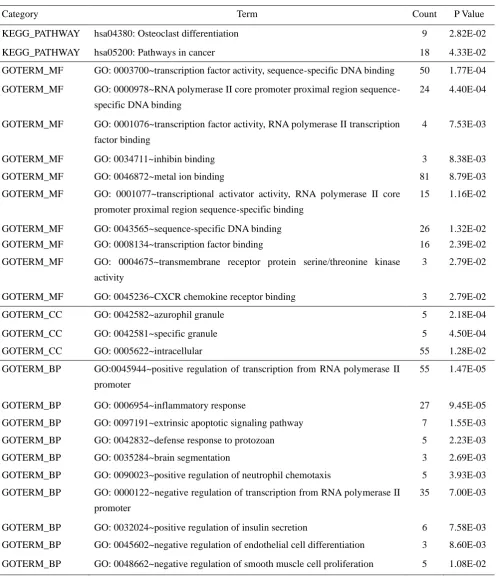
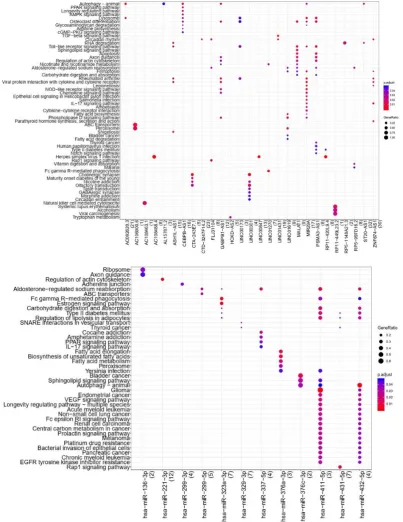
2.6. Pathway Enrichment Analysis of lncRNAs and MiRNAs
KEGG pathway (supplementary Table 12) and 12 miRNAs were enriched
by KEGG pathway (supplementary Table 13), here we showed a part of the
results in Figure 5.
Figure 5. Results of lncRNA and miRNA pathway enric hment analysis.
Note: top: lncRNA; bottom: miRNA; the decrease of significant p -value is
enriched genes (the number of involved term genes accounts f or the
number of input genes).
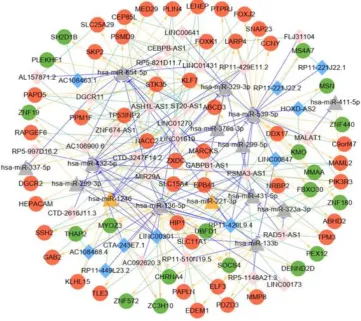
2.7. CeRNA Network Analysis
As described in the Methods section, based on the obtained
miRNA-lncRNA and miRNA-mRNA relationship pairs,
miRNA-lncRNA-mRNA relationship pairs regulated by the same miRNA
were firstly screened, along with the positive co -expression relationship
between mRNA and lncRNA (correlation coefficient >0.7), and
lncRNA-miRNA-mRNA relationship pairs were further screened for
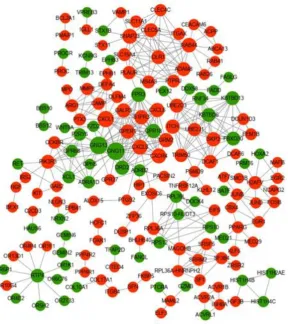
network construction, i.e., the ceRNA network as shown in Figure 6.
Figure 6. ceRNA network diagram . Note: the red circles represent
up-regulated mRNAs, and green circles represent down -regulated mRNAs;
yellow triangles represent up -regulated miRNAs, and gray triangles
down-regulated lncRNAs, and pink diamonds repre sent up-regulated
lncRNAs; The blue T-type lines represent the miRNA-lncRNA regulatory
relationships, the yellow arrows represent the miRNA -mRNA regulatory
relationships, and the green dotted lines represent the co -expression
relationships of mRNA and lncR NA.
The network contained a total of 87 lncRNA-miRNA relationship pairs,
88 miRNA-mRNA relationship pairs, and 137 lncRNA -mRNA
co-expression relationships (supplementary Table 14). There were a total
of 36 lncRNAs, 64 mRNAs, and 15 miRNAs. Connectivity analysis was
performed on each node of the ceRNA network to obtain mRNA, miRNA,
and lncRNA connectivity as detailed in Table 3.
Node Degree Type logFC P Value
hsa-miR-539-5p 30 mi_down -0.31167 0.002388
hsa-miR-654-5p 27 mi_down -0.38709 0.001381
hsa-miR-432-5p 22 mi_down -0.29313 0.011733
PSMA3-AS1 20 lnc_up 0.629594 0.032669
hsa-miR-136-5p 19 mi_down -0.34012 0.010986
MIR29A 18 lnc_up 0.849701 0.001608
RP11-420L9.4 17 lnc_down -0.69127 0.00077
LINC01619 14 lnc_up 0.610105 0.005996
NACC2 14 m_up 1.011445 7.23E-05
hsa-miR-329-3p 13 mi_down -0.28995 0.006895
hsa-miR-1246 12 mi_up 0.489247 0.000567
hsa-miR-133b 11 mi_down -0.40401 0.045067
hsa-miR-431-5p 11 mi_down -0.37006 0.001259
ST20-AS1 10 lnc_up 1.167706 0.000122
STK35 10 m_up 1.147951 0.000764
Table 3. ceRNA network node degree centrality rank (TOP15)
3. Discussion
level between CAD and healthy control, and foun d eleven Go and KEGG
pathways (count ≥9), top 15 of PPI network node connectivity rank, and
top 15 of ceRNA network node degree centrality rank, which would
contribute to further exploration for the molecular mechanism of CAD.
Firstly, the Go and KEGG pathways (count ≥9) showed their function in Table 1,
and they contained a large number of differential genes at the statistical
significance level in CAD, thus these Go and KEGG pathways might play a role
of molecular level of CAD. Several further explored experiments related to these
pathways would achieve the interesting and important findings in CAD field.
Secondly, in top 15 of PPI network node connectivity rank, we found that the
extensive protein interaction relationship pairs at the statistical significance
level in CAD (Table 2), which matched with their signal ing pathways in the
biosystems (supplementary Table 15). Some of them were identified to play
a role in cardiovascular diseases. For example, GNG11 was a member of the
gamma subunit family of heteromeric G-protein. Overexpression of GNG11 activated
ERK1/2 of the MAP kinase family, but did not Ras.20 These findings provide clinically relevant biological insight into heritable variation in vagal heart rhythm
regulation, with a key role for genetic variants (GNG11, RGS6) that influence
G-protein heterotrimer action in GIRK-channel induced pacemaker membrane
hyperpolarization (supplementary Table 15).21
CXCL1 was produced mainly by TNF-stimulated endothelial cells (ECs) and
pericytes and supported luminal and sub-EC neutrophil crawling. CXCL1 and
CXCL2 act in a sequential manner to guide neutrophils through venular walls as
governed by their distinct cellular sources.22 Angiotensin II-induced infiltration of monocytes in the heart is largely mediated by CXCL1-CXCR2 signalling which
initiates and aggravates cardiac remodelling. Inhibition of CXCL1 and/or CXCR2
may represent new therapeutic targets for treating hypertensive heart diseases
(supplementary Table 15).23
Wnt-Cxcr4 (C-X-C motif chemokine receptor 4) signaling in regulation of
migration with differentiation.24 Many of the neutrophils reenter the vasculature and have a preprogrammed journey that entails a sojourn in the lungs to up-regulate
CXCR4 before entering the bone marrow, where they undergo apoptosis.25 Vascular CXCR4 limits atherosclerosis by maintaining arterial integrity, preserving endothelial
barrier function, and a normal contractile SMC phenotype. Enhancing these beneficial
functions of arterial CXCR4 by selective modulators might open novel therapeutic
options in atherosclerosis (supplementary Table 15).26
Oleic acid treatment decreases the insulin sensitivity of heart muscle cells, and this
sensitivity is completely restored by transfection with SNAP23. Thus, SNAP23 might
be a link between insulin sensitivity and the inflow of fatty acids to the cell
(supplementary Table 15).27
Co-activator-associated arginine methyltransferase 1 (CARM1) is a crucial
component of autophagy in mammals. CARM1-dependent histone arginine
methylation is a crucial nuclear event in autophagy, and identify a new signalling axis
of AMPK-SKP2-CARM1 in the regulation of autophagy induction after nutrient
starvation (supplementary Table 1 5).28
GPR18 is a cannabinoid-activated orphan G protein-coupled receptor (GPCR) that
is selectively expressed on immune cells.29 A salutary cardiovascular role for GPR18,
mediated, at least partly, via elevation in the levels of adiponectin (supplementary
Table 15).30
Thirdly, in top 15 of ceRNA network node degree centrality rank, the extensive
ceRNA interaction relationship pairs at the statistical significance level in
CAD (Table 3) , which matched with their description in the literature search
(supplementary Table 16). Certainly, we also found that several ceRNA was
related to cardiovascular diseases. For example, by regulating CDKN2A and
inhibiting G1- to S-phase transition STK35L1 may act as a central kinase linking the
cell cycle and migration of endothelial cells. The interaction of STK35L1 with
nuclear actin might be critical in the regulation of these fundamental endothelial
cycle progression and survival (supplementary Table 16).45 Nuclear-retained importin α2 binds with DNase I-sensitive nuclear component(s) and exhibits selective
upregulation of mRNA encoding STK35 by microarray analysis. Chromatin
immunoprecipitation and promoter analysis demonstrated that importin α2 can access
to the promoter region of STK35 and accelerate its transcription in response to
hydrogen peroxide exposure. Furthermore, constitutive overexpression of STK35
proteins enhances caspase-independent cell death under oxidative stress conditions
(supplementary Table 16).46
4. Materials and Methods
4.1. Data Preprocessing
miRNA expression profiling data were obtained from NCBI GEO (Gene
Expression Omnibus, GEO, http://www.ncbi.nlm.nih.gov/geo/) database7 to download the expression profile data after normalization of the dataset
serial number GSE59421. A total of 96 samples with the subjects’
characteristics (63 healthy controls (CTRL), 33 CAD blood samples),
which were detected using the Agilent ‐ 021827 Human miRNA
MicroArray (V3) platform (miRBase release 12.0 miRNA ID version).
The mRNA/lncRNA data were also obtained from the NCBI GEO
database to download the expression profile data after normaliz ation of the
dataset serial number GSE42148. A total of 24 samples with the subjects’
characteristics (11 CTRL, 13 CAD blood samples), which were detected
using the Agilent ‐ 028004 SurePrintG3 Human GE 8 x 60K Microarray
platform (Feature Number version).
4.2. MRNA and lncRNA Annotation
The sequences matched the probes of Agilent -028004 were obtained
from the platform annotation file, a nd the human reference genome
(GRCh38) sequences was downloaded from the GEN CODE database8
(https://www.gencodegenes.org/releas es/current.html), and the probe
sequences were aligned onto the reference genome using the seqmap
and secondly, we referred their position to the chromosome with positive
and negative strand information, the gene matched each probe was obtained
according to the human gene annotation file ( Release 25) provided by
GENCODE.
We kept the probe with the annotating information "protein_coding" as
the matching probe for mRNA, the probes with the annotating information
with "antisense", "sense_intronic", "lincRNA", "sense_overlapping" or
"processed_transcript" were considered to the matching lncRNA probe.
Finally, the probe numbers and mRNA/lncRNA (Gene symbol) were
matched one by one to remove probes that did not match to Gene symbol.
For different probes mapping to the same gene, we used the average of
different probes as the final expression value of the mRNA/lncRNA.
4.3. Differential MRNA, lncRNA and MiRNA Screening
We took the R software limma package with the classical Bayesian
method1 0 (version 3.10.3,
http://www.bioconductor.org/packages/2.9/bioc/html/limma.html) . The
differential analysis was performed between CAD and CTRL. Importantly,
the miRNAs, mRNAs, and lncRNAs were analyzed to obtain their p values
and logFC values, which we re evaluated at the levels of both fold
difference and statistical significance. The threshold of differential
expression was set as miRNA: p value < 0.05 and |logFC| > 0.263 (>1.2
times).
4.4. Functional Enrichment and Pathway Analysis of Differentially
Expressed MRNA
Enrichment analysis was performed with the common enrichment
analysis tool DAVID11 (version 6.8, https://david-d.ncifcrf.gov/) to analyze
the up- and down- regulated genes, which were involved in the pathways of
Gene Ontology BP (biological process),1 2 CC (cellular component), MF
enrichment number (count).
4.5. Protein Interaction Network (PPI) Construction and Node
Connectivity Analysis
In combination with STRING (version: 10.0,
http://www.string-db.org/),1 4 the database predict ed whether there was an interaction relationship between the proteins encoded by the analyzed
genes. The differential mRNAs were inputted into gene sets, and homo was
inputted into species. The parameter of PPI score was set to 0.9 (highest
confidence), the interactional protein nodes were required in the up- and
down- regulated genes. After the PPI re lationship pairs were obtained, the
data were analyzed using Cytoscape software (version 3.4.0,
http://chianti.ucsd.edu/cytoscape-3.4.0/),1 5 for which a network map was constructed. The node connectivity analysis was performed with
parameters of no weigh by using the CytoNCA plugin (Version 2.1.6,
http://apps.cytoscape.org/ apps/cytonca).1 6 The results obtained the important nodes in the PPI network that were involved in protein
interaction relationships, i.e., hub proteins, through the connectivity
Degree Centrality (DC) rank of individual nodes.
4.6. lncRNA and MRNA Co-expression Analysis
The correlation test was performed and their pearson correlation
coefficients of the differential mRNA and lncRNA were respectively
calculated by using the matched sample of mRNA and lncRNA data. The
relationship pairs with r > 0.7 (coordinate expression) and p value < 0.05
were focused on screening for the subsequent ceRNA network co nstruction,
and these mRNAs were considered to be s ignificantly correlated with
lncRNAs, while mRNAs were considered as potential target genes of
lncRNAs.
4.7. Target Genes MiRNA and The Prediction for Their Upstream lncRNA
Based on the differential miRNAs obt ained from the differential analysis,
database1 7 was used, which integrated the four typical databases including miRWalk, miRanda, RNA22, and TargetScan . If the predicted target genes
were presented in each of four databases, the marching mRNA was
considered to be regulated by the miRNA . After the predicted
miRNA-mRNA relationship pairs were obtained, the mRNAs were f urther
intersected with the differential mRNAs to obtain the differential
miRNA-differential mRNA relationship pairs.
With regard to differential lncRNAs versus differential miRNAs, we
used the local software miRanda (v3.3a)1 8 to predict differential miRNA-differential lncRNA relationship pairs through software
parameters (-sc140, -en-20, i.e., screen score > = 140, energy < = -20).
4.8. Pathway Enrichment Analysis of lncRNAs and MiRNAs
Based on the obtained lncRNA-mRNA co-expression relationship pairs
and miRNA-mRNA relationship pairs, mRNAs were used as potential
target genes of matching lncRNAs and miRNAs, respectively. KEGG
Pathway enrichment analysis was performed by using the R package
clusterProfiler (version: 3.8.1,
http://bioconductor.org/packages/relea se/bioc/html/clusterProfiler.html) ,1 9
and its results indirectly predict ed the functions of lncRNAs and miRNAs.
The threshold was set at p value < 0.05.
4.9. CeRNA Network Construction
Based on the obtained mRNA-miRNA and lncRNA-miRNA relationship
pairs, we firstly screened the miRNA-lncRNA-mRNA relationship pairs
regulated by the same miRNA, then combined the positive co-expression
relationship between mRNA and lncRNA (correlation coefficient > 0.7),
and further screened the miRNA-lncRNA-mRNA relationship pairs for
network construction, i.e., the ceRNA network . Thus, the lncRNAs and
mRNAs with positive co-expression relationship regulated by the same
miRNA in the ceRNA network were each other ceRNAs.
using the Cytoscape plugin CytoNCA with the parameter set to no weight.
The higher the connectivity, the higher the import ance of this node in the
network.
5. Conclusions
Based on eleven Go and KEGG pathways, top 15 of PPI network node connectivity
rank, and top 15 of ceRNA network node degree centrality rank in CAD population,
our findings would contribute to further exploration for the molecular mechanism of
CAD.
Supplementary Materials: Supplementary tables can be found in supplementary
Material
Authors' Contributions: Shen Kang conceived and designed the study, Shen Kang
analyzed data and drafted the manuscript, Yong Ye participated in the data collection.
Guang Xia was responsible for quality control and revised the manuscript, Haibo Liu
analysis the data and participated in the fund support of the study.
Funding: This work was supported in part by Projects of National Natural Science
Foundation of China (81870247, 81770350, 81800224); Key Disciplines Group
Construction Project of Pudong Health Bureau of Shanghai (Grant No. PWZxq
2017-05), and Top-level Clinical Discipline Project of Shanghai Pudong District
(Grant No. PWYgf 2018-02).
Acknowledgements: We sincerely appreciated Wei Song and Hong-Chun Fan for
technical support in the study.
Abbreviations
BP biological process
CAD coronary artery disease
CARM1 Co-activator-associated arginine methyltransferase 1
References
1.Cannon CP, Blazing MA, Giugliano RP, et al. Ezetimibe Added to Statin Therapy
after Acute Coronary Syndromes. N Engl J Med 2015;372(25):2387-2397.
2.Karakas M, Schulte C, Appelbaum S, et al. Circulating microRNAs strongly predict
cardiovascular death in patients with coronary artery disease-results from the large
AtheroGene study. Eur Heart J 2017;38(7):516-523.
3.Graham MJ, Lee RG, Brandt TA, et al. Cardiovascular and Metabolic Effects of
ANGPTL3 Antisense Oligonucleotides. N Engl J Med 2017;377(3):222-232.
4.Lo Sardo V, Chubukov P, Ferguson W, et al. Unveiling the Role of the Most
Impactful Cardiovascular Risk Locus through Haplotype Editing.
Cell 2018;175(7):1796-1810.
5.Salmena L, Poliseno L, Tay Y, Kats L, Pandolfi PP. A ceRNA hypothesis: the
Rosetta Stone of a hidden RNA language? Cell 2011;146(3):353-358.
6.de Giorgio A, Krell J, Harding V, Stebbing J, Castellano L. Emerging roles of
ceRNA competitive endogenous RNA
circRNA circular RNA
CTRL control
Cxcr4 C-X-C motif chemokine receptor 4
DC degree centrality
ECs endothelial cells
GPCR G protein-coupled receptor
lncRNA long-chain non-coding RNA
MF molecular functio n
miRNAs microRNAs
MRE miRNA response element
mRNA messenger RNA
OPCs oligodendrocyte precursor cells
PPI protein interaction network
competing endogenous RNAs in cancer: insights from the regulation of PTEN. Mol
Cell Biol 2013;33(20):3976- 3982.
7.Barrett T, Suzek TO, Troup DB, et al. NCBI GEO: mining millions of expression
profiles--database and tools. Nucleic Acids Res 2005;33(Database issue): D562-566.
8.Harrow J, Frankish A, Gonzalez JM, et al. GENCODE: the reference human
genome annotation for The ENCODE Project. Genome Res 2012;22(9):1760-1774.
9.Jiang H, Wong WH. SeqMap: mapping massive amount of oligonucleotides to the
genome. Bioinformatics 2008;24(20):2395-2396.
10.Smyth, G.K., limma: Linear Models for Microarray Data, in Bioinformatics and
Computational Biology Solutions Using R and Bioconductor, R. Gentleman, et al.,
Editors. 2005, Springer New York: New York, NY. p. 397-420.
11.Huang da W, Sherman BT, Lempicki RA. Systematic and integrative analysis
of large gene lists using DAVID bioinformatics resources. Nat
Protoc 2009;4(1):44-57.
12.Ashburner M, Ball CA, Blake JA, et al. Gene ontology: tool for the unification
of biology. The Gene Ontology Consortium. Nat Genet 2000;25(1):25-29.
13.Kanehisa M, Goto S. KEGG: kyoto encyclopedia of genes and genomes.
Nucleic Acids Res 2000;28(1):27-30.
14.Szklarczyk D, Franceschini A, Wyder S, et al. STRING v10: protein-protein
interaction networks, integrated over the tree of life. Nucleic Acids Res 2015;43
(Database issue): D447-D452.
15.Shannon P, Markiel A, Ozier O, et al. Cytoscape: a software environment for
integrated models of biomolecular interaction networks. Genome
Res 2003;13(11):2498-2504.
16.Tang Y, Li M, Wang J, Pan Y, Wu FX. CytoNCA: a cytoscape plugin for centrality
analysis and evaluation of protein interaction networks. Biosystems 2015; 127:67-72.
17.Yu G, Wang LG, Han Y, He QY. clusterProfiler: An R package for comparing
biological themes among gene clusters. OMICS. 2012;16(5):284-7.
18.Dweep H, Gretz N. miRWalk2.0:
Methods 2015;12(8):697.
19.Enright AJ, John B, Gaul U, Tuschl T, Sander C, Marks DS.
MicroRNA targets in Drosophila. Genome Biol 2003;5(1): R1.
20.Hossain MN, Sakemura R, Fujii M, Ayusawa D. G-protein gamma subunit
GNG11 strongly regulates cellular senescence. Biochem Biophys Res
Commun 2006;351(3):645-650.
21.Nolte IM, Munoz ML, Tragante V, et al. Genetic loci associated with heart rate
variability and their effects on cardiac disease risk. Nat Commun 2017;8:15805.
22.Girbl T, Lenn T, Perez L, et al. Distinct Compartmentalization of the Chemokines
CXCL1 and CXCL2 and the Atypical Receptor ACKR1 Determine Discrete Stages of
Neutrophil Diapedesis. Immunity 2018;49(6):1062-1076.
23.Wang L, Zhang YL, Lin QY, et al. CXCL1-CXCR2 axis mediates angiotensin
II-induced cardiac hypertrophy and remodelling through regulation of monocyte
infiltration. Eur Heart J 2018; 39(20):1818-1831.
24.Tsai HH, Niu J, Munji R, et al. Oligodendrocyte precursors migrate along
vasculature in the developing nervous system. Science 2016;351(6271):379-384.
25.Wang J, Hossain M, Thanabalasuriar A, Gunzer M, Meininger C, Kubes P.
Visualizing the function and fate of neutrophils in sterile injury and repair.
Science 2017;358(6359):111-116.
26.Döring Y, Noels H, van der Vorst EPC, et al. Vascular CXCR4 Limits
Atherosclerosis by Maintaining Arterial Integrity: Evidence From Mouse and Human
Studies. Circulation 2017;136(4):388-403.
27.Boström P, Andersson L, Rutberg M, et al. SNARE proteins mediate fusion
between cytosolic lipid droplets and are implicated in insulin sensitivity. Nat Cell Biol
2007;9(11):1286-1293.
28.Shin HJ, Kim H, Oh S, et al. AMPK-SKP2-CARM1 signalling cascade in
transcriptional regulation of autophagy. Nature 2016;534(7608):553-557.
29.Reyes-Resina I, Navarro G, Aguinaga D, et al. Molecular and functional
interaction between GPR18 and cannabinoid CB2 G-protein-coupled receptors.
30.Matouk AI, Taye A, El-Moselhy MA, Heeba GH, Abdel-Rahman AA. The Effect
of Chronic Activation of the Novel Endocannabinoid Receptor GPR18 on Myocardial
Function and Blood Pressure in Conscious Rats. J Cardiovasc Pharmacol
2017;69(1):23-33.
31.Sun KY, Peng T, Chen Z, Song P, Zhou XH. Long non-coding RNA
LOC100129148 functions as an oncogene in human nasopharyngeal carcinoma by
targeting miR-539-5p. Aging (Albany NY) 2017;9(3):999-1011.
32.Wei JQ, Chen H, Zheng XF, et al. Hsa-miR-654-5p regulates osteogenic
differentiation of human bone marrow mesenchymal stem cells by repressing bone
morphogenetic protein 2. Nan Fang Yi Ke Da Xue Xue Bao 2012;32(3):291-295.
33.Liu Y, Lu C, Zhou Y, Zhang Z, Sun L. Circular RNA hsa_circ_0008039 promotes
breast cancer cell proliferation and migration by regulating miR-432-5p/E2F3 axis.
Biochem Biophys Res Commun 2018;502(3):358-363.
34.Xu H, Han H, Song S, et al.
Exosome-Transmitted PSMA3 and PSMA3-AS1 Promote Proteasome Inhibitor
Resistance in Multiple Myeloma. Clin Cancer Res 2019;25(6):1923-1935.
35.Thiebaut C1, Chesnel A2, Merlin JL, et al. Dual Epigenetic Regulation of ERα36
Expression in Breast Cancer Cells. Int J Mol Sci 2019;20(11). pii: E2637.
36.Watts AE, Millar NL, Platt J, et al. MicroRNA29a Treatment Improves Early
Tendon Injury. Mol Ther 2017;25(10):2415-2426.
37.Bai X, Geng J, Li X, et al. Long Noncoding RNA LINC01619 Regulates
MicroRNA-27a/Forkhead Box Protein O1 and Endoplasmic Reticulum
Stress-Mediated Podocyte Injury in Diabetic Nephropathy. Antioxid Redox
Signal 2018;29(4):355-376.
38.Shivakumar M, Lee Y, Bang L, Garg T, Sohn KA, Kim D. Identification of
epigenetic interactions between miRNA and DNA methylation associated with gene
expression as potential prognostic markers in bladder cancer. BMC Med
Genomics 2017;10(Suppl 1):30.
39.Hasan MM, Akter R, Ullah MS, Abedin MJ, Ullah GM, Hossain MZ. A
Genome. Adv Bioinformatics 2014;2014: 967946.
40.Zhang WC, Chin TM, Yang H, et al. Tumour-initiating cell-specific miR-1246 and
miR-1290 expression converge to promote non-small cell lung cancer progression.
Nat Commun 2016; 7:11702.
41.Schulz J, Takousis P, Wohlers I, et al. Meta-analyses identify differentially
expressed micrornas in Parkinson's disease. Ann Neurol 2019;85(6):835-851.
42.Meng Y, Quan L, Liu A. Identification of key microRNAs associated with diffuse
large B-cell lymphoma by analyzing serum microRNA expressions. Gene 2018;
642:205-211.
43.Wang W, Zhao Z, Yang F, et al. An immune-related lncRNA signature for patients
with anaplastic gliomas. J Neurooncol 2018;136(2):263-271.
44.Goyal P, Behring A, Kumar A, Siess W. STK35L1 associates with nuclear actin
and regulates cell cycle and migration of endothelial cells. PLoS One 2011;6(1):
e16249.
45.Miyamoto Y, Whiley PAF, Goh HY, et al. The STK35 locus contributes to normal
gametogenesis and encodes a lncRNA responsive to oxidative stress. Biol
Open 2018;7(8). pii: bio032631.
46.Yasuda Y, Miyamoto Y, Yamashiro T, et al. Nuclear retention of import in α