A childhood acute lymphoblastic leukemia
genome-wide association study identi
fi
es
novel sex-speci
fi
c risk variants
Sandeep K. Singh, PhD
a,b, Philip J. Lupo, PhD
c, Michael E. Scheurer, PhD
d, Anshul Saxena, MPH
e,
Amy E. Kennedy, PhD
f, Boubakari Ibrahimou, PhD
g, Manuel Alejandro Barbieri, PhD
b, Ken I. Mills, PhD
h,
Jacob L. McCauley, PhD
i, Mehmet Fatih Okcu, MD, MPH
d, Mehmet Tev
fi
k Dorak, MD, PhD
j,∗Abstract
Childhood acute lymphoblastic leukemia (ALL) occurs more frequently in males. Reasons behind sex differences in childhood ALL risk are unknown. In the present genome-wide association study (GWAS), we explored the genetic basis of sex differences by comparing genotype frequencies between male and female cases in a case-only study to assess effect-modification by sex.
The case-only design included 236 incident cases of childhood ALL consecutively recruited at the Texas Children’s Cancer Center in Houston, Texas from 2007 to 2012. All cases were non-Hispanic whites, aged 1 to 10 years, and diagnosed with confirmed B-cell precursor ALL. Genotyping was performed using the Illumina HumanCoreExome BeadChip on the Illumina Infinium platform. Besides the top 100 statistically most significant results, results were also analyzed by the top 100 highest effect size with a nominal statistical significance (P<0.05).
The statistically most significant sex-specific association (P=4 106) was with the single nucleotide polymorphism (SNP) rs4813720 (RASSF2), an expression quantitative trait locus (eQTL) forRASSF2in peripheral blood. rs4813720 is also a strong methylation QTL (meQTL) for a CpG site (cg22485289) within RASSF2 in pregnancy, at birth, childhood, and adolescence. cg22485289 is one of the hypomethylated CpG sites in ALL compared with pre-B cells. Two missense SNPs, rs12722042 and 12722039, in theHLA-DQA1gene yielded the highest effect sizes (odds ratio [OR]∼14;P<0.01) for sex-specific results. The HLA-DQA1SNPs belong toDQA1∗01and confirmed the previously reported male-specific association withDQA1∗01. Thisfinding supports the proposed infection-related etiology in childhood ALL risk for males. Further analyses revealed that most SNPs (either direct effect or through linkage disequilibrium) were within active enhancers or active promoter regions and had regulatory effects on gene expression levels.
Cumulative data suggested thatRASSF2rs4813720, which correlates with increasedRASSF2expression, may counteract the suppressor effect of estrogen-regulated miR-17-92 onRASSF2resulting in protection in males. Given the amount of sex hormone-related mechanisms suggested by ourfindings, future studies should examine prenatal or early postnatal programming by sex hormones when hormone levels show a large variation.
Abbreviations: ADAM28 = ADAM metallopeptidase domain 28, ALL = acute lymphoblastic leukemia, ARID5B = AT rich interactive domain 5b, BCM=Baylor College of Medicine, CI=confidence interval, eQTL=expression quantitative trait locus, ER= estrogen receptor, ERCC1=excision repair cross-complementation group 1, FDR=false discovery rate, FIU=Florida International University, GSEA = gene set enrichment analysis, GWAS = genome-wide association study, H3K27ac = histone-3 lysine-27acetylation, H3K4me1=histone-3 lysine-4 monomethylation, H3K4me3=histone-3 lysine-4 trimethylation, H3K9ac=histone-3 lysine-9 acetylation, HLA-DQA1=major histocompatibility complex, class II, DQ alpha 1, HWE=Hardy–Weinberg equilibrium, IFNG
=interferon gamma, IRF1=interferon regulatory factor 1, KAT7=K(lysine) acetyltransferase 7, LD=linkage disequilibrium, meQTL= methylation quantitative trait locus, MILE study=The Microarray Innovations in Leukemia study, NF=nuclear factor, OR=odds ratio, QC=quality control, QQ=quantile-quantile, RAP1GAP2=RAP1 GTPase activating protein 2, RASSF2=Ras association
Editor: Daryle Wane.
This work has been supported by funds from the Robert Stempel College of Public Health and Social Work, Florida International University. The authors have no conflicts of interest to disclose.
Supplemental Digital Content is available for this article.
a
Department of Environmental and Occupational Health, Robert Stempel College of Public Health and Social Work, Florida International University, Miami, FL,
b
Department of Biological Sciences, Florida International University, Miami, FL,c
Department of Pediatrics, Section of Hematology-Oncology, Texas Children’s Cancer Center,dDepartment of Pediatrics, Section of Hematology-Oncology, Baylor College of Medicine, Houston, TX,eDepartment of Health Promotion and Disease Prevention, Robert Stempel College of Public Health and Social Work, Florida International University, Miami, FL,f
Division of Cancer Control and Population Sciences, National Cancer Institute, National Institutes of Health, Bethesda, MD,g
Department of Biostatistics, Robert Stempel College of Public Health and Social Work, Florida International University, Miami, FL,h
Centre for Cancer Research and Cell Biology (CCRCB), Queen’s University Belfast, Belfast, UK,i
Dr. John T. Macdonald Foundation, Department of Human Genetics, John P. Hussman Institute for Human Genomics, Biorepository Facility, Center for Genome Technology University of Miami, Miller School of Medicine,j
Department of Epidemiology, Robert Stempel College of Public Health and Social Work, Florida International University, Miami, FL.
∗
Correspondence: Mehmet Tevfik Dorak, School of Health Sciences, Liverpool Hope University, Liverpool, L16 9JD, UK (e-mail: dorakm@hope.ac.uk). Copyright©2016 the Author(s). Published by Wolters Kluwer Health, Inc. All rights reserved.
This is an open access article distributed under the Creative Commons Attribution-NoDerivatives License 4.0, which allows for redistribution, commercial and non-commercial, as long as it is passed along unchanged and in whole, with credit to the author.
Medicine (2016) 95:46(e5300)
Received: 6 June 2016 / Received infinal form: 27 September 2016 / Accepted: 11 October 2016 http://dx.doi.org/10.1097/MD.0000000000005300
Observational Study
Medicine
domain family member 2, SCAN=SNP and copy number annotation, SNP=single nucleotide polymorphism, TFBS=transcription factor binding sites, TXCCC=Texas Children’s Cancer Center, US=United States.
Keywords:acute lymphoblastic leukemia, case-only study, effect modification, expression quantitative trait loci, gene expression regulation, genome-wide association study, sex-specific association
1. Introduction
Acute lymphoblastic leukemia (ALL) is the most common pediatric malignancy, with an annual incidence rate of 42 cases
per million children under age 15 in the United States.[1]While
overall 5-year survival rate has improved to 80% on average, the US annual incidence rate increased by 0.8% per year from 1975
to 2012 in children aged 14 years and younger.[1,2]. Like many
other diseases and cancers, childhood ALL risk shows consistent
sex differences.[1,3–5] Males show a higher incidence rate in
comparison to females (45 cases per million children versus 39 cases per million children per year, respectively) in the United
States.[1] Relapse and secondary malignancies are also more
common in males.[6] Reasons underlying sex differences in
childhood ALL risk are still unknown, as it has not been
extensively evaluated.[4]
The sex difference in susceptibility to complex disorders is an active research area, and some progress has been made in recent
years.[7,8] Studies that examined sex differential for etiological
clues identified several sex-specific genetic markers also for
childhood ALL risk.[9–14] For example, a study that examined
previously identified childhood ALL single nucleotide
polymor-phisms (SNPs) in genome-wide association studies (GWAS)[15,16]
reported sex-specific effects of 2 statistically correlatedARID5B
(AT-rich interactive domain 5b) SNPs (rs10994982 [P=0.01]
and rs10740055 [P=0.03]), with ALL risk in males (odds ratio
[OR]=3.79 and OR=4.35, respectively; ORs for females=1.03
and 1.37, respectively).[12] Candidate gene studies have also
reported sex differences in genetic associations in childhood ALL.
Two SNPs in ERCC1 (excision repair cross-complementation
group 1) are associated with childhood ALL risk among males,
but not with females.[13]Likewise, several multiple sclerosis risk
markers, such asHLA-DRA(rs3135388),HLA-C(rs9264942),
HSPA1B(rs1061581), andIFNG(rs2069727), also yielded
sex-specific associations with childhood ALL risk.[10] Associations
with an intronic SNP (rs12203592) inIRF4and an intergenic
SNP (rs2395185) nearHLA-DRAfurther suggest the existence
of sex-specific genetic risk variants.[9,11]
The robust and replicated sex-specific association with an
IFNG(interferon gamma) polymorphism (rs2069727;Pinteraction
=0.008) in asthma suggests the existence of genetic contribution
to sex differences in nonmalignant childhood disorders.[17]The
same SNP also shows a sex-specific association with childhood
ALL risk.[10] A recent genome-wide meta-analysis of asthma
revealed sex-specific candidate risk markers in interferon
regulatory factor 1 (IRF1) and RAP1 GTPase activating protein
2 (RAP1GAP2) with regulatory effects in gene regulation as
expression quantitative trait loci (eQTL).[18] Yao et al[19]
examined 11,672 disease-associated polymorphisms from the National Human Genome Research Institute GWAS catalog and dbGaP database in relation to gene expression levels in the whole
blood derived RNA and identified 14 sex-specific eQTLs. A
recent survey of correlations between SNPs and gene expression levels by sex showed that up to 15% of autosomal SNPs have a
gender bias in their correlations.[20] Similarly, another study
reported that 582 autosomal genes have sex-specific differences
in their expression levels.[21]Such sex-specific signals are likely to
be diluted or cancelled out when both genders are analyzed simultaneously. Likewise, reanalysis of GWAS datasets revealed that coronary artery diseases, Crohn disease, rheumatoid
arthritis, and type1 diabetes show sex-specific associations with
increased risk in only 1 gender.[22,23]In the present GWAS, we
explored the genetic basis of sex differences by comparing genotype frequencies between male and female cases with childhood ALL using a case-only study design.
2. Materials and methods
2.1. Study design
We used a case-only design because of its greater statistical power
in detecting effect modification, in this case, sex and genotype
interactions, in comparison to other traditional epidemiological
designs.[24] An assumption of the case-only design requires
genotype and sex to be independent in the healthy population. There is no reason to believe that healthy male and female controls have different genotype frequencies in autosomal chromosomes. Recruitment of cases in a rare disease like childhood ALL is a challenge; hence, preferring a statistically more powerful research design was more practical.
2.2. Subject recruitment
Institutional review board approval was granted by Florida
International University (FIU), Office of Research Integrity, and
Baylor College of Medicine (BCM) prior to the study. Samples for the current study were obtained from a parent case-control study
of childhood ALL and has been explained elsewhere in detail.[11]
Briefly, incident cases of childhood ALL were consecutively
recruited at the Texas Children’s Cancer Center (TXCCC), BCM,
in Houston, Texas from 2007 to 2012. The present study used 236 cases from the parent study for the case-only analysis. They were all non-Hispanic whites, aged 1 to 10 years, and diagnosed
with confirmed B-cell precursor ALL. Genomic DNA was
extracted from blood samples at TXCCC, BCM. Established
childhood ALL risk associations identified in previous
GWAS[14–16] have been replicated to validate the parent
case-control study sample using TaqMan allelic discrimination assays
at FIU.[11]
2.3. Genotyping
Genotype data were generated using the Illumina Human-CoreExome BeadChip (Illumina, San Diego, CA) on the Illumina Infinium platform at the John P. Hussman Institute of Human Genomics, University of Miami, Florida.
2.4. Data analysis
Quality control (QC) steps were performed in a hierarchial
fashion using PLINK and R packages.[25]Sample QC was done
prior to SNP QC. The Hardy–Weinberg equilibrium (HWE)
sex-specific analysis. Unconditional logistic regression was used to calculate allelic ORs and 95% confidence intervals (CIs) after coding males as cases and females as controls. The coding of male and female cases for statistical analysis meant that an OR greater than 1.0 indicates greater risk for males compared with females. Power analysis and sample software was used to calculate statistical power for various risk genotype frequencies. The study was statistically powered to detect qualitative interactions, that is sex-specific associations differing in direction (risk or protection); rather than associations in the same direction and differing in magnitude (quantitative interactions). Permutation testing
(10,000 permutations) was performed for all sex-specific results
to rule out chancefindings using a threshold ofP<0.05. Results
were adjusted for potential population stratification using the
genomic control method.[26]A quantile-quantile (Q-Q) plot was
used to rule out systematic errors (Supplementary Figure 1, http:// links.lww.com/MD/B374). Besides the top 100 statistically most significant results (Supplementary Table 1, http://links.lww.com/ MD/B375), results were also analyzed by the OR with a nominal
statistical significance (P<0.05) (Supplementary Table 2, http://
links.lww.com/MD/B376).
2.5. Bioinformatic analysis
To functionally annotate the SNPs that have shown sex-specific
associations, a number of bioinformatic tools were used. Variants were annotated for their effects on the gene expression, protein, and the predicted function using several bioinformatic and empirical tools. ANNOVAR was used to obtain functionality scores (DANN, FATHMM, GWAVA, SIFT, PolyPhen2, Muta-tion Taster, MutaMuta-tion Assessor, LRT, FATHMM, and MetaLR),
as well as conservation scores.[27]ANNOVAR and SNPnexus[28]
were used to predict the effect of variants on transcription factor binding sites (TFBS), microRNA binding sites and identification of variants that disrupt enhancers, repressors, and promoters.
Complementary annotations were performed using CADD,[29]
RegulomeDB,[30]HaploReg v4,[31]SNiPA,[32]and rVarBase.[33]
GWAS3D was used to predict genetic variants or variants in linkage disequilibrium (LD) affecting regulatory pathways and essential disease/trait associations by integrating functional genomics, chromatin state, sequence motif, and conservation
information.[34]It also provides visualization tools to
compre-hend the results. To assess correlations of SNPs with gene expression levels in peripheral blood cells, we used SNP and Copy
Number Annotation (SCAN) database[35]and Blood eQTL[36]
databases. For each SNP, the Blood eQTL database and SCAN provided information from experimental data on gene expression
regulation in peripheral blood cells and lymphoblastoid cell lines, respectively. Likewise, we screened mQTLdb for
methylation-QTLs (meQTL) to examine effects of sex-specific variants on
CpG islands[37]at birth, during childhood and adolescence as
well as during pregnancy. Statistically similar (proxy) SNP sets
for each SNP were obtained from HaploReg v4,[31] and were
submitted to the tools listed above for a number of analyses. For direct observation of TFBSs nearby SNPs, we examined the Swiss
Regulon browser.[38]Gene set enrichment analysis (GSEA) was
performed using DAVID v6.7.[39]The interactions of candidate
genes with other genes and noncoding RNAs were investigated
using NPinter v3.0,[40] which provides experimental data.
Computational miRNA targets on protein-coding genes were
explored using TargetScan.[41]To map theHLA-DQA1SNPs to
HLA-DQA1 types, we examined complete sequences of
HLA-DQA1alleles in the IPD-IMGT/HLA Database (http://www.ebi.
ac.uk/ipd/imgt/hla).
2.6. The microarray innovations in leukemia (MILE) study
The MILE study generated microarray-based gene expression profiles from 2096 patients with standard subtypes of acute and chronic leukemia (and myelodysplastic syndromes) in 11
laboratories on 3 continents.[42]The aim of the study was to
examine gene expression profiles for diagnosis and subclassifi
ca-tion. The individual level data from the 2096 patients were available to compare expression levels of different genes of interest in different leukemia subtypes.
3. Results
After stringent QC, 209 subjects and 271,069 SNPs were
included in the statistical analysis. In thefinal dataset, genotype
call rates were >99.9%. All QC steps and their results are
reported in Table 1. Thefinal sample included 116 males (55.5%)
and 93 females (44.5%) with no statistically significant difference
in age distribution (P=0.43). The mean age was 4.45 (±2.58)
years for males and 4.73 (±2.32) years for females. The genomic
inflation factor (l), an indicator of population stratification, was
1.0, which suggested no population stratification, as confirmed by the Q-Q plot (Supplementary Figure 1, http://links.lww.com/ MD/B374). The design was ideal to detect sex-specific
associ-ations as the reflection of allele frequencies higher in one sex
than the other. Naturally, the allele frequencies in the pooled sample would be in between sex-specific frequencies. We checked this assumption by using the frequencies for the European sample in the HapMap project (Tables 2 and 3). At least for the higher
Table 1
Quality control steps for samples and SNPs.
QC steps Criteria for QC Numbersfiltered
Sample Sex discordant We used genetically identified sex information based on sex
chromosomes instead of reported sex information
5
Sample call rate Call rate99% 14
Heterozygosity rate Autosomal heterozygosity rate outside of±3 standard deviations from the mean 8
Duplicate Samples excluded as duplicate (PI_HAT>90%) 0
SNP Genotype call rate Call rate<99% 6261
MAF MAF0.03 260,641∗
Missingness between males and females Differential missingness between males and females withP<1.0103 478
HWE HWE (P<103) was used in the whole group 0
HWE=Hardy–Weinberg equilibrium, MAF=minor allele frequency, QC=quality control, SNP=single nucleotide polymorphism.
∗
ranking results, HapMap frequencies were between the frequen-cies observed in male and female cases.
When results were ranked according to their P values, the
smallestPvalue was 3.8106forRASSF2(Ras association
domain family member 2), rs4813720 association, ORinteraction=
0.30) indicating males with the minor allele were less likely to develop ALL compared with females with the minor allele (Table 2 and Supplementary Table 1, http://links.lww.com/MD/
B375). The SNP rs4813720 correlates withRASSF2expression
levels (P=2.1106) in peripheral blood cells[36]
(Supplemen-tary Table 3, http://links.lww.com/MD/B377). Bioinformatic
analysis also yielded high functionality scores (CADD=5.13;
DANN=0.7). According to rVarBase analysis, this SNP maps to
active enhancers in highly relevant cell types: primary hemato-poietic cells, primary B cells, primary T-helper cells, primary neutrophils, and monocytes. HaploReg v4 analysis revealed that a nearby (552 bp away) SNP, rs7271897, is in LD with
rs4813720 (r2=0.70), and alters an estrogen receptor
(ER)-alpha binding site. Likewise, rs13045004 (within 3 kb) is in LD
with rs4813720 (r2=0.70), and alters an NF-kB binding site. In
HaploReg analysis, there were 3 SNPs in strong LD (r2≥0.80)
with rs4813720, but most bioinformatic analyses predicted rs4813720 as the putative causal SNP. An indel SNP rs3215695
was statistically correlated (r2=0.98) with rs4813720 yielding a
high functional score (2b) for RegulomeDB. This SNP is also located in an active transcription start site.
Having observed that the statistically most significant
association (RASSF2 rs4813720) was likely to be causal, we
performed extended in silico analysis of rs4813720. Besides being
an eQTL forRASSF2in peripheral blood cells, this SNP is also
located within enhancers in cell types relevant to leukemia. Since
RASSF2is frequently methylated in tumors,[43]we also examined
whether rs4813720 is a meQTL. Screening of the mQTLdb showed that rs4813720 is a very strong meQTL for the CpG site
cg22485289 (Table 4) in the promoter region ofRASSF2at most
time points examined (pregnancy, birth, childhood, and
adoles-cence;P91014), and at middle age, but not as significantly
(P=21010).
Having established that our top hit rs4813720 is an eQTL for
RASSF2and a meQTL for a CpG site within the same gene, we
examined whether it may be involved in any other mechanism
that would affect the expression levels of RASSF2. The
examination of the NPinter database revealed that RASSF2
physically interacts with mir-19a/19b. TargetScan also predicts
mir-19b binding toRASSF23’UTR. However, none of the SNPs
in the statistically similar SNP set of rs4813720 were within the
Table 2
SNPs associated with sex-specific childhood ALL risk at the significance levelP<10−4.
SNP Gene/region Chr
Minor
allele Location
MAF (males)
HapMap CEU MAF
MAF (females)
ORallele
(95% CI)∗ Pvalue†
Pvalue
(permutation)‡
rs4813720 RASSF2 20 A Intron 0.23 0.37 0.44 0.30 (0.18–0.50) 3.85106 1.0104
rs231237 HSPB6/PROSER3 19 A Intron 0.42 0.39 0.21 3.02 (1.87–4.89) 6.79106 1.0104
rs7323018 13q14.11 13 G Intergenic 0.17 0.32 0.36 0.30 (0.18–0.51) 7.42106 1.0104
rs17027254 2p22.1 2 T Intergenic 0.19 0.40 0.40 0.36 (0.23–0.58) 1.66105 1.0104
rs798292 MAGI2 7 G Intron 0.16 0.24 0.35 0.38 (0.24–0.60) 4.47105 1.0104
rs13107783 4p15.31 4 A Intergenic 0.32 0.51 0.52 0.40 (0.26–0.62) 5.21105 1.0104
rs7912381 10q26.3 10 G Intergenic 0.39 0.32 0.21 2.71 (1.67–4.51) 5.47105 2.0104
rs206457 18p11.22 18 T Intergenic 0.59 0.43 0.38 2.30 (1.53–3.45) 6.31105 1.0
104
rs7723568 5p15.33 5 A Intergenic 0.35 0.30 0.17 2.77 (1.68–4.56) 6.66105 1.0
104
rs1849374 12p11.22 12 A Intergenic 0.44 0.29 0.25 2.49 (1.59–3.92) 7.20105 2.0
104
rs506389 8q22.3 8 A Intergenic 0.28 0.19 0.11 3.00 (1.74–5.17) 7.99105 2.0
104
rs349714 3p25.3 3 T Intergenic 0.45 0.50 0.26 2.45 (1.57–3.83) 8.60105 1.0104
ALL=acute lymphoblastic leukaemia, CEU=European sample in HapMap project, Chr=chromosome, MAF=minor allele frequency, SNP=single nucleotide polymorphism.
∗
Interaction odds ratio per allele (ORallele) for the additive model.
†Pvalue adjusted for genomic control.
‡Pvalue permutation=point-wisePvalue from maxT permutation analysis after 10,000 permutation.
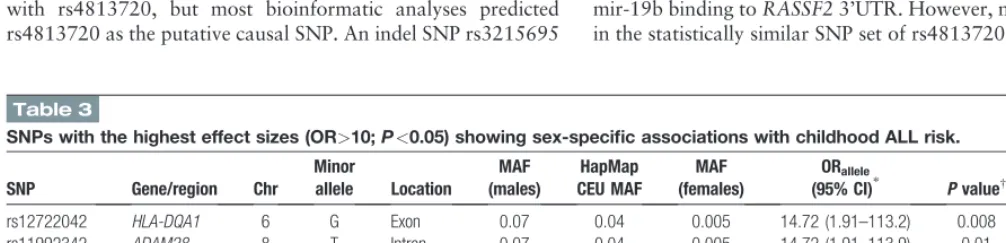
Table 3
SNPs with the highest effect sizes (OR>10;P<0.05) showing sex-specific associations with childhood ALL risk.
SNP Gene/region Chr
Minor
allele Location
MAF (males)
HapMap CEU MAF
MAF (females)
ORallele
(95% CI)∗ Pvalue†
Pvalue
(permutation)‡
rs12722042 HLA-DQA1 6 G Exon 0.07 0.04 0.005 14.72 (1.91–113.2) 0.008 6.0104
rs11992342 ADAM28 8 T Intron 0.07 0.04 0.005 14.72 (1.91–113.9) 0.01 0.001
rs12722039 HLA-DQA1 6 A Exon 0.07 0.04 0.005 14.08 (1.84–107.5) 0.009 5.0104
rs80040922 UMODL1 21 A Exon 0.06 0.04 0.005 13.66 (1.77–105.5) 0.01 0.001
rs61753605 PRIM2 6 C Exon 0.06 0.02 0.005 13.37 (1.73–103.2) 0.01 0.002
rs35665085 CECR5 22 G Exon 0.06 0.05 0.005 12.63 (1.63–97.92) 0.02 0.003
rs143021649 CNTN3 3 T Exon 0.06 0.04 0.005 11.61 (1.49–90.50) 0.02 0.003
rs6795524 PROS1 3 G Intron 0.05 0.006 0.005 10.62 (1.35–83.22) 0.02 0.008
rs10003468 4q28.1 4 C Intergenic 0.05 0.02 0.005 10.62 (1.35–83.22) 0.02 0.006
ALL=acute lymphoblastic leukaemia, CEU=European sample in the HapMap project, Chr=chromosome, MAF=minor allele frequency, OR=odds ratio, SNP=single nucleotide polymorphism.
∗
Interaction odds ratio per allele (ORallele) for the additive model.
†Pvalue adjusted for genomic control.
microRNA binding site in 3’UTR. To gain further insight into
RASSF2 function, we obtained the list of experimentally
confirmed target gene list for mir-19a/19b (n=298) from NPinter
database, and subjected this list to GSEA on DAVID. The highest fold enrichment (12.4) was observed for RAS association category, which was also the statistically most significant (false
discovery rate [FDR]=0.004). Apoptosis was also one of the
most highly significant categories (fold enrichment=3.5; FDR=
0.007). Thus, the only microRNA that had an experimentally
confirmed physical interaction with RASSF2 had targets
cumulatively involved in RAS signaling and apoptosis (mir-19a/19b belongs to the mir-17-92 cluster).
The second ranking SNP rs23127 (ORinteraction=3.0),
located in the genes PROSER3/HSPB6, yielded a high risk
for males compared with females for childhood ALL (Table 2).
Our analysis suggested that rs23127 might have multiple regulatory functions as it affects the expression level of several
genes (COX6B1;P=2.2106,UPK1A;P=1.2107and
U2AF1LA; P=3.1 x 10⁹) (Supplementary Table 3, http://
links.lww.com/MD/B377) and is also located in an active
promoter region (RegulomeDB=2b; CADD=7.8; DANN=
0.71). Another top ranking SNP, rs798292, is associated
with expression of KAT7 (K(lysine) acetyltransferase 7),
a histone acetyltransferase that represses androgen
receptor-mediated transcription in lymphoblastoid cells[36]
(Supplemen-tary Table 3, http://links.lww.com/MD/B377). Results
ranked by statistical significance showed more eQTLs in
lymphoblastoid cell lines in comparison to the results based on effect size (Supplementary Table 3, http://links.lww.com/ MD/B377).
Table 4
SNPs with sex-specific associations, their meQTL status (for childhood period) and target CpG sites,[37]and the status of DNA methylation in ALL and healthy pre-B cells.[50].
SNP
Target CpG
ID (Gene) Pvalue∗
meQTL effect size (regression
beta value)
ALL mean methylation
pre-B cells mean methylation
DNA methylation status in ALL
Genetic association effect size (odds ratio)
rs4813720† cg22485289 (RASSF2) 8.31023 0.432 0.279 0.764 Hypomethylation 0.30
rs8106959† cg14120049 (HSPB6) 6.61021 0.867 0.651 0.344 Hypermethylation 2.95
rs11708505† cg24363020 (SHQ1) 1.41060 0.591 0.505 0.873 Hypomethylation 0.48
rs7407281† cg11957475 (PMAIP1) 8.41016 0.420 0.883 0.600 Hypermethylation 2.70
rs11011225† cg25427524 5.11015 0.453 ND ND ND .
rs11011225† cg02535924 1.61015 0.472 ND ND ND .
rs719569† cg02535924 1.61089 0.775 ND ND ND .
rs719569† cg25427524 3.71071
0.689 ND ND ND .
rs719569† cg17830980x 3.71039
0.482 ND ND ND .
rs719569† cg00637047 6.91030 0.278 ND ND ND .
rs719569† cg00409905 3.71028 0.406 ND ND ND .
rs719569† cg01217720x 2.31018 0.326 ND ND ND .
rs719569† cg12163508 4.11018 0.362 ND ND ND .
rs719569† cg23533926x 4.71017 0.259 ND ND ND .
rs719569† cg18963800 4.81015 0.326 ND ND ND .
rs719569† cg27523141x 1.71014 0.269 ND ND ND .
rs719569† cg26666804x 3.21014 0.287 ND ND ND .
rs719569† cg20499290 (ZNF33BP1) 4.61017 0.340 0.774 0.394 Hypermethylation 0.48
rs12256543† cg20499290x(ZNF33BP1) 1.21014 0.318 0.774 0.394 Hypermethylation 2.07
rs12256543† cg25427524 4.010112 0.836 ND ND ND .
rs12256543† cg02535924 6.81066 0.692 ND ND ND .
rs12256543† cg17830980x 2.31032 0.446 ND ND ND .
rs12256543† cg00637047 4.91026 0.263 ND ND ND .
rs12256543† cg00409905 1.41024 0.385 ND ND ND .
rs12256543† cg12163508 2.61024 0.427 ND ND ND .
rs12256543† cg01217720x 7.21023 0.370 ND ND ND .
rs12256543† cg23533926x 5.61022 0.299 ND ND ND .
rs12256543† cg18963800 2.31020 0.387 ND ND ND .
rs12256543† cg26666804x 9.51020 0.346 ND ND ND .
rs12256543† cg04469686x 6.51016 0.342 ND ND ND .
rs12256543† cg25373794x 2.11015 0.333 ND ND ND .
rs12256543† cg25951256 3.61014 0.328 ND ND ND .
rs7195089‡ cg05797001 1.11025 0.949 ND ND ND .
rs7195089‡ cg07982935 1.71021 0.864 ND ND ND .
rs7195089‡ cg27232078 (CHST5) 6.11015 0.782 0.851 0.592 Hypermethylation 5.80
rs2233805‡ cg27232078 (CHST5) 1.41015 0.814 0.851 0.592 Hypermethylation 4.77
rs2233805‡ cg05797001 2.11026 0.980 ND ND ND .
rs2233805‡ cg07982935 7.21023 0.908 ND ND ND .
ALL=acute lymphoblastic leukaemia, ND=no data, SNP=single nucleotide polymorphism.
∗
meQTLPvalue (statistical significance threshold51014).[37]
†Sex-specific variants based on statistical significance. ‡Sex-specific variants based on effect size.
Table 3 and Supplementary Table 2 (http://links.lww.com/ MD/B376) show the results based on the highest effect sizes. Two
statistically correlated SNPs (r2=1), rs12722042 (CADD=16.02
and DANN=1) and rs12722039 (CADD=5.02 and DANN=
0.49), from theHLA-DQA1(major histocompatibility complex,
class II, DQ alpha 1) gene and a SNP, rs11992342, from the
ADAM28(ADAM metallopeptidase domain 28) region yielded
the highest effect sizes (ORinteraction > 14; P 0.01) for
sex-specific results. BothHLA-DQA1SNPs were missense variants
and marked by several histone modification marks, such as
Histone-3 lysine-4 monomethylation (H3K4me1), Histone-3 lysine-4 trimethylation (H3K4me3), Histone-3 lysine-9 acetyla-tion (H3K9ac), and Histone-3 lysine-27acetylaacetyla-tion (H3K27ac) indicating the location within an active promoter site. When we examined whether there are crucial TFBSs in the vicinity of these SNPs located at chromosome 6 positions 32,605,284 and 32,605,309 (hg19 coordinates), Swiss Regulon browser indicated that there was an androgen receptor binding site within 100 bp of
these SNPs (32,605,225 to 32,605,2546).ADAM28rs11992342
maps to an active enhancer region, and affects binding affinity of several TFs of STAT family. Top ranking 100 results based on OR included associations with more missense variants than the results
based onPvalues (34 vs 2) (Supplementary Tables 1 and 2, http://
links.lww.com/MD/B375, http://links.lww.com/MD/B376). Our results predicted several of these missense variants may have
deleterious effects on final protein structure (Supplementary
Table 4, http://links.lww.com/MD/B378). Most of the identified
sex-specific SNPs were located in cis-regulatory elements, such as
promoters and enhancers or may have eQTL effects (Supplemen-tary Tables 1 and 2, http://links.lww.com/MD/B375, http://links. lww.com/MD/B376).
Our mQTLdb screening results showed that several variants were meQTLs at birth, during childhood and adolescence, as well as during pregnancy (Supplementary Table 5, http://links.lww. com/MD/B379). We examined the involvement of the CpG sites linked to our GWAS associations in B-cell differentiation and
leukemogenesis by using the data provided by Kuliset al.[50]A
total of 24 variants were reported to be pivotal for B-lymphocyte differentiation and their target CpG sites found to be either hypermethylated or hypomethylated in ALL (Table 4). Most notably, the top ranking SNP rs4813720 is an meQTL for the
CpG island cg22485289 within RASSF2. Both HLA-DQA1
SNPs (rs12722042 and rs12722039) are meQTLs for the CpG
island cg24593918 withinHLA-DQB1.
GWAS3D analysis for the top 100 ranking sets of SNPs unraveled a number of long-range interactions between the regions of SNP locations and other genes, some of which being on different chromosomes (Supplementary Figures 2 and 3, http://links.lww. com/MD/B374). GWAS3D reported 84 variants with TF binding affinity changes or regulatory signals based on the GM12878 cell line and HapMap CEU population for 100 statistically most significant results. A total of 66 variants have been detected affecting long-range interactions (Supplementary Figure 2, http:// links.lww.com/MD/B374). Cumulatively, GWAS3D results sug-gested a potential role for STAT and MYC TFs in sex-differences in childhood ALL risk. Among the top 100 results ranked by the effect size, GWAS3D analysis showed that 68 of the variants were
associated with regulatory signals and TF binding affinity changes
on the GM12878 cell line and HapMap CEU population. Long-range interactions were noted for 60 variants (Supplementary Figure 3, http://links.lww.com/MD/B374).
As shown in Table 5, in all ALL subtypes examined in the
MILE study,RASSF2expression was lower than controls, and Ta
mir-17-92 levels were higher with statistical significance varying
fromP=0.02 to 6.81080. The statistically most significant
change inRASSF2was in T-ALL with the expression ratio to
controls being 0.23 (mir-17-92 showed an expression ratio of
1.71 in T-ALL). The statistically most significant change in
mir-17-92 was in ALL with t(12;21) with the expression ratio to
controls being 3.17 (RASSF2showed an expression ratio of 0.50
in the same ALL subtype). In all subtypes,RASSSF2and
mir-17-92 expression levels showed an inverse correlation (Table 5). The
expression levels ofMYCdid not appear to correlate with
mir-17-92 levels except in pro-B and mature B-ALL subtypes (Table 5).
While the strong inverse correlation betweenRASSF2and
mir-17-92 confirmed the expected relationship between them, the
lack of a correlation betweenMYCand mir-17-92 suggested that
mir-17-92 increase in ALL is not exclusively caused byMYC, but
may be due to genomic amplifications as observed in other
malignancies.[45]
4. Discussion
This is thefirst GWAS designed to identify sex-specific childhood
ALL risk markers. As a second exploratory approach, we also analyzed results based on OR, to examine clinically meaningful
results that may not have reached the strict statistical significance
due to their lower frequencies. These results are free from multiple comparison issues, as each permutation on each SNP assesses the role of chance.
The statistically most significant association was with an
intronic SNP inRASSF2, which is a novel tumor suppressor gene
and a member of the RAS family which regulates a wide range of
biological processes, including KRAS signaling.[46,47]It induces
apoptosis and cell cycle arrest, shows frequent methylation in
several cancers, and rs4813720 correlates withRASSF2
expres-sion levels.[48]RASSF2ablation down regulates genes involved in
the immune response, hematological development, as well as
genes activating nuclear factor (NF)-kB signaling.[46]
RASSF2 has emerged as a candidate gene involved in
sex-specific modification of risk for childhood ALL in the present
study for the first time. This result is biologically plausible.
RASSF2 is a tumor suppressor gene via its inhibitory effect
on the proto-oncogene KRAS.[43]KRAS is one of the most
frequently mutated proto-oncogenes in childhood ALL.[44,49]
The top ranking sex-specific risk marker for childhood ALL,
rs4813720, correlates withRASSF2expression level,[36]as well
as the methylation levels in a key CpG site cg22485289 within the
promoter ofRASSF2at birth and childhood.[37]This particular
CpG site is one of the key sites found to be hypomethylated in
childhood ALL compared with pre-B cells.[50]Thus, rs4813720
appears to be involved in the prevention of childhood ALL in males via maintaining the expression levels of tumor suppressive
RASSF2 in pre-B cells presumably via a methylation-related
mechanism. Linkage of DNA methylation quantitative trait loci
to human cancer risk is already well documented,[48]and our
results represent yet another example.
The sex effect in the prevention of childhood ALL byRASSF2
expression may also be biologically plausible. The key to the sex
effect may be the events upstream ofRASSF2. The miR-17-92
cluster, which is in an amplified genomic region in human
malignant B-cell lymphomas, has been shown to be an
oncomicroRNA also in c-Myc-induced lymphomagenesis in
mice.[51] mir-17-92 also plays a major role in normal B-cell
development.[52,53]In an experimental study,RASSF2has been
found to be a target gene for the mir-92 polycistron.[54] Our
bioinformatics work also confirmed a physical interaction with
one of the micro RNAs that derive from mir-17-92 polycistron, mir-19a/19b, and revealed a predicted binding site for it (see Results). Crucially, estrogen administration increases mir-17-92
levels viaMYCoverexpression[55,56]and downregulatesRASSF2
expression.[57]Thus, in addition to the already known
involve-ment of sex hormones in the gender effect in cancer,[58] we
propose a novel mechanism for childhood ALL: estrogen exposure increases the oncogenic microRNA species mir-19a/
19b levels, which in turn downregulates RASSF2 (as well as
another tumor suppressor PTEN[59]). Downregulation of
RASSF2abolishes KRAS inhibition, and the KRAS oncogene
contributes to childhood ALL development. Males are already less susceptible to this mechanism due to lesser exposure to estrogen, as well as due to the presence of binding sites to Y
chromosome-linked transcription factor SRY,[47]and are further
protected if they possess the minor allele of rs4813720, which
increasesRASSF2expression levels. If experimentally confirmed,
this would be the first demonstration of the mechanism of a
sexually antagonistic association of a SNP with cancer susceptibility. Although sex hormone levels are very low during childhood in both males and females, programming of autosomal gene expression by sex hormones during prenatal development or during the temporary androgen surge in early infancy (called mini-puberty) is a possibility. Mini-puberty is particularly interesting as inter individual variability in sex hormone levels, which may rise to the puberty levels but temporarily, may be very
remarkable.[60,61]Unfortunately, there are no studies on the
long-term effects of these sex hormone exposures in early infancy on biological systems although behavioral studies continue to show
the relevance of this exposure.[60,62]
Having a marker that is associated with prevention for childhood ALL in males has clinical importance. Males develop childhood ALL more frequently, have a higher relapse rate, and
worse prognosis.[4]Due to having clinically more aggressive form
of the disease, they also receive more intensive treatment resulting
in higher toxicity. The marker is withinRASSF2 and acts by
increasing its expression, which in turn, binds to and inactivates
KRAS.KRASis frequently mutated in childhood ALL[44,49]and
mutantKRASworsens the prognosis.[49]Thus, any
pharmaco-logical intervention to increase the expression ofRASSF2should
be beneficial for male patients with childhood ALL, especially for
those withKRASmutations, to counter the deleterious effects of
mutantKRAS.
Examination of associations with the highest odds ratios
identified a pair of HLA region SNPs. TheHLA-DQA1 SNPs
(rs12722042 and rs12722039) belong toDQA1∗01,confirming
the previously reported male-specific association with
DQA1∗01, and supporting the proposed infection-related
etiology in childhood ALL risk for males.[63] Both
HLA-DQA1 SNPs are located in an active promoter region and
showed eQTL effects on theHLA-DQB1gene. These SNPs have
regulatory effects on gene expression rather than on protein
structure. Intriguingly, the HLA-DQA1 SNPs are in close
proximity (<100 bp) of an androgen receptor binding site. This
observation may be relevant in their risk associations with childhood ALL in males. The SNP rs35597309, correlated
statistically with rs12722042 (r2=0.97), has shown a risk
association with esophageal squamous cell carcinoma in a
Chinese population[64](esophageal carcinoma has a high
male-to-female ratio).
The validity of the case-only design depends on the
independence may affect the results. Such an association would be invalid due to the violation of the major assumption of case-only approach. In the case of gender, it seems unlikely to have different genotype frequencies in autosomal chromosomes
between males and females in the healthy population.[65]
Conforming to the assumptions of the case-control design still does not make the results valid until replicated by a second independent study. The lack of a previously observed association of
RASSF2SNPs with childhood ALL does not argue against the
validity of our result. This is most likely due to cancellation of associations in opposite directions in males and females when the analysis is performed on the overall sample. None of the previous childhood ALL GWAS performed sex-specific analyses. Despite the biological plausibility of our results, given the limited sample size of our study and lack of replication, it is important to reexamine these results in an independent study before proceeding to functional studies. These results cannot be generalized in any other ethnic population, as all of these samples were non-Hispanic whites.
In conclusion, our results suggest that novel sex-specific risk
variants for childhood ALL exist. Functional analyses suggest that most variants (either direct effect or through LD) have regulatory effects, which increases the likelihood of causal
associations. For instance, the statistically most significant
association rs4813720 correlates withRASSF2expression and
may play a significant role in childhood ALL etiology. Our results
also confirm the previously observed male-specific association
withDQA1∗01. While ranking results by OR is not a traditional
approach for GWAS, this exploratory approach yielded several missense variants with effects on protein function. The
statisti-cally most significant association was with a SNP within
RASSF2, which interacts withKRAS. Given the difficulties of
developing drugs to inactivateKRASdirectly,[66]the
demonstra-tion of the effect ofRASSF2in prevention from childhood ALL
may even offer a new target for drug development efforts.
Feasibility of countering the downstream effects of mir-17–92 by
pharmacological manipulation has already been shown.[67]
Prenatal programming by sex hormones, if confirmed, may
shed some light on the mechanism of the differential risk with childhood ALL. These preliminary results provide a foundation for further replication and functional studies to examine the genetic basis of sex-differential in childhood ALL risk. Future studies should include functional and genetic replication of the
RASSF2 association, particularly in case series with known
KRASmutation status. Given the well-established involvement
of the oncogenic mir-17-92 in its development and the more exaggerated male predominance, childhood non-Hodgkin
lymphoma should also be examined for RASSF2
associa-tions.[67,68]
References
[1] Howlader N, Noone AM, Krapcho M, et al (eds). SEER Cancer Statistics Review, 1975-2012, National Cancer Institute. Bethesda, MD, Available at: http://seer.cancer.gov/csr/1975_2012/, based on November 2014 SEER data submission, posted to the SEER web site, April 2015 (accessed May 31, 2016).
[2] Spector LG, Pankratz N, Marcotte EL. Genetic and nongenetic risk factors for childhood cancer. Pediatr Clin North Am 2015;62:11–25. [3] Cook MB, Dawsey SM, Freedman ND, et al. Sex disparities in cancer
incidence by period and age. Cancer Epidemiol Biomarkers Prev 2009;18:1174–82.
[4] Dorak MT, Karpuzoglu E. Gender differences in cancer susceptibility: an inadequately addressed issue. Front Appl Genet Epidemiol 2012;3:268. [5] Siegel RL, Miller KD, Jemal A. Cancer statistics, 2016. CA Cancer J Clin
2016;66:7–30.
[6] Mulder RL, Hudson MM, Skinner R, et al. Health problems in survivors of childhood cancer: the need for international collaboration in long-term follow-up care. Future Oncol 2013;9:1667–70.
[7] Randall JC, Winkler TW, Kutalik Z, et al. Sex-stratified Genome-wide Association Studies Including 270,000 Individuals Show Sexual Dimorphism in Genetic Loci for Anthropometric Traits. PLoS Genet 2013;9:e1003500.
[8] Gilks WP, Abbott JK, Morrow EH. Sex differences in disease genetics: evidence, evolution, and detection. Trends Genet 2014;30:453–63. [9] Do TN, Ucisik-Akkaya E, Davis CF, et al. An intronic polymorphism of
IRF4 gene influences gene transcription in vitro and shows a risk association with childhood acute lymphoblastic leukemia in males. Biochim Biophys Acta 2010;1802:292–300.
[10] Morrison BA, Ucisik-Akkaya E, Flores H, et al. Multiple sclerosis risk markers in HLA-DRA, HLA-C, and IFNG genes are associated with sex-specific childhood leukemia risk. Autoimmunity 2010;43:690–7. [11] Kennedy AE, Kamdar KY, Lupo PJ, et al. Genetic markers in a
multi-ethnic sample for childhood acute lymphoblastic leukemia risk. Leuk Lymphoma 2015;56:169–74.
[12] Healy J, Richer C, Bourgey M, et al. Replication analysis confirms the association of ARID5B with childhood B-cell acute lymphoblastic leukemia. Haematologica 2010;95:1608–11.
[13] Wang SL, Zhao H, Zhou B, et al. Polymorphisms in ERCC1 and susceptibility to childhood acute lymphoblastic leukemia in a Chinese population. Leuk Res 2006;30:1341–5.
[14] Xu H, Yang W, Perez-Andreu V, et al. Novel susceptibility variants at 10p12.31-12.2 for childhood acute lymphoblastic leukemia in ethnically diverse populations. J Natl Cancer Inst 2013;105:733–42.
[15] Trevino LR, Yang W, French D, et al. Germline genomic variants associated with childhood acute lymphoblastic leukemia. Nat Genet 2009;41:1001–5.
[16] Papaemmanuil E, Hosking FJ, Vijayakrishnan J, et al. Loci on 7p12.2, 10q21.2 and 14q11.2 are associated with risk of childhood acute lymphoblastic leukemia. Nat Genet 2009;41:1006–10.
[17] Loisel DA, Tan Z, Tisler CJ, et al. IFNG genotype and sex interact to influence the risk of childhood asthma. J Allergy Clin Immunol 2011;128:524–31.
[18] Myers RA, Scott NM, Gauderman WJ, et al. Genome-wide interaction studies reveal sex-specific asthma risk alleles. Hum Mol Genet 2014;23: 5251–9.
[19] Yao C, Joehanes R, Johnson AD, et al. Sex- and age-interacting eQTLs in human complex diseases. Hum Mol Genet 2014;23:1947–56. [20] Dimas AS, Nica AC, Montgomery SB, et al. Sex-biased genetic effects on
gene regulation in humans. Genome Res 2012;22:2368–75.
[21] Jansen R, Batista S, Brooks AI, et al. Sex differences in the human peripheral blood transcriptome. BMC Genom 2014;15:33.
[22] Liu LY, Schaub MA, Sirota M, et al. Sex differences in disease risk from reported genome-wide association studyfindings. Hum Genet 2012;131: 353–64.
[23] Orozco G, Ioannidis JP, Morris A, et al. Sex-specific differences in effect size estimates atestablished complextraitloci.Int JEpidemiol 2012;41:1376–82. [24] Clayton D, McKeigue PM. Epidemiological methods for studying genes and environmental factors in complex diseases. Lancet 2001;358:1356–60. [25] Anderson CA, Pettersson FH, Clarke GM, et al. Data quality control in genetic case-control association studies. Nat Protoc 2010;5:1564–73. [26] Devlin B, Bacanu SA, Roeder K. Genomic control to the extreme. Nat
Genet 2004;36:1129–30.
[27] Wang K, Li M, Hakonarson H. ANNOVAR: functional annotation of genetic variants from high-throughput sequencing data. Nucleic Acids Res 2010;38:e164.
[28] Chelala C, Khan A, Lemoine NR. SNPnexus: a web database for functional annotation of newly discovered and public domain single nucleotide polymorphisms. Bioinformatics 2009;25:655–61.
[29] Kircher M, Witten DM, Jain P, et al. A general framework for estimating the relative pathogenicity of human genetic variants. Nat Genet 2014;46:310–5.
[30] Schaub MA, Boyle AP, Kundaje A, et al. Linking disease associations with regulatory information in the human genome. Genome Res 2012;22:1748–59.
[31] Ward LD, Kellis M. HaploReg v4: systematic mining of putative causal variants, cell types, regulators and target genes for human complex traits and disease. Nucleic Acids Res 2016;44:D877–81.
[32] Arnold M, Raffler J, Pfeufer A, et al. SNiPA: an interactive, genetic variant-centered annotation browser. Bioinformatics 2015;31:1334–6. [33] Guo L, Du Y, Qu S, et al. rVarBase: an updated database for regulatory
[34] Li MJ, Wang LY, Xia Z, et al. GWAS3D: detecting human regulatory variants by integrative analysis of genome-wide associations, chromo-some interactions and histone modifications. Nucleic Acids Res 2013;41: W150–8.
[35] Gamazon ER, Zhang W, Konkashbaev A, et al. SCAN: SNP and copy number annotation. Bioinformatics 2010;26:259–62.
[36] Westra HJ, Peters MJ, Esko T, et al. Systematic identification of trans eQTLs as putative drivers of known disease associations. Nat Genet 2013;45:1238–43.
[37] Gaunt TR, Shihab HA, Hemani G, et al. Systematic identification of genetic influences on methylation across the human life course. Genome Biol 2016;17:61.
[38] Pachkov M, Balwierz PJ, Arnold P, et al. SwissRegulon, a database of genome-wide annotations of regulatory sites: recent updates. Nucleic Acids Res 2013;41:D214–20.
[39] Huang da W, Sherman BT, Lempicki RA. Bioinformatics enrichment tools: paths toward the comprehensive functional analysis of large gene lists. Nucleic Acids Res 2009;37:1–3.
[40] Hao Y, Wu W, Li H, et al. NPInter v3.0: an upgraded database of noncoding RNA-associated interactions. Database (Oxford) 2016;pii: baw2057.
[41] Agarwal V, Bell GW, Nam JW, et al. Predicting effective microRNA target sites in mammalian mRNAs. Elife 2015;4:e05005.
[42] Haferlach T, Kohlmann A, Wieczorek L, et al. Clinical utility of microarray-based gene expression profiling in the diagnosis and subclassification of leukemia: report from the International Microarray Innovations in Leukemia Study Group. J Clin Oncol 2010;28:2529–37. [43] Richter AM, Pfeifer GP, Dammann RH. The RASSF proteins in cancer; from epigenetic silencing to functional characterization. Biochim Biophys Acta 2009;1796:114–28.
[44] Case M, Matheson E, Minto L, et al. Mutation of genes affecting the RAS pathway is common in childhood acute lymphoblastic leukemia. Cancer Res 2008;68:6803–9.
[45] Volinia S, Galasso M, Costinean S, et al. Reprogramming of miRNA networks in cancer and leukemia. Genome Res 2010;20:589–99. [46] Song H, Kim H, Lee K, et al. Ablation of Rassf2 induces bone defects and
subsequent haematopoietic anomalies in mice. EMBO J 2012;31: 1147–59.
[47] Volodko N, Gordon M, Salla M, et al. RASSF tumor suppressor gene family: biological functions and regulation. FEBS Lett 2014;588: 2671–84.
[48] Heyn H, Sayols S, Moutinho C, et al. Linkage of DNA methylation quantitative trait loci to human cancer risk. Cell Rep 2014;7:331–8. [49] Irving J, Matheson E, Minto L, et al. Ras pathway mutations are
prevalent in relapsed childhood acute lymphoblastic leukemia and confer sensitivity to MEK inhibition. Blood 2014;124:3420–30.
[50] Kulis M, Merkel A, Heath S, et al. Whole-genomefingerprint of the DNA methylome during human B cell differentiation. Nat Genet 2015;47: 746–56.
[51] He L, Thomson JM, Hemann MT, et al. A microRNA polycistron as a potential human oncogene. Nature 2005;435:828–33.
[52] Ventura A, Young AG, Winslow MM, et al. Targeted deletion reveals essential and overlapping functions of the miR-17 through 92 family of miRNA clusters. Cell 2008;132:875–86.
[53] Lai M, Gonzalez-Martin A, Cooper AB, et al. Regulation of B-cell development and tolerance by different members of the miR-17∼92 family microRNAs. Nat Commun 2016;7:12207.
[54] Li Z, Luo RT, Mi S, et al. Consistent deregulation of gene expression between human and murine MLL rearrangement leukemias. Cancer Res 2009;69:1109–16.
[55] Castellano L, Giamas G, Jacob J, et al. The estrogen receptor-alpha-induced microRNA signature regulates itself and its transcriptional response. Proc Natl Acad Sci U S A 2009;106:15732–7.
[56] Wang C, Mayer JA, Mazumdar A, et al. Estrogen induces c-myc gene expression via an upstream enhancer activated by the estrogen receptor and the AP-1 transcription factor. Mol Endocrinol 2011;25:1527–38. [57] Ren CE, Zhu X, Li J, et al. Microarray analysis on gene regulation by
estrogen, progesterone and tamoxifen in human endometrial stromal cells. Int J Mol Sci 2015;16:5864–85.
[58] Clocchiatti A, Cora E, Zhang Y, et al. Sexual dimorphism in cancer. Nat Rev Cancer 2016;16:330–9.
[59] Olive V, Bennett MJ, Walker JC, et al. miR-19 is a key oncogenic component of mir-17-92. Genes Dev 2009;23:2839–49.
[60] Alexander GM, Wilcox T, Farmer ME. Hormone-behavior associations in early infancy. Horm Behav 2009;56:498–502.
[61] Tomlinson C, Macintyre H, Dorrian CA, et al. Testosterone measure-ments in early infancy. Arch Dis Child Fetal Neonatal Ed 2004;89: F558–9.
[62] Hines M, Spencer D, Kung KT, et al. The early postnatal period, mini-puberty, provides a window on the role of testosterone in human neurobehavioural development. Curr Opin Neurobiol 2016;38:69–73. [63] Taylor GM, Dearden S, Payne N, et al. Evidence that an HLA-DQA1-DQB1 haplotype influences susceptibility to childhood common acute lymphoblastic leukaemia in boys provides further support for an infection-related aetiology. Br J Cancer 1998;78:561–5.
[64] Kong KL, Kwong DL, Fu L, et al. Characterization of a candidate tumor suppressor gene uroplakin 1A in esophageal squamous cell carcinoma. Cancer Res 2010;70:8832–41.
[65] Boraska V, Jeroncic A, Colonna V, et al. Genome-wide meta-analysis of common variant differences between men and women. Hum Mol Genet 2012;21:4805–15.
[66] McCormick F. K-Ras protein as a drug target. J Mol Med (Berl) 2016;94:253–8.
[67] Jin HY, Lai M, Xiao C. microRNA-17∼92 is a powerful cancer driver and a therapeutic target. Cell Cycle 2014;13:495–6.