Article
Modeling and Simulation of Passenger Flow
Distribution in Urban Rail Transit Hub Platform
Long Gao 1 and Limin Jia 2,3,*
1 School of Traffic and Transportation, Beijing Jiaotong University, Beijing 100044, China;
11114234@bjtu.edu.cn
2 State Key Laboratory of Rail Traffic Control and Safety, Beijing Jiaotong University, Beijing 100044, China 3 Beijing Research Center of Urban Traffic Information Sensing and Service Technologies,
Beijing Jiaotong University, Beijing 100044, China
* Correspondence: lmjia@bjtu.edu.cn; Tel: +86-152-0132-8873
Abstract: Urban rail transit has become the main mode to ease traffic congestion. Researches on the dynamic variation regularity of passenger flow distribution and passenger flow volume of urban rail transit hub platform have important implication in hub capacity design, operation organization and risk prevention. This paper proposes a passenger flow distribution integrating model (PFDIM) based on the basic theory analysis and basic parameter models of passenger flow distribution in hub platform. Simulation designs of PFDIM are built with Java and Anylogic, which contain simulation system functional framework, implementation path, simulation processes and simulation models. By case study, the performance comparison between two simulation methods indicates that simulation designs are scientific and accordant with the reality scene; calculation results prove that PFDIM has a good performance on describing the dynamic variation regularity of passenger flow distribution. Moreover, the experiments with different departure intervals could provide the reference for train scheduling under the viewpoint of traffic safety and service level.
Keywords: passenger flow distribution integrating model; urban rail transit hub platform; simulation and application; performance evaluation; traffic safety and service level
1. Introduction
In recent years, with the rapid development of urban rail transit system, passenger traffic demand has increased quickly and sustainably. Urban rail transit has become the main mode to ease traffic congestion. As we know, urban rail transit hub is the core node of urban rail transit system. For an urban rail transit hub, hub platform is the most important area for passenger flow distribution. Under the viewpoint of traffic safety and service level, researches on the dynamic variation regularity of passenger flow distribution and passenger flow volume of hub platform are very necessary and meaningful. The prospective research findings could provide the reference for train scheduling, hub capacity design and operation management.
Aiming at the researches on modeling, simulation and application of passenger flow distribution in urban rail transit field, domestic and foreign scholars have done mountains of work and achieved abundant findings. Generally, there were two sides to the related researches, one side was the research on modeling and simulation of passenger flow distribution; the other side was the research on application of passenger flow distribution. The purposes of these researches were to improve passenger traffic service quality and reliability.
model was firstly proposed to passenger traffic simulation by Muramatsu et al. [3]. With the rapid development of computer technology, microscopic model was proposed and applied to passenger traffic simulation, which mainly included magnetic model [4], benefit cost cellular model [5], queuing network model [6], social force model [7] and cellular automata model [8,9]. On the other hand, application of passenger flow distribution mainly concerned with passenger traffic system planning, operation organization design, facility performance evaluation, emergency evacuation and so on. Due to the different development stages, major cities of the western developed countries had reached an advanced level, such as New York, Berlin, Copenhagen and London [10,11].
With respect to transit hub distribution efficiency and passenger behavior analysis, passenger individual behavior model was firstly set up by Gipps et al. [5], they supposed that passenger movement obeyed the short circuit law, and put forward a simple route choice model. Helbing [12] illustrated the complex characteristics of passenger flow, and built social force model. Xiong. H. et al. [13] proposed a continuous-time random walk model for pedestrian flow walking behavior simulation. Lu. L. L. et al. [14] explored the effects of different walking strategies on bi-directional pedestrian flow in the channel with cellular-automata formulation. Daamen et al. [15,16] summed up that passenger flow crowd degree in hub interlayer facility as the key factor directly affected route choice behavior by analyzing the relations between interlayer facility layout and passenger path-finding behavior. Lin. Y. D. et al. [17] analyzed passenger flow characteristics inside of the hub, and identified passenger flow distribution bottleneck. Similarly, scholars researched on the passenger flow through corridor bottlenecks, experiments results showed that the bottleneck capacity was almost linearly increased with the width, and jamming occurred below the maximum capacity [18,19,20]. In recent researches, Duive et al. [21] proposed the state-of-the-art crowd motion simulation models to explain the different phenomena of crowd motion such as lane formation, stop-and-go waves, faster-is-slower effect, turbulence and zipper effect. Guillermo H. G. [22] built a mathematical model of the formation of lanes in crowds of pedestrians moving in opposite directions. Bandini et al. [23] improved the traditional floor field cellular automata model to simulate the negative interaction among pedestrians of high density. Xie. Z. Y. and Wang. S. W. et al. proposed the forecasting methods of passenger flow based on hybrid temporal-spatio forecasting model and modular neural network [24,25]. In addition, Gao. L. et al. proposed the distribution service network model of comprehensive passenger transport hub, simulation results showed that research findings were of practical significance in performance evaluation of passenger flow distribution [26,27]. Wang. S. W. [28] also built the transit station congestion index based on pedestrian simulation and gray clustering evaluation, which could reflect the congestion degree of transit stations.
Especially, aiming at the researches on passenger flow distribution in the platform, Seriani et al. [29] researched on the pedestrian traffic management of boarding and alighting in metro stations, and obtained the criteria for pedestrian traffic management in platform and metro doors by means of pedestrian traffic micro-simulator and laboratory experiments, results which were expressed in service level, service time, passenger density of platform and vehicle could give some references for pedestrian traffic management in metro systems. Wang. G. and Gao. S. S. proposed the calculation method of passenger flow volume in transit platform [30,31]. What’s more, some studies were related with passenger dwell time. Schelenz et al. [32,33,34] proposed an agent-based simulation method to calculate passenger dwell time and analyze passenger preferences with different vehicle layout designs, case results proved that the number of vehicle doors had the direct effect on passenger dwell time.
model of the hub platform is built. In section 3, simulation designs of passenger flow distribution integrating model are built by using Java and Anylogic. In section 4, practical investigation, case study and results analysis are carried out. At last, the conclusion is summarized and the direction of future research is illustrated.
2. Passenger Flow Distribution Models 2.1. Basic Theory
2.1.1. Passenger Flow Classification
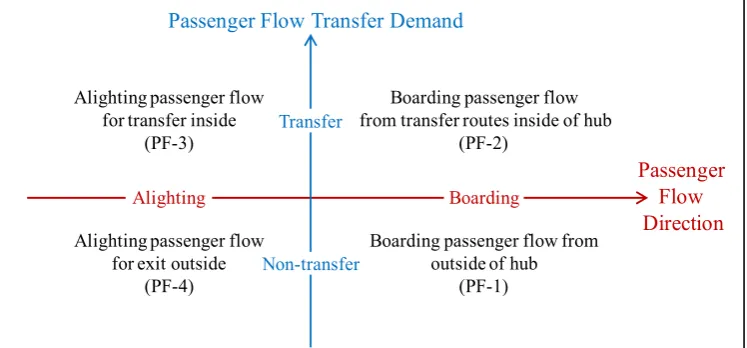
In urban rail transit hub platform, passenger flow can be divided into boarding passenger flow and alighting passenger flow according to passenger flow direction; what’s more, it also can be divided into transfer passenger flow and non-transfer passenger flow according to passenger flow transfer demand. Passenger flow classification is shown in Figure 1. PF-i is the simplified symbol to the corresponding passenger flow, i=1,2,3,4.
Figure 1. Passenger flow classification in hub platform
2.1.2. Passenger Flow Distribution Process
In urban rail transit hub platform, passenger flow distribution process refers to traffic behaviors of passenger group dynamics influenced by platform facilities and train scheduling. Passenger flow distribution morphology is regularly changed with train departure interval. Passenger flow distribution process is shown in the following figures.
Figure 2. Passenger flow distribution process in hub platform
Figure 3. Distribution process of PF-1 in hub platform
Passenger Flow Direction
Passenger Flow Transfer Demand
Boarding Alighting
Transfer
Non-transfer
Boarding passenger flow from transfer routes inside of hub
(PF-2)
Boarding passenger flow from outside of hub
(PF-1) Alighting passenger flow
for transfer inside (PF-3)
Alighting passenger flow for exit outside
(PF-4)
Hub
Platform
Train
Arrive
Get on
Get off
Leave
Figure 4. Distribution process of PF-2 in hub platform
Figure 5. Distribution process of PF-3 in hub platform
Figure 6. Distribution process of PF-4 in hub platform
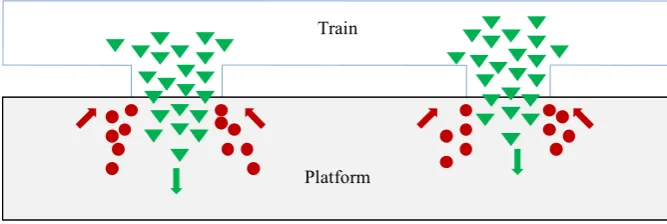
What’s more, passenger flow distribution process presents obvious phases during one departure interval. Especially after the train door opening, the process of passenger getting on or off the train can be divided into three phases, which are shown in the following figures.
Figure 7. Alighting phase of passenger flow (phase 1)
Figure 8. Mixed phase of boarding and alighting (phase 2)
Figure 9. Boarding phase of passenger flow (phase 3)
Transfer
routes
Platform
Train
Arrive
Get on
Train
Platform
Transfer
routes
Get off
Leave
Train
Get off
Platform
Leave
Exit
Train
Platform
Train
Platform
Train
2.1.3. Influence Factors of Passenger Flow Distribution
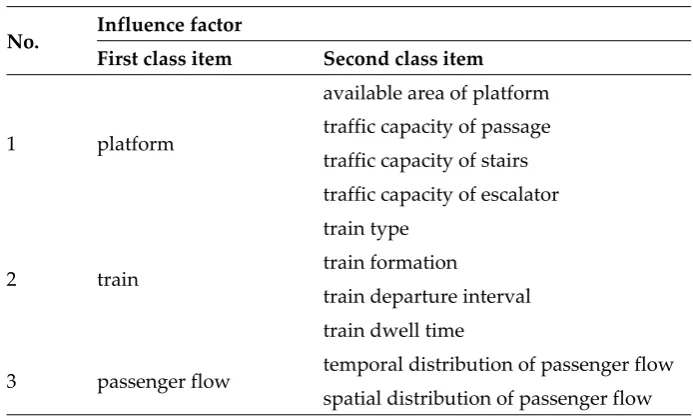
Based on the relationship between interaction agents, influence factors of passenger flow distribution are derived from three parts, which are platform, train and passenger flow, as follows in Table 1.
Table 1. Influence factors of passenger flow distribution
No. Influence factor
First class item Second class item
1 platform
available area of platform
traffic capacity of passage
traffic capacity of stairs
traffic capacity of escalator
2 train
train type
train formation
train departure interval
train dwell time
3 passenger flow temporal distribution of passenger flow
spatial distribution of passenger flow
2.1.4. Definition of This Research
In this research, the following four basic definitions are proposed.
(1) One departure interval is defined as the research period, which refers to a time interval between the departure time of adjacent trains in same direction.
(2) Passenger flow distribution morphology is defined as the research object.
(3) In one departure interval, it is assumed that all the boarding passenger flow in platform can get on the train, and all the alighting passenger flow can leave the platform.
(4) Because of the same target attribute to PF-3 and PF-4 which is to leave the platform, PF-3 and PF-4 are combined as the alighting passenger flow (PF-5) for this research.
2.2. Basic Parameter Models
In this paper, island-type platform is selected for this research which has the most widely applied among the typically types of urban rail transit hub platform in reality. Basic parameter models of passenger flow in island-type platform are built as follows, moreover, “+” and “-” refer to the uplink and downlink respectively.
2.2.1. Basic Parameter Model of PF-1
As a general rule, the temporal distribution of PF-1 arriving at hub entrance shows the stochastic distribution. Then, because the traffic capacity of ticket turnstile and security instrument has a strict restriction on the influx rate of PF-1 in hub entrance, so the temporal distribution of PF-1 arriving at hub platform shows the uniform distribution, no matter in rush hours or not.
(1) the average flow rate of arriving at hub platform (AFR1)
0 0
0 0 0
0
Q v
T Q v
T
+ +
− −
=
=
Where, AFR1 refers to the average flow rate of arriving at hub platform for PF-1; v0+ and v0− refer
to AFR1 of uplink PF-1 and AFR1 of downlink PF-1 respectively in period T0, p/s; Q0
+
and Q0
−
refer to the passenger flow volume of uplink PF-1 and the passenger flow volume of downlink PF-1 respectively in period T0, p; T0 refers to the research time period, usually a rush hour, 3600s.
(2) the average flow rate of getting on the train (AFR1’)
1 1 1 1 1 1 q v t q v t + + + − − − = = (2) Where: 1 0 1 0
q v t q v t
+ + + − − − = ⋅ Δ = ⋅ Δ (3) So: 0 1 0 1 0 1 0 1 Q t v T t Q t v T t + + + + − − − − = ⋅ Δ ⋅ ⋅ Δ = ⋅ (4)
Where, AFR1’ refers to the average flow rate of getting on the train for PF-1; v1
+
and v1
−
refer to AFR1’ of uplink PF-1 and AFR1’ of downlink PF-1 respectively, p/s; q1+ and q1− refer to the
number of boarding passengers of uplink PF-1 in period t1+ and the number of boarding
passengers of downlink PF-1 in period t1− respectively, p; t1+ and t1− refer to the boarding time of
uplink PF-1 and the boarding time of downlink PF-1 respectively, s; Δt+ and Δt− refer to one departure interval of uplink train and one departure interval of downlink train respectively, s. Because Δ >t+ t1+ and Δ >t− t1−,so,v1+>v0+ and v1−>v0−.
2.2.2. Basic Parameter Model of PF-2
In this paper, walking time of PF-2 is defined as the period in which transfer passenger arrives at hub platform from other routes inside of hub. Based on the study, the walking time distribution of PF-2 shows the uniform distribution, i.e. [min,max]
k k k
t U t t . Moreover, the temporal distribution of PF-2 arriving at hub platform shows the impulse type discrete distribution, which is influenced by the train departure interval of other transfer routes.
(1) the average flow rate of arriving at hub platform (AFR2)
2 1 2 1 k k k k k k k k q v t t q v t t + + + + − − − − = − = − (5) Where: k k k k k k Q q N Q q N + + − − = = (6) 1 2 min max k k k k k k t t t t t t
1 2 min max k k k k k k t t t t t t
− − − − = + = + (8) 0 0 0 1 1 ( ) k
k k k k
T T
N T
t+ t− t+ t−
= + = ⋅ +
Δ Δ Δ Δ (9)
So:
0 max min
0 max min
1 1 ( ) ( ) 1 1 ( ) ( ) k k k k k k k k k k k k Q v
T t t
t t Q v
T t t
t t + + + − − − + − = ⋅ + ⋅ − Δ Δ = ⋅ + ⋅ − Δ Δ (10)
Where, AFR2 refers to the average flow rate of arriving at hub platform of PF-2; k refers to the transfer route No. inside of hub; vk+ and vk− refer to AFR2 of uplink PF-2 from route k and AFR2
of downlink PF-2 from route k respectively, p/s; qk+ and qk− refer to the number of uplink PF-2
and the number of downlink PF-2 respectively in one departure interval, p; tk+1 and
1 k
t− refer to the
time when the first passenger of uplink PF-2 arriving at hub platform and the time when the first passenger of downlink PF-2 arriving at hub platform respectively, s; tk+2 and tk2
− refer to the time
when the last passenger of uplink PF-2 arriving at hub platform and the time when the last passenger of downlink PF-2 arriving at hub platform respectively, s; tk+ and tk− refer to the
alighting time of uplink PF-2 and the alighting time of downlink PF-2 respectively in route k, s;
min
k
t and max
k
t refer to the minimum walk time of PF-2 and the maximum walk time of PF-2
respectively, s; Qk
+
and Qk
−
refer to the passenger flow volume of uplink PF-2 and the passenger flow volume of downlink PF-2 respectively in period T0, p; Δtk+ and Δtk− refer to one departure
interval of uplink train and one departure interval of downlink train respectively in route k, s. Nk
refers to the number of departure times of route k in period T0.
(2) the average flow rate of getting on the train (AFR2’)
2 2 1 2 2 1 q v t q v t + + + − − − = = (11) Where: 2 2 k k q v t q v t
+ + + − − − = ⋅ Δ = ⋅ Δ (12) So: 2
0 max min 1
2
0 max min 1
1 1 ( ) ( ) 1 1 ( ) ( ) k k k k k k k k k k Q t v
T t t t
t t Q t v
T t t t
t t + + + + + − − − − − + − = ⋅ Δ ⋅ + ⋅ − ⋅ Δ Δ ⋅ Δ = ⋅ + ⋅ − ⋅ Δ Δ (13)
Where, AFR2’ refers to the average flow rate of getting on the train for PF-2; v2+ and v2− refer to
AFR2’ of uplink PF-2 and AFR2’ of downlink PF-2 respectively, p/s; q2
+
and q2
−
refer to the
number of boarding passengers of uplink PF-2 in period t1+ and the number of boarding
2.2.3. Basic Parameter Model of PF-5
(1) the average flow rate of arriving at hub platform (AFR3)
3 3 3 3 3 3 q v t q v t + + + − − − = = (14) Where: 3 3 3 3 3 3 Q q N Q q N + + + − − − = = (15) 0 3 0 3 T N t T N t + + − − = Δ = Δ (16) So: 3 3 0 3 3 3 0 3 Q t v T t Q t v T t + + + + − − − − = ⋅ Δ ⋅ ⋅ Δ = ⋅ (17)
Where, AFR3 refers to the average flow rate of arriving at hub platform for PF-5; v3+ and v3− refer
to AFR3 of uplink PF-5 and AFR3 of downlink PF-5 respectively in period T0, p/s; q3+ and q3−
refer to the passenger flow volume of uplink PF-5 in period t3+ and the passenger flow volume of
downlink PF-5 in period t3− respectively, p. Q0+ and Q0− refer to the passenger flow volume of
uplink PF-5 and the passenger flow volume of downlink PF-5 respectively in period T0, p; t3+ and
3
t− refer to the alighting time of uplink PF-5 and the alighting time of downlink PF-5 respectively, s;
3
N+ and
3
N− refer to the number of uplink train departure times and the number of uplink train
departure times respectively in period T0.
(2) the average flow rate of leaving the platform (AFR3’)
3 4 4 3 4 4 q v t q v t + + + − − − = = (18) Where: 3 4 0 4 3 4 0 4 Q t v T t Q t v T t + + + + − − − − = ⋅ Δ ⋅ ⋅ Δ = ⋅ (19)
Where, AFR3’ refers to the average flow rate of leaving the platform for PF-5; v4
+
and v4
−
refer to AFR3’ of uplink PF-5 and AFR3’ of downlink PF-5 respectively in period T0, p/s; t4+ and t4− refer
to the walk time of leaving the platform of uplink PF-5 and the walk time of leaving the platform of downlink PF-5, s.
Because t4 t3
+> +
and t4 t3
−> −,
so,v3+>v4+
and v3 v4
−> −
. What’s more, the traffic capacity of
interlayer facility in platform has a strict restriction on AFR3’. In general case, v4+ >v0+ and
4 0 v−>v−
2.3. Passenger Flow Distribution Models
Based on the above research, it is concluded that passenger flow distribution morphology of urban rail transit hub platform is regularly changed with the train departure interval. Therefore, the sub-objectives of building passenger flow distribution models of urban rail transit hub platform are as follows.
(1) Setting up the change rule of passenger flow distribution of hub platform in one period. (2) Calculating the maximum passenger flow volume and passenger flow intensity value gathered in hub platform.
(3) Summarizing the dynamic loads of hub platform facilities, and then analyzing the service level of hub platform.
In hub platform, no matter to uplink train or downlink train, one departure interval Δt is defined as the research period, which refers to a time interval between the departure time of adjacent trains in same direction, i.e. t∈[ , + ]t t0 0 Δt .
2.3.1. Passenger Flow Distribution Model of PF-1
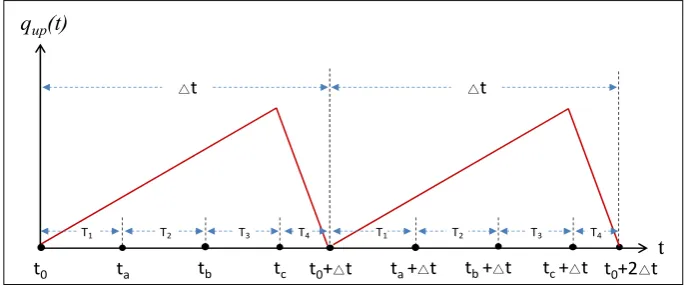
In hub platform, during one departure interval, passenger flow distribution model of PF-1 can be divided into four phases, as shown in Figure 10.
Figure 10. Variation curve of passenger flow volume of PF-1 in hub platform
Where, Δt refers to one departure interval, s; t0 refers to the time when the prior train leaves
hub platform, s; ta refers to the time when PF-5 from the prior train completely leave the hub
platform, s; tb refers to the time when the current train door opens, s; tc refers to the time when
PF-1 begin to get on the train, s; t0+Δt refers to the time when the current train leaves the hub
platform, s; Ti refers to the duration of phase i, i=1,2,3,4, s.
During one departure interval, passenger flow volume of PF-1 in hub platform is shown as follows.
0 0 0
+ 0 1 0
- - - - -0 0
- 0
- - -- - -
-0 1 0
( ) [ ,
( )
[ , ]
- ( + - )
( ) [ ,
( )
[ , ]
- ( + - )
c c
up
c c
c c
up
c c
v t t t t t
q t
t t t t v t t t
v t t t t t
q t
t t t t v t t t
+ + + + +
+
+ +
+ + + +
⋅ − ∈
=
∈ + Δ
⋅ Δ
⋅ − ∈
=
⋅ Δ ∈ + Δ
)
) (20)
Where, q tup( )+ and q tup( )- refer to the passenger flow volume of uplink PF-1 and downlink PF-1
in hub platform respectively, p.
2.3.2. Passenger Flow Distribution Model of PF-2
During one departure interval, passenger flow volume of PF-2 in hub platform is shown as follows.
t0
t qup(t)
ta tb tc t0+△t ta+△t tb+△t tc+△t t0+2△t
△t △t
0 0
0 0
+
0 2 0 0
-0 2 0 0
( ) ( ) + ( ) - ( ) [ , + ]
( ) ( ) + ( ) - ( ) [ , + ]
t t
k k
transfer transfer t k t
t t
k k
transfer transfer t k t
q t q t f t dt f t dt t t t t
q t q t f t dt f t dt t t t t
+ + − − + + + + + + + − − − − − − − = ∈ Δ = ∈ Δ
, , (21) And:{
}
{
}
1 2 1 2 1 2 1 2 + 0 0 - -- - - -0 0 [ , ] ( )=0 [ , ) ( , ]
[ , ] ( )=
0 [ , ) ( , ]
k k k k k k k k k k k k
t t t
v f t
t t t t t t
t t t
v f t
t t t t t t
+ + + + + + + + − − ∈ ∈ ∪ + Δ ∈ ∈ ∪ + Δ (22) + 0 2 2 0 -0 2 2 0 [ , ] ( )= [ , ) 0 [ , ] ( )= [ , ) 0 c c c c
t t t t
v f t
t t t
t t t t
v f t
t t t
+ + + + + + − − − − − − ∈ + Δ ∈ ∈ + Δ ∈ (23)
Where, qtransferk ( )t + refers to the platform passenger flow volume of uplink PF-2 from transfer route
k at time t, p; k ( )
transfer
q t − refers to the platform passenger flow volume of downlink PF-2 from
transfer route k at time t, p;
0
( )
t k
t+ f t dt
+
refers to the platform passenger flow cumulative volume ofuplink PF-2 from transfer route k from t0
+
to t, p;
0
( )
t k
t− f t dt
−
refers to the platform passenger flowcumulative volume of downlink PF-2 from transfer route k from t0− to t, p; 0 2
( )
t
t+ f t dt
+
refers tothe cumulative volume of boarding passenger flow among uplink PF-2 from transfer route k from
0
t+ to t , p;
0 2
( )
t
t− f t dt
−
refers to the cumulative volume of boarding passenger flow amongdownlink PF-2 from transfer route k from t0− to t, p. Based on the definition in section 2.1.4,
0 0
( ) ( ) 0
k k
transfer transfer
q t+ +=q t− −= .
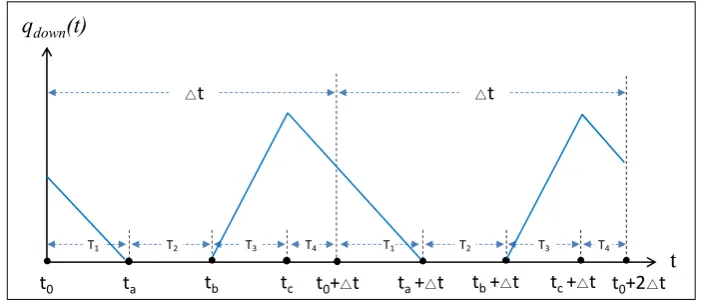
2.3.3. Passenger Flow Distribution Model of PF-5
As similar with section 2.3.1, during one departure interval, passenger flow distribution model of PF-5 also can be divided into four phases, as shown in Figure 11.
Figure 11. Variation curve of passenger flow volume of PF-5 in hub platform
t0 ta tb tc t0+△t ta+△t tb+△t tc+△t t0+2△t
△t △t
T1 T2 T3 T4 T1 T2 T3 T4
t
During one departure interval, passenger flow volume of PF-5 in hub platform is shown as follows. 0 4 0 3 +
4 0 0
0 4 0 -3 4 0 [ , ] ( )
0 [ , ]
( )
( ) [ , ]
( ) [ , ]
[ , ]
( )
0 [ , ]
( ) ( ) [ ( ) a a a b down
c b b c
c c a a a b down c b c
t t t
v t t
t t t
q t
v t t t t t
v t t t t t t t
t t t
v t t
t t t
q t
v t t t t
v t t t
+ + + + + + + + + + + + + + + + + + + − − − − − − − − − − − − − − − ⋅ − ∈ ∈ = ⋅ − ∈ − ⋅ + Δ − ∈ + Δ − ⋅ − ∈ ∈ = ⋅ − ∈ − ⋅ + Δ −
0
-, ]
[ , ]
b c
c
t
t t t t
− − − − ∈ + Δ (24)
Where, qdown( )t
+
and qdown( )t -refer to the platform passenger flow volume of uplink PF-5 and
downlink PF-5 at time t respectively, p.
2.3.4. Passenger Flow Distribution Integrating Model of Hub Platform
Based on the above research, passenger flow distribution integrating model of hub platform is proposed by using the superposition principle for passenger flow. That means, during one departure interval, passenger flow volume in hub platform is shown as follows.
0 0
( )= ( ) ( ) , [ , ]
Q t Q t ++Q t − t∈ t t + Δt (25)
And: + 0 0 1 0 0 1 ( ) ( ) + ( ) + ( ) , [ , + ] ( ) ( ) + ( ) + ( ) , [ , + ] k k
up transfer down
k k
up transfer down
Q t q t q t q t t t t t
Q t q t q t q t t t t t
+ + + + + + − − − − − − − = ∈ Δ = ∈ Δ
(26)Where, Q t( ) refers to the passenger flow volume in hub platform at time t, p; Q t( )+ and Q t( )−
refer to the uplink passenger flow volume and the down passenger flow volume in hub platform at time t respectively, p.
3. Simulation Design
In this chapter, based on the passenger flow distribution models of hub platform, functional framework and simulation process of simulation system are designed by Java 8.0. On the other hand, passenger flow distribution simulation environment of hub platform is built by using Anylogic 7.2.0. Simulation design research in this chapter can provide technical approaches for the case study and model performance verification following.
3.1. Simulation Design by Java
3.1.1. Simulation process
Figure 12. Simulation process of simulation system
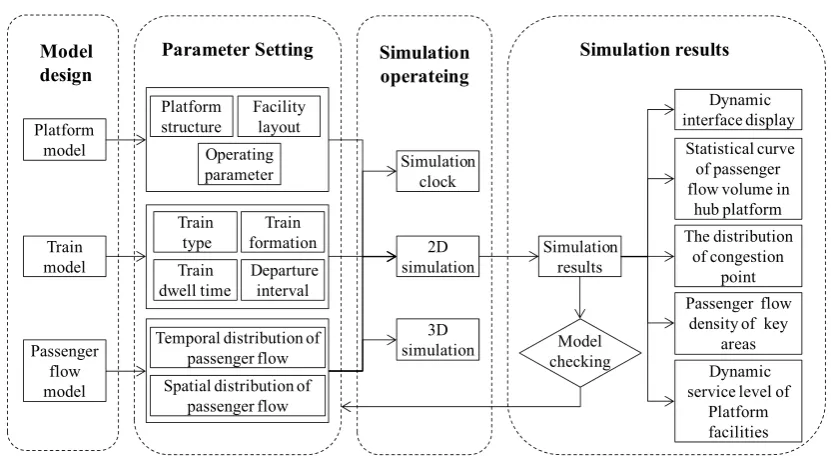
3.1.2. Functional framework and implementation path
In this section, functional framework and implementation path of simulation system are designed by Java 8.0., as shown in Figure 13.
Figure 13. Functional framework and implementation path of simulation system
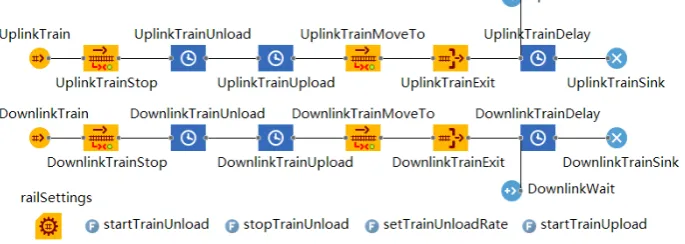
3.2. Simulation Design by Anylogic
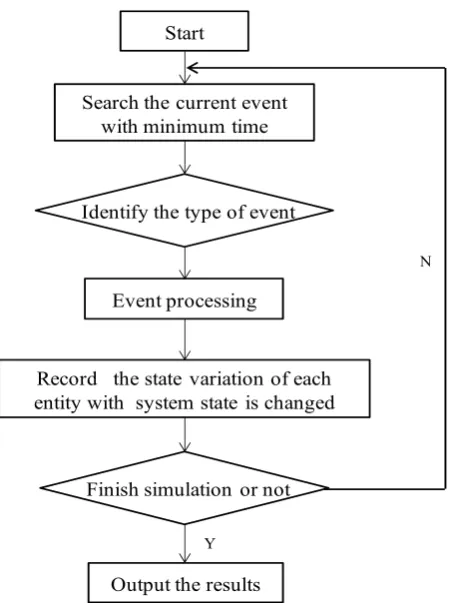
Anylogic software is a professional simulation environment for virtual prototyping based on UML-RT, Java and differential equation. It is efficiently used for the simulation of complex systems which contain discrete system, continuous system and hybrid system [35]. So far, Anylogic is widely applied to the dynamic simulation in traffic and transportation. In this paper, pedestrian library and rail library in Anylogic are adopted to set up the simulation environment of passenger flow distribution of hub platform. Simulation process of Anylogic is shown in Figure 14.
Start
Search the current event with minimum time
Identify the type of event
Event processing
Record the state variation of each entity with system state is changed
Finish simulation or not
Output the results Y
N
Check parameter Start
Input parameter Set parameter
Error
Simulation
Simulation drawing
Simulation results
Save Access to the results
Finish
Module for setting parameter
Module for model simulation
Module for simulation results
Figure 14. Simulation process of Anylogic
3.2.1. Platform Model
Based on the parameters of platform structure and facility layout, simulation model of platform is built by using Anylogic, which is shown in Figure 15.
Figure 15. Simulation model of platform by Anylogic
3.2.2. Train Model
The rail library is a functional module which supports modeling and simulation of various urban rail vehicles, and visual operation. In this paper, the rail library is adopted to set up the simulation model of urban rail vehicle, which is shown in Figure 16.
Figure 16. Simulation model of urban rail vehicle by Anylogic
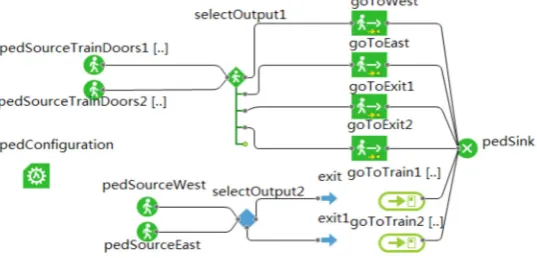
3.2.3. Passenger Flow Model
The pedestrian library is used to set up passenger flow model in the physical space and accurately simulate the traffic behavior of passenger which core algorithm is social force model.
Train model Platform
model
Model design
Passenger flow model
Facility layout Platform
structure
Train type
Operating parameter
Train formation Departure
interval Train
dwell time
Temporal distribution of passenger flow Spatial distribution of
passenger flow
2D simulation
3D simulation Simulation
clock
Simulation results
Passenger flow density of key
areas Statistical curve
of passenger flow volume in
hub platform Dynamic interface display
Model checking
Parameter Setting Simulation operateing
Simulation results
The distribution of congestion
point
Dynamic service level of
And in general, the walking speed value of passenger flow is set as 1.0-1.5m/s. In this paper, the pedestrian library is adopted to set up the simulation model of passenger flow distribution in hub platform, which is shown in Figure 17.
Figure 17. Simulation model of passenger flow distribution in hub platform by Anylogic
4. Case Study and Results Analysis
As an urban rail transit hub station, Beijing South Subway Station is located in the first floor underground of Beijing South Railway Station, which contains Beijing subway line 4 and line 14. Passenger can transfer among the different traffic modes such as high-speed railway, urban rail transit and urban public bus. The structure schematic of Beijing South Subway Station is shown in Figure 18.
Figure 18. The structure schematic of Beijing South Subway Station
In Figure 18, subway hall is located in the first floor underground; the platform of subway line 4 is located in the second floor underground; the platform of subway line 14 is located in the third floor underground. In this paper, the platform of subway line 4 is selected as the hub platform for research, meanwhile, the passenger flow in the platform of subway line 4 is selected as the research object.
4.1. Data Collection and Analysis
Table 2. The practical investigation data of Beijing South Subway Station
Item Detail
location of practical investigation the platform of subway line 4 in Beijing South
Subway Station
uplink direction of subway line 4 to Anheqiao North Station
downlink direction of subway line 4 to Tiangongyuan Station
dates of practical investigation June 6-8, 2016
peak hour of practical investigation 07:30-08:30
data contents of practical investigation
platform facilities data of subway line 4 train data of subway line 4
passenger flow data
By means of practical investigation and data processing, parameters values of the platform facilities data are listed in Table 3; parameters values of the train data of subway line 4 are listed in Table 4; parameters values of the passenger flow distribution integrating model for case study are calculated and listed in Table 5.
Table 3. Parameters values of the platform facilities data
Item Value Unit
available length of platform 115 m
available width of platform 17 m
available length of escalator 15.5 m
available width of escalator 1 m
the number of escalator 4 -
available length of stairs 15.5 m
available width of stairs 2.5 m
the number of stairs 2 -
available area of platform 1650 m2
Table 4. Parameters values of the train data of subway line 4
Item Value Unit
train type type B -
train formation 6 -
train length 115 m
train width 2.8 m
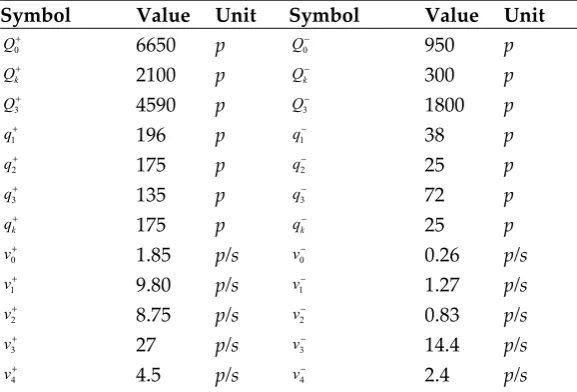
Table 5. Parameters values of the passenger flow distribution integrating model
Symbol Value Unit Symbol Value Unit
0
Q+
6650 p Q0− 950 p
k Q+
2100 p Qk− 300 p
3
Q+
4590 p Q3− 1800 p
1
q+
196 p q1− 38 p
2
q+
175 p q2− 25 p
3
q+
135 p q3− 72 p
k q+
175 p qk− 25 p
0
v+
1.85 p/s v0− 0.26 p/s
1
v+
9.80 p/s v1− 1.27 p/s
2
v+
8.75 p/s v2− 0.83 p/s
3
v+
27 p/s v3− 14.4 p/s
4
v+
k v+
8.75 p/s vk− 1.25 p/s
1
t+
20 s t1− 30 s
3
t+
5 s t3− 5 s
4
t+
30 s t4− 30 s
min
k
t 120 s tmaxk
140 s
t+
Δ 103 s Δt−
140 s
k t+
Δ 300 s Δtk− 300 s
1 a 0
T+= −t+ t+
30 s T1−= −ta− t0− 30 s
2 b a T+= −t+ t+
48 s T2−= −tb− ta− 75 s
3 c b T+= −t+ t+
5 s T3−= −tc− tb− 5 s
4 0 c
T+= + Δ −t+ t+ t+
20 s T4−= + Δ −t0− t− tc− 30 s
3
N+
34 - N3− 25 -
0
T 3600 s
4.2. Simulation Models
Based on the practical investigation data of Beijing South Subway Station in Table 2 and the parameters values in Table 3,4,5, the simulation models by Anylogic for case study are built, as shown in the following Figures.
Firstly, the simulation model of platform is built according to parameters values of the platform facilities data in Table 2,3, and then the scale of this simulation model is defined as 10.5 pixels per meter. Simulation model of the subway line 4 platform in Beijing South Subway Station is shown in Figure 19.
Figure 19. Simulation model of the subway line 4 platform in Beijing South Subway Station
Secondly, simulation model of the subway line 4 train is built according to parameters values in table 4,5, as shown in Figure 20.
Figure 20. Simulation model of the subway line 4 train in Beijing South Subway Station
Figure 21. Simulation model of the subway line 4 platform in Beijing South Subway Station
What’s more, The schematic diagrams of simulation interface display are shown in the following Figures.
Figure 22. Schematic diagram of simulation interface display without density map showing
Figure 23. Schematic diagram of simulation interface display with density map showing
4.3. Calculation Results
4.3.1. Model Performance Experiment
Figure 24. Statistical curve of passenger flow volume in the hub platform by Java 8.0
Figure 25. Statistical curve of passenger flow volume in the hub platform by Anylogic 7.2.0
Then, by using contrastive analysis based on the calculation results in Figure 24, 25, more results could be obtained, as shown in Table 6.
Table 6. Parameters values of the train data of subway line 4
Item Calculation result
Calculating by Java Calculating by Anylogic
maximum value of passenger flow
volume 645p 664p
average density 0.39p/m2 0.40p/m2
average error 2.86%
By the model performance experiment, some conclusions are summarized as follows.
(2) From the above calculation results, it is shown that simulation designs by Java and Anylogic for passenger flow distribution models which are built in chapter 3 are scientific and accordant with the reality scene.
(3) The average error between two simulation methods is 2.86%, it is indicated that the simulation precision is comparatively ideal.
(4) The average density of passenger flow in the hub platform is less than 0.40p/m2, it is indicated that the service level of hub platform is reliable.
4.3.2. More Experiments with Different Departure Intervals
In this section, more experiments are taken with different departure intervals of subway line 4 in Beijing South Subway Station. Calculation results of passenger flow volume in the hub platform are shown in Table 7 and Figure 26.
Table 7. Calculation results of maximum passenger flow volume with different departure intervals of subway line 4
Departure interval of subway line 4 (Δt: s)
Time lag between uplink line and downlink line (Δt+- Δt− : s)
0 10 20 30 40 50 60
90 637 625 610 598 624 643 675
120 765 730 708 685 710 742 758
150 874 793 772 743 765 815 876
180 937 882 855 812 848 887 943
210 1082 975 961 930 970 998 1136
240 1235 1150 1085 1032 1078 1123 1218
Figure 26. Statistical curve of maximum passenger flow volume with different departure intervals of subway line 4
From Table 7 and Figure 26, it is shown that the minimum value among the calculation results is 598, as Δt=90 and Δt+- =30Δt− .
637 625
610 598 624 643
675 765
730 708
685 710
742 758
874
793
772
743 765
815
876 937
882
855
812 848
887
943 1082
975 961
930 970
998
1136 1235
1150
1085
1032
1078
1123
1218
500 600 700 800 900 1000 1100 1200 1300
0 10 20 30 40 50 60
△t=90s
△t=120s
△t=150s
△t=180s
△t=210s
△t=240s
5. Conclusion
For an urban rail transit hub, hub platform is the most important area of passenger flow distribution. Passenger flow volume of hub platform has become a fundamental and crucial data for hub capacity design, operation organization and management. In this paper, in order to research the dynamic variation regularity of passenger flow distribution and calculate the passenger flow volume of hub platform, some studies are carried out and some conclusions are obtained as follows. First, on the basis of basic theory analysis and basic parameter models, passenger flow distribution integrating model is proposed by using the superposition principle of passenger flow. And then, simulation designs of the passenger flow distribution integrating model are built by using Java 8.0 and Anylogic 7.2.0, which contain simulation system functional framework, implementation path, simulation processes and simulation models.
Second, this paper selects the platform of subway line 4 in Beijing South Subway Station as case study. By means of practical investigation and data processing, parameters values of simulation models are listed. Next, by the model performance experiment, it is proved that passenger flow distribution integrating model has a good performance on describing the dynamic variation regularity of passenger flow distribution. The average error between two simulation methods is 2.86%, which indicates that the simulation precision is comparatively ideal, and simulation designs are scientific and accordant with the reality scene. The average density of passenger flow is less than 0.40p/m2, which indicates that the service level of hub platform is reliable.
Third, more experiments are taken with different departure intervals. The minimum value among the calculation results is 598, as Δt=90 and Δt+- =30Δt− . This experiment results can provide the reference for train scheduling and operation management under the viewpoint of traffic safety and service level.
Because there are four basic definitions proposed in this research, so this paper has certain limitations. In addition, this research is not free of mistakes and inconveniences. Future researches could be conducted to further improve the performance and practicality of passenger flow distribution models for more scientific and reasonable.
Acknowledgements: The authors gratefully acknowledge the financial support from the National Natural ScienceFoundation of China (Grant No. 71171015).
Author Contributions: L.G. and L.J. conceived and designed the models and experiments; L.G. performed the experiments and analyzed the data; L.G. wrote this paper; all authors collaborated on the interpretation of the results and on the preparation of the manuscript.
Conflict of Interest: The authors declare no conflict of interest.
References
1. Fruin. J. J. Designing for pedestrians: a level of service concept. Washington DC: Highway Research Board. vol. 355, no. 12, pp. 1-15, 1971.
2. Transportation Research Board. Highway Capacity Manual. Washington DC: National Research Council Press. pp. 635-670, 2000.
3. Muramatsu. M, Irie. T, and Nagatani. T. Jamming transition in pedestrian counter flow. Physica A. vol. 267, no. 3, pp. 487-498, 1999.
4. Okazaki. S. A study of pedestrian movement in architectural space, part 1: pedestrian movement by the application on of magnetic models. Transactions of the Architectural Institute of Japan. vol. 283, no. 3, pp. 111-119, 1979.
5. Gipps. P. G, and Marksjo. B. A micro-simulation model for pedestrian flows. Mathematics and Computers in Simulation. vol. 27, no. 2, pp. 95-105, 1985.
6. Lovas. G. G. Modeling and simulation of pedestrian traffic flow. Transportation Research Part B. vol. 28, no. 3, pp. 429-443, 1994.
8. Blue. V. J, and Adler. J. L. Cellular automata microsimulation for modeling bi-directional pedestrian walkways. Transportation Research Part B. vol. 35, pp. 293-312, 2001.
9. Li. X. M, Yan. X. D, and Li. X. G. Using cellular automata to investigate pedestrian conflicts with vehicles in crosswalk at signalized intersection. Discrete Dynamics in Nature and Society. vol. 3, pp. 1555-1565, 2012. 10. Edward. L. F, and Gabe K. Pedestrian and bicyclist safety and mobility in Europe. Washington DC: U. S.
Department of Transportation Federal Highway Administration. vol. 2, 2010.
11. Barbara. M, and Edward. S. Public policies for pedestrian and bicyclist safety and mobility. Washington DC: U. S. Department of Transportation Federal Highway Administration. vol. 8, 2010.
12. Helbing. D. Collective Phenomena and States in Traffic and Self-driven Many-particle Systems. Computational Materials Science. vol. 30, pp. 180-187, 2004.
13. Xiong. H. W, Yao. L. Y, and Wang. W. H. Pedestrian walking behavior revealed through a random walk model. Discrete Dynamics in Nature and Society. vol. 12, pp. 1951-1965, 2012.
14. Lu. L. L, Ren. G, and Wang. W. Exploring the effects of different walking strategies on bi-directional pedestrian flow. Discrete Dynamics in Nature and Society. vol. 2, pp. 1-9, 2013.
15. Daamen. W, Bovy. P. H. L, and Hoogendoorn. S. P. Influence of changes in level on passenger route choice in railway stations. 84th Annual Meeting of the Transportation Research Board, Washington DC: National Research Council Press. pp. 12-20, 2005.
16. Daamen. W, Bovy. P. H. L, and Hoogendoorn. S. P. Choices between stairs, escalators and ramps in stations. 10th International Conference on Computer System Design and Operation in the Railway and Other Transit Systems. pp. 3-12, 2006.
17. Lin. Y. D, and Trani. A. A. Airport automated people mover systems: analysis with a hybrid computer simulation model. Transportation Research Record. vol. 1703, pp. 45-57, 2000.
18. Seyfried. A, and Rupprecht. T. New insights into pedestrian flow through bottlenecks. Transportation Science. Vol. 43, no. 3, pp. 395-406, 2007.
19. Schadschneider. A, and Klingsch. W. Evacuation dynamics: empirical results, modeling and applications. Encyclopedia of Complexity and Systems Science. vol. 5, pp. 3142-3176, 2009.
20. Seyfried. A, and Boltes. M. Enhanced empirical data for the fundamental diagram and the flow through bottlenecks. Pedestrian and Evacuation Dynamics. pp. 145-156, 2010.
21. Duive. D. C, Daamen. W, and Hoogendoorn. S. P. State-of-the-art crowd motion simulation models. Transportation Research Part C. vol. 37, no. 3, pp. 193-209, 2013.
22. Guillermo H. G. A mathematical model of the formation of lanes in crowds of pedestrians moving in opposite directions. Discrete Dynamics in Nature and Society. vol. 2, pp. 56-63, 2015.
23. Bandini. S, Mondini. M, and Vizzari. G. Modelling negative interaction among pedestrians in high density situations. Transportation Research Part C. vol. 40, no. 1, pp. 251-270, 2014.
24. Xie. Z. Y, and Jia. L. M. A hybrid temporal-spatio forecasting approach for passenger flow status in chinese high-speed railway transport hub. Discrete Dynamics in Nature and Society. vol. 5, pp. 248-259, 2013.
25. Wang S. W, Zhou. R. G, and Zhao. L. Forecasting Beijing transportation hub areas’s pedestrian flow using modular neural network. Discrete Dynamics in Nature and Society. pp. 1-6, 2015.
26. Gao. L, and Jia. L. M. A modeling method for distribution service network of comprehensive passenger transport hub. The Open Cybernetics & Systemics Journal. vol. 9, no. 3, pp. 614-622, 2015.
27. Gao. L, and Jia. L. M. Modeling and simulation for distribution service network of comprehensive passenger transport hub. International Journal of Science and Engineering Investigations. vol. 5, pp. 177-182, 2016.
28. Wang S. W, and Rong. J. Transit station congestion index research based on pedestrian simulation and gray clustering evaluation. Discrete Dynamics in Nature and Society. vol. 12, pp. 1-8, 2013.
29. Seriani. S, and Fernandez. R. Pedestrian traffic management of boarding and alighting in metro stations. Transportation Research Part C. vol. 53, pp. 76-92, 2015.
30. Wang. G. Research on the model of assembling in the urban rail transit platform [Master dissertation]. Beijing Jiaotong University, China, 2012.
32. Schelenz. T, Suescun. A, and Wikstrom. L. Passenger-centered design of future buses using agent-based simulation. Procedia-Social and Behavioral Sciences. vol. 48, pp. 1662-1671, 2012.
33. Schelenz. T, Suescun. A, and Karlsson. M. Decision making algorithm for bus passenger simulation during the vehicle design process. Transport Policy. vol. 25, no. 1, pp. 178-185, 2013.
34. Schelenz. T, Suescun. A, and Wikstrom. L. Application of agent based simulation for evaluating a bus layout design from passengers’ perspective. Transportation Research Part C. vol. 43, no. 2, pp. 222-229, 2014.
35. Zhao. N, and An. S. Collaborative management of complex major construction projects: anylogic-based simulation modeling. Discrete Dynamics in Nature and Society. vol. 10, pp. 1-8, 2016.