R E S E A R C H A R T I C L E
Open Access
GraphSAW: A web-based system for graphical
analysis of drug interactions and side effects
using pharmaceutical and molecular data
Alban Shoshi
*, Tobias Hoppe
†, Benjamin Kormeier
†, Venus Ogultarhan
†and Ralf Hofestädt
†Abstract
Background:Adverse drug reactions are one of the most common causes of death in industrialized Western countries. Nowadays, empirical data from clinical studies for the approval and monitoring of drugs and molecular databases is available.
Methods:The integration of database information is a promising method for providing well-based knowledge to avoid adverse drug reactions. This paper presents our web-based decision support system GraphSAW which analyzes and evaluates drug interactions and side effects based on data from two commercial and two freely available molecular databases. The system is able to analyze single and combined drug-drug interactions,
drug-molecule interactions as well as single and cumulative side effects. In addition, it allows exploring associative networks of drugs, molecules, metabolic pathways, and diseases in an intuitive way. The molecular medication analysis includes the capabilities of the upper features.
Results:A statistical evaluation of the integrated data and top 20 drugs concerning drug interactions and side effects is performed. The results of the data analysis give an overview of all theoretically possible drug interactions and side effects. The evaluation shows a mismatch between pharmaceutical and molecular databases. The concordance of drug interactions was about 12% and 9% of drug side effects. An application case with prescribed data of 11 patients is presented in order to demonstrate the functionality of the system under real conditions. For each patient at least two interactions occured in every medication and about 8% of total diseases were possibly induced by drug therapy.
Conclusions:GraphSAW (http://tunicata.techfak.uni-bielefeld.de/graphsaw/) is meant to be a web-based system for health professionals and researchers. GraphSAW provides comprehensive drug-related knowledge and an improved medication analysis which may support efforts to reduce the risk of medication errors and numerous drastic side effects.
Keywords:Medical informatics, Information system, Decision support system, Drug therapy, Adverse drug interaction, Adverse drug reaction, Drug side effects
Background
In recent decades the development of highly effective drugs has crucially marked scientifically-based medicine. According to recent studies every fifth medication is in-correct and every fourteenth medication is potentially dangerous [1]. Over ten years it has been known that 1% of medication errors lead to adverse drug reactions
(ADRs) [2,3] and are a common cause of death [4]. In 2001, a study by Ebbesen et al. [5] provided reliable data on such deaths. They investigated 732 deaths among 13,992 patients over a treatment period of two years with regard to the cause of death and showed that 0.95% of patients in a department of internal medicine suffered fatal adverse drug events (ADEs). Autopsy results and postmortem blood level measurements used for identify-ing the exact cause of death showed for the first time that almost half of these deaths were due to avoidable drug-drug interactions and dosage errors [5]. In case of * Correspondence:[email protected]
†Equal contributors
Bioinformatics/Medical Informatics Department, Bielefeld University, Universitätsstraße 25, 33615 Bielefeld, Germany
Germany, a conservative extrapolation leads to tens of thousands of deaths per year as a consequence of medi-cation errors [6].
Computerized physician order entry systems (CPOES) and computerized decision support systems (CDSS) as-sist in the prescription of drugs and indicate potentially serious drug interactions as well as overdoses [7,8]. The risk check of available patient data and their respective drugs is based on pharmaceutical databases. Several interaction databases, including ABDA [9], MediQ [10], DrugDex [11] and AiDKlinik® [12], were evaluated by the hospital Klinikum Dachau with regard to the retrieval rate and relevance of drug interactions. A practical test [13] showed that all theoretically possible drug interac-tions described in literature cannot be found within only one database. For a reliable retrieval it is necessary to check drug interactions by using at least two databases.
In the recent past a variety of commercial and non-commercial drug-related databases have been estab-lished. Despite the large amount of drug-related infor-mation, the optimization of multi-medications using additional molecular data remains still complicated. These databases can however help to identify uncovered patient risk factors in the patient-specific drug therapy and to exclude certain drugs for patient treatment (e.g., if there is a serious drug-drug interaction or if the patient's metabolic profile does not respond to a specific drug).
Appropriate systems for health professionals and re-searchers are required to achieve substantial improve-ments in drug prescription quality for above reasons. For this purpose we have developed a web-based sys-tem named GraphSAW which integrates drug-related pharmaceutical and molecular databases. This combin-ation enables GraphSAW to provide a discovery toolkit for analysis and visualization of drug interactions and side effects.
Related work
To meet the challenges of drug therapy safety, we evalu-ated three relevalu-ated web-based systems to expose their ad-vantages and disadad-vantages.
Promiscuous
Promiscuous [14] was developed to facilitate the progress of drug repositioning. The system includes three different entities: drugs, proteins, and side effects. Information about the relations of these entities was gathered from different molecular databases. Additional information was extracted and manually curated from PubMed publications. All data was integrated into the independent Promiscuous database. The system provides search forms for drug-protein interactions, drug side effects, and drug-pathway interactions. The results are shown in an
interactive network and listed in a tabular form. Note that, there is no possibility for determining drug-drug interactions.
Stitch
The search tool for interactions of chemicals, short STITCH [15], is a database of interaction data and an interactive web tool for the exploration of interaction networks of proteins and chemicals, including drugs. The basis of this system consists of chemical compounds from PubChem which were mapped on thirteen molecu-lar databases. In addition, a confidence-value is assigned to each interaction relation based on the reliability of the data source. The results are visualized in an inter-active network with three different views: confident-view, evidence-confident-view, and action-view. Further informa-tion of the network is shown in a table. Informainforma-tion about metabolic pathways and drug side effects are not included in STITCH.
Kegg medicus
KEGG MEDICUS [16] is an integrated information re-source of diseases, drugs, and health-related substances, aiming to bring the genomic revolution of society. KEGG MEDICUS currently integrates the KEGG DRUG and KEGG DISEASE databases, human pathways and drug development pathways in KEGG PATHWAY data-base, and FDA drug labels for both prescription and OTC drugs in the USA and Japan. Given a list of drugs, the Drug Interaction Checker reports any drug-drug inter-actions associated with contraindications and precautions. The information is computerized in lists. Network-based information and visualization about drug side effects and drug-induced diseases is missing.
Methods
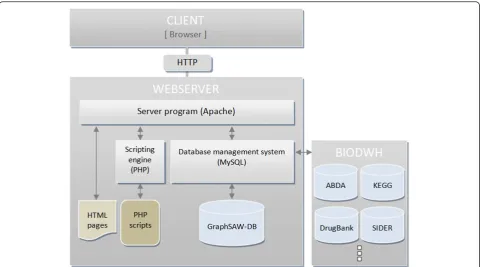
GraphSAW was developed as a user-friendly decision support system for health professionals and re-searchers and is based on common client/server archi-tecture (Figure 1). It is a web-based system that is platform independent and accessible via the Internet. The application logic was implemented in PHP,aHTML, b
and CSSc. The core of GraphSAW represents the data-base, which integrates drug-related pharmaceutical and molecular databases. Due to this comprehensive know-ledge GraphSAW provides a discovery toolkit for analysis and visualization. JavaScript components for associative network visualization were developed for a scientific yet intuitive way of analyzing and exploring the data. There-fore, jQuery and Information Visualization Toolkit library (InfoVis) [17] were used.
An arbitrary set of user inputs are sent via an asyn-chronous HTTP-request to the web server. On the ser-ver side, the results of the database evaluation are converted with PHP scripts into JSON format and trans-ferred to the InfoVis library which renders the graph for visualizing the results.
Data integration
GraphSAW contains six different types of entities: drugs, interactions, side effects, molecules, diseases, and path-ways. The entities are connected to each other through
drug-drug interaction, drug-side effects, drug-molecule, drug-disease, drug-pathway, and pathway-disease rela-tions. To provide a comprehensive dataset, the informa-tion was retrieved from two commercial and two freely available databases: ABDA [9], KEGG [18], SIDER [19], and DrugBank [20], whereas the latter represents the basis of the system. DrugBank is the largest resource that collects binding data on small molecules, in particu-lar those of drugs and proteins. A total number of 6711 approved and experimental drugs were extracted and mapped to additional databases. Moreover, DrugBank contains drug-drug interactions as well as drug-protein interactions combined with the DrugBank Partners data-base. Further drug interactions were obtained from the commercial database ABDA that is based on approved and validated drug-related data in comparison to Drug-Bank. ABDA contains comprehensive facts for dealing with more than 47,000 drugs such as information about application and composition, risks and drug interactions. Codes of ATC [21], anAnatomicalTherapeutical Chem-ical classification system, were used to classify drugs of the databases DrugBank and ABDA. These DrugBank drugs were assigned to the ABDA drugs by ATC-codes and identifiers. The ABDA database includes also the side effects of drugs. More than 4500 side effects (3,135 different; 1,381 synonyms) were extracted automatically from full-text information in German and translated
manually into English. An additional 4,192 different drug side effects were obtained from SIDER. Terms of MedDRA d [22], a unified and standardized medical terminology, were used for coding drug side effects of both databases. The mapping between drugs of Drug-Bank and SIDER was realized by drug names because these databases did not have corresponding identifiers for substances. By drug mapping, the interactions and side effects were assigned to drugs of all databases. Information about metabolic pathways was obtained from KEGG, which already integrates substances from DrugBank [20], PubChem [23], CAS [24], LigandBox [25], and NIKKAJI [26]. DrugBank identifiers were used for the mapping and merging of these data sources.
All databases were integrated by implementing SAX e -Parser in Java and the bio data warehouse BioDWH [27]. BioDWH is a novel bioinformatics data warehouse software kit that integrates biological information from multiple public life science data sources into a local database management system. It differs from other approaches by providing up-to-date integrated knowledge, platform and database independence as well as high usability and customization. This way of integra-tion provides the transformaintegra-tion from different data file types such as XML or TSV into MySQL databases. Using the data warehouse architecture also ensures both the availability as well as the relevance of the data sources.
An additional GraphSAW database was created to store meta data such as extracted and translated side effects from ABDA. It also contains lists of drugs for a
“so-called” auto-complete functionality. This feature is used to suggest possible drugs to users, which guarantee search results.
Data analysis and visualization
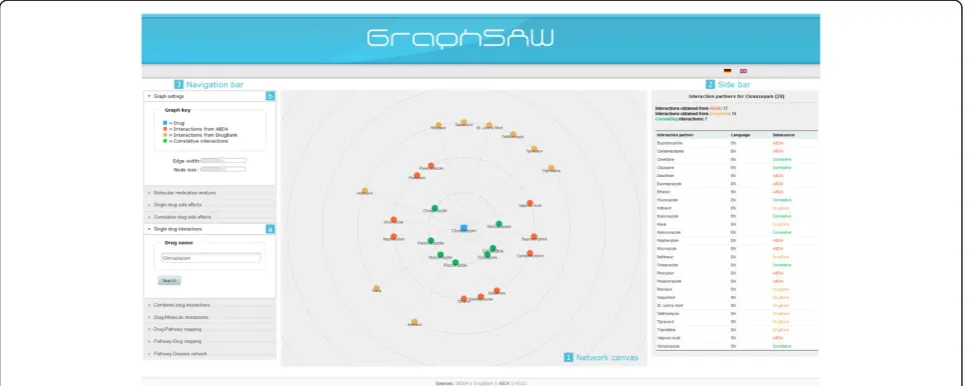
The user interface represents database entities (drugs, side effects, molecules, diseases, and pathways) as nodes in a network with edges representing the relations between them. Starting from an arbitrary set of user in-puts, the system analyzes the integrated knowledge and makes an evaluation in terms of risks (Figure 2). The li-brary generates a radial network, thus, one or a couple of central nodes represent the inputs encircled by color-coded results at higher levels (1). The radial network is used to separate the results at different levels depending on different databases. Detailed information about nodes and edges are available as a color-coded plain list via the bar on the right side (2). Furthermore, user inputs in the search form (a) and basic graph settings (b) can be ad-justed in the navigation bar (3) on the left side.
The data delivered by GraphSAW can be queried through various search forms which are described in more detail in the following. GraphSAW provides three types of drug analysis: drug interactions and drug side
effects, which are based on pharmaceutical and molecu-lar data, and the molecumolecu-lar medication analysis which is based on molecular data.
Analysis of drug interactions
Multi-medications are associated with a significantly increased risk for adverse drug reactions and presents health professionals with a major challenge of adequate prescription. Drug interactions can be determined at three different levels: drug-drug, drug-molecule, and drug-pathway interactions.
At the first level, search forms forsingle and combined
drug interactions were implemented in GraphSAW.
‘Single drug interactions’ enables users to search for interaction partners of a single drug. Interaction partners are merged, compared, ordered alphabetical and visual-ized depending on the databases ABDA and DrugBank.
’Combined drug interactions’ is one of the main features of the system. This feature allows users to check their multi-medications for interactions. Both pharmaceutical and molecular drug-drug interactions are retrieved from ABDA and DrugBank. Interacting drugs are placed as color-coded nodes in the network with edges represent-ing the interactions between them.
Drug-molecule interactionscan be queried at the second level. Especially the family of Cytochrome P450 Enzymes (CYPs) plays an important role in the degradation of most drugs. Many drugs inhibit or induce the activity of Cyto-chrome P450 Enzymes (CYPs) which is important to health professionals trying to give an appropriate dosage of those drugs. If a drug induces a CYP that is also active in another drug’s metabolism, the dosage of the first drug must be enhanced to achieve a therapeutic effect. In the case of the inhibition of a CYP, the dosage of the drug can be reduced which also decreases side effects. Interactions between drugs and molecules (targets, enzymes, trans-porter, and carrier proteins) can be queried by drug name. This information is retrieved from DrugBank and Drug-Bank Partners.
in such a complex network is by using the name of a pathway.
Analysis of drug side effects
Knowledge about drug side effects can be extremely use-ful in supporting the quality of prescribing medications. Similar to drug interactions, search forms forsingle and cumulative drug side effects were implemented. ‘Single drug side effects’ enables users to search for side effects of a single drug. Package inserts of prescription drugs (ABDA) are supposed to contain side effects but such information is not necessarily complete. Therefore, the side effects are merged, compared, ordered alphabetical and visualized depending on the databases ABDA and SIDER.Cumulative drug side effectsare side effects that occur in at least two of the prescribed drugs. This means that the occurrence probability of cumulative side effects increases with the number of prescribed drugs. There-fore, they represent a particularly high risk – especially for long-term treatments with psychotropic drugs. With this feature, cumulative side effects of entered drugs can be identified and avoided.
Molecular medication analysis
The ‘molecular medication analysis’ includes the previ-ously mentioned search forms ‘combined drug interac-tions’,‘drug-molecule interactions’, and ‘drug side effects’. This main feature allows users to check the medications for molecular drug side effects, drug and drug-enzyme interactions. Therefore, users only need to enter
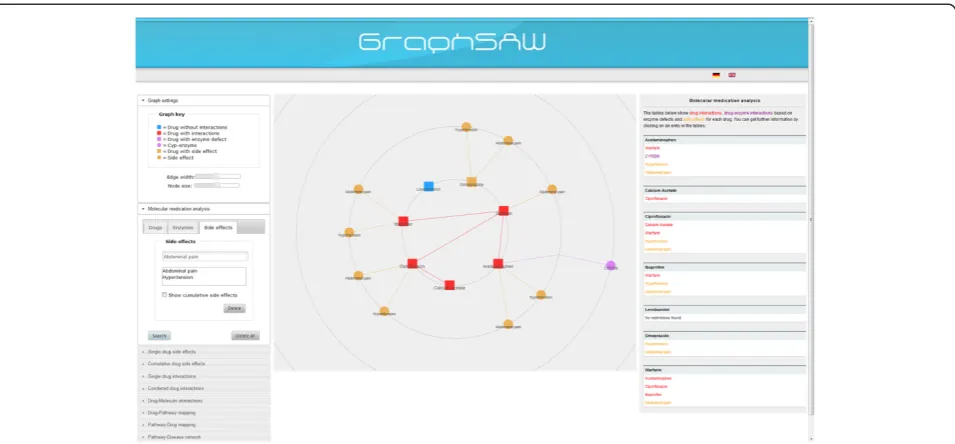
the prescribed drugs, occurred side effects or drug-induced diseases, and the defect Cytochrome P450 enzymes (CYP) into the system. As an example, Figure 3 shows the result of the molecular medication analysis for seven drugs and two side effects. Starting from this arbitrary set of user inputs, the system checks whether a drug interacts with another drug or causes side effects. Further information like the effect of the interaction between two drugs, the frequency of a side effect, and the activity of the defect CYP can be queried.
Statistical evaluation and application case
The variety of possible drug interactions and side ef-fects are not tallied systematically and are hardly man-ageable, even for experts. GraphSAW gives insight into the distribution of the integrated pharmaceutical and molecular data concerning drug interactions and drug side effects. Furthermore, an analysis of leading drugs (top 20) was carried out, i.e., according to the number of prescriptions made in 2008, in terms of drug inter-actions and side effects. This data was obtained from the “GEK-Arzneimittel-Report 2009” [28]. This report of the German health insurance GEK evaluates the re-sults of drug data in the period from 2007 to 2008. The drug prescriptions include output drugs in pharmacies paid by the GEK. Finally, an application case with real life patient data was performed in order to analyze multi-medications for drug interactions and drug-induced diseases. The patient data was provided by a medical practice.
Statistical evaluation of data distribution
The distribution of drug interactions and drug side effects data within the integrated pharmaceutical and molecular databases was analyzed. As summarized in Figure 4, the analysis has revealed a total of 51,520 drug interaction hits, whereas 29,854 (58%) of the total interactions are re-corded in ABDA and 15,518 (30%) in DrugBank. Further-more, only 6,148 (12%) of total interactions are shared by both databases. As a consequence, about 30% of total drug interactions are missing in computerized decision support systems which are based on pharmaceutical data of the ABDA database.
The analysis of drug side effects has revealed an even more surprising result. The number of total side effect hits is 140,651 whereas 42,213 (30%) of the total side
effects are recorded in ABDA and 85,873 (61%) in SIDER. The number of correlative side effect hits is 12,565 (9%). As a consequence, more than 60% of total side effects are missing in ABDA. Similar to drug-drug interactions only a small part of side effects are shared by both databases.
Statistical evaluation of drug interactions
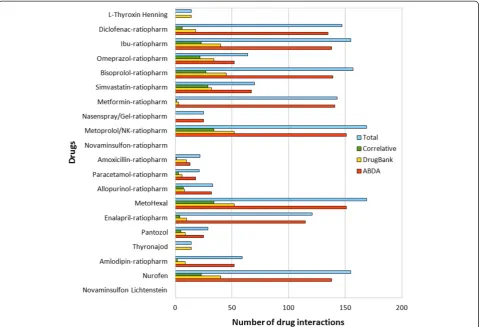
Figure 5 describes the number of identified drug interac-tions of the top 20 drugs. The current analysis has re-vealed a total of 1,567 interaction hits whereas 1,392 (88.83%) of the total interactions are recorded in ABDA and 396 (25.27%) in DrugBank. The number of correla-tive interaction hits is 221 (14.10%), representing the overlap of both databases, while 1,346 hits (85.90%) are Figure 3Network visualization interface of GraphSAW explaining“molecular medication analysis”for seven drugs and two side effects.The main window enables users to view the network of drug-drug interactions (red), drug-enzyme interactions (violet), drug side effects (yellow), and drugs without potential risks (blue). The right side bar shows context sensitive information about nodes and edges.
non-correlative. Consequently, 75.28% of the overall 1,788 interaction hits recorded from both databases are not matched with each other.
Statistical evaluation of drug side effects
Figure 6 shows the number of identified side effects of the top 20 drugs. The number of total side effect hits is 3,890 whereas 1,444 (37.12%) of the total side effects are re-corded in ABDA and 2,887 (74.22%) in DrugBank. The number of correlative interaction hits is 441 (11.34%) and 3,449 hits (88.66%) are non-correlative. As a consequence, it was revealed that 79.64% of the overall 4.331 side effect hits from both databases are not matched with each other.
Application case
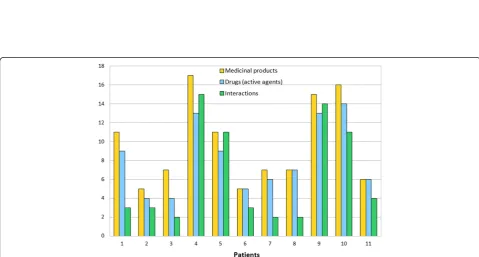
The following application case with real life data of eleven patients demonstrates the GraphSAW system under real conditions. The data was collected and pro-vided by a medical practice. The patient’s data was col-lected from 10 men and 1 woman with an average age of 78 years and an average weight of 87 kg. These patients were diagnosed with 8 to 18 diseases and were treated with 5 to 17 multiple drugs.
The analysis of drug-drug interactions showed that at least two interactions occured in every medication of each patient. This bears a high potential for the occur-rence of adverse drug reactions. Figure 7 shows the number of medicinal products, drugs (active agents), and drug interactions for each patient.
Even more important is the prevention of diseases which can be induced by drug therapy. The occurrence probability of these drug-induced diseases increases with the number of drugs sharing the same side effects. As summarized in Figure 8, 8.43% of total diseases were possibly induced by drug therapy. 70% of these drug-induced diseases occured only at more than one drug. This result leads one to assume that the number of dis-eases for each patient can be reduced by prescribing fewer drugs.
The datasets of the patients and all results of the ana-lyses are available at http://tunicata.techfak.uni-bielefeld. de/graphsaw/application_case/index.html
Results
Figure 6Number of drug side effects.Number of drug side effects retrieved from the databases ABDA and SIDER in correlation to the top 20 drugs.
databases. The concordance of drug interactions was about 12% and 9% of drug side effects. More than 30% of the molecular drug interactions and more than 61% of the molecular side effects were missing in the pharmaceutical database. Therefore, they are also miss-ing in most computerized decision support systems. These results were confirmed by the analysis of the top 20 drugs on the German market. The concordance of drug interactions was about 14% and 11% of drug side effects. In addition, more than 35% of the molecular in-teractions and more than 60% of the molecular side ef-fects were not recorded in the pharmaceutical database. Finally, the application case showed that for each patient at least two interactions occured in every medication. Moreover, about 8% of total diseases were possibly in-duced by drug therapy.
Discussion
Although drugs are essential for the prevention and proper treatment of diseases, multi-medications still may cause serious adverse drug reactions which are usually known. Reliability on the extent and quality of informa-tion used by medical doctors for decision making lies at the heart of efforts towards improving prescription qual-ity. GraphSAW provides users a graphical view on a well-based knowledge to analyze drug cocktails for adverse drug reactions and drug-induced diseases. The obtained results can be used to compare the risk of disease against the therapeutic risk (benefit/risk rela-tion), i.e., to avoid the risk of under-treatment of pa-tients which is possibly an even greater risk. GraphSAW will be extended by visualizing additional information such as interaction profiles (mechanism, effect, etc.) or side effect profiles (extent, frequencies, etc.). As adverse
drug reactions do not occur in each patient in the same extent due to inter-individual genetic differences, a new feature to analyze polymorphisms is planned to be implemented.
Conclusions
The drugs risks-check of decision support systems is usually based on pharmaceutical databases. Despite the large amount of drug-related information, the analysis and optimization of multi-medications using additional molecular data is still complicated and even for experts unmanageable. With GraphSAW we presented a new decision support system which integrates pharmaceutical and molecular databases. Based on this comprehensive knowledge, GraphSAW provides a toolkit for analysis and visualization. Users can check their medications for single and combined drug interactions, drug-molecule interactions as well as single and cumulative side effects. Moreover, the implemented visualization toolkit allows exploring associative networks of drugs, molecules, metabolic pathways, and diseases to fully understand ef-fects of drugs in an intuitive way. Along this line the dosage of drugs can be adjusted to the protein balance of the patient, resulting in better drug tolerability. For further support, the molecular medication analysis includes the features of combined drug interactions, drug-molecule interactions, and drug side effects at the molecular level.
and researchers gain more comprehensive knowledge and can contribute to a patient-related analysis of medi-cation with the features offered by GraphSAW.
Endnotes a
PHP: Hypertext Preprocessor. b
Hypertext Markup Language. c
Cascading Style Sheets. d
Medical Dictionary for Regulatory Activities. e
SAX is the Simple API for XML. SAX was the first widely adopted API for XML in Java.
Availability and requirements
GraphSAW is available at http://tunicata.techfak.uni-bielefeld.de/graphsaw/. Access to the system is restricted by the commercial databases and will be enabled by a re-quest to the authors. To access all features of the system, the latest browser versions such as Internet Explorer 9+ or Mozilla Firefox 23+ should first be installed.
Competing interests
The authors declare that they have no competing interests.
Authors’contributions
TH carried out the data integration and implementation of GraphSAW. BK participated in the coordination and data integration of the databases by the BioDWH. VO performed the statistical analysis. RH helped to draft the manuscript. AS conceived of the system, carried out its coordination, design and implementation, and participated in the statistical analysis and drafted the manuscript. All authors read and approved the final manuscript.
Acknowledgements
We acknowledge support for the Article Processing Charge by the Deutsche Forschungsgemeinschaft and the Open Access Publication Funds of Bielefeld University Library. The project was funded by the Federal Ministry of Economics and Technology (BMWi) and European Social Fund (ESF).
Received: 6 October 2014 Accepted: 20 February 2015
References
1. Barker KN, Flynn EA, Pepper GA, Bates DW, Mikeal RL. Medication errors observed in 36 health care facilities. Arch Intern Med. 2002;162:1897–903. 2. Brennan TA, Leape LL, Laird NM, Herbert L, Localio AR, Lawthers AG, et al.
Incidence of adverse events and negligence in hospitalized patients. Results of the Harvard Medical Practice Study I N Engl J Med. 1991;324:370–6. 3. Bates DW, Boyle DL, Vander Vliet MB, Schneider J, Leape L. Relationship
between medication errors and adverse drug events. J Gen Intern Med. 1995;10:199–205.
4. Lesar TS, Briceland L, Stein DS. Factors related to errors in medication prescribing. JAMA. 1997;277:312–7.
5. Ebbesen J, Buajordet I, Erikssen J, Brørs O, Hilberg T, Svaar H, et al. Drug-related deaths in a department of internal medicine. Arch Intern Med. 2001;161:2317–23.
6. Schnurrer JU, Frölich JC. Incidence and prevention of lethal undesirable drug effects. Internist. 2003;44:889–95.
7. Bates DW, Teich JM, Lee J, Seger D, Kuperman GJ, Ma'Luf N, et al. The impact of computerized physician order entry on medication error prevention. J Am Med Inform Assoc. 1999;6:313–21.
8. Kaushal R, Shojania KG, Bates DW. Effects of computerized physician order entry and clinical decision support systems on medication safety: a systematic review. Arch Intern Med. 2003;163:1409–16.
9. ABDAMED [http://www.abdata.de] 10. MediQ [http://www.mediq.ch] 11. DRUGDEX [http://truvenhealth.com]
12. AiDKlinik® [http://aidklinik.de]
13. Barth M, Holzmüller G, Fritsch H, Sturm Ch. Vergleich verschiedener Interaktionsdatenbanken. In Proceedings of the "3. Kongress für
Arzneimittelinformation": 11-12 January 2013; Cologne. http://www.adka-arznei. info/aminfo2013/downloads/Poster_2013/06_Sturm.pdf. Accessed 17 Oct 2013. 14. Von Eichborn J, Murgueitio MS, Dunkel M, Koerner S, Bourne PE, Preissner R.
PROMISCUOUS: a database for network-based drug-repositioning. Nucleic Acids Res. 2011;39:D1060–6.
15. Kuhn M, von Mering C, Campillos M, Jensen LJ, Bork P. STITCH: interaction networks of chemicals and proteins. Nucleic Acids Res. 2008;36:D684–8. 16. Kanehisa M, Goto S, Furumichi M, Tanabe M, Hirakawa M. KEGG for
representation and analysis of molecular networks involving diseases and drugs. Nucleic Acids Res. 2010;38:D355–60.
17. Belmonte NG: JavaScript InfoVis Toolkit [http://philogb.github.io/jit] 18. Kanehisa M, Goto S, Sato Y, Furumichi M, Tanabe M. KEGG for integration
and interpretation of large-scale molecular datasets. Nucleic Acids Res. 2012;40:D109–14.
19. Kuhn M, Campillos M, Letunic I, Jensen LJ, Bork P. A side effect resource to capture phenotypic effects of drugs. Mol Syst Biol. 2010;6:343.
20. Knox C, Law V, Jewison T, Liu P, Ly S, Frolkis A, et al. DrugBank 3.0: a comprehensive resource for‘omics’research on drugs. Nucleic Acids Res. 2011;39:1035–41.
21. WHO Collaborating Centre for Drug Statistics Methodology:Guidelines for ATC classification and DDD assignment 2013.Oslo; 2012
22. Brown EG, Wood L, Wood S. The Medical Dictionary for Regulatory Activities (MedDRA). Drug Saf. 1999;20:109–17.
23. Bolton E, Wang Y, Thiessen PA, Bryant SH. PubChem: Integrated Platform of Small Molecules and Biological Activities. In: Annual Reports in
Computational Chemistry, vol. 4. Oxford: Elsevier; 2008. p. 217–40. 24. Chemical Abstracts Service (CAS) [https://www.cas.org]
25. Kawabata T, Sugihara Y, Fukunishi Y, Nakamura H. LigandBox: a database for 3D structures of chemical compounds. BIOPHYSICS. 2013;9:113–21. 26. Japan Chemical Substance Dictionary (Nikkaji) [http://nikkajiweb.jst.go.jp] 27. Töpel T, Kormeier B, Klassen A, Hofestädt R: BioDWH: a data warehouse kit
for life science data integration. J Integr Bioinform. 2008, 5.
28. GEK - Gmünder ErsatzKasse. GEK-Arzneimittel-Report 2009. Bremen, Schwäbisch Gmünd: GEK - Gmünder ErsatzKasse; 2009.
Submit your next manuscript to BioMed Central and take full advantage of:
• Convenient online submission
• Thorough peer review
• No space constraints or color figure charges
• Immediate publication on acceptance
• Inclusion in PubMed, CAS, Scopus and Google Scholar
• Research which is freely available for redistribution