R E S E A R C H A R T I C L E
Open Access
Construction and application of service
quality evaluation system in the preclinical
research on cardiovascular implant devices
Yongchun Cui
1*, Fuliang Luo
1, Boqing Yang
1, Bin Li
1, Qi Zhang
1, Gopika Das
2, Guangxin Yue
1, Jiajie Li
3,
Yue Tang
1*and Xin Wang
1*Abstract
Background:Services for the preclinical development and evaluation of cardiovascular implant devices (CVIDs) is a new industry. However, there is still no indicator system for quality evaluation. Our aim is to construct a service for quality evaluation system for the preclinical research and development of CVIDs based on Fuzzy Analytical Hierarchy Process (FAHP).
Methods:First, we reviewed the related literature to identify and select possible factors. Second, we developed an analytic hierarchy process framework. Third, we developed a questionnaire based on pairwise comparisons and invited 10 experienced specialists to rate these factors. We then used FAHP to compute the weights of these factors and prioritize them. Finally, to demonstrate the effectiveness of the proposed indicator system, a case study was performed as a practical example.
Results:Four main indicators (professionalism, functionality, stability and security) and 15 subindicators were selected to form the service evaluation system based on literature review and expert’s proposals. According to the weight calculation data, the order of primary indicators by importance, is professionalism (0.6457), security (0.1193), functionality (0.0958) and stability (0.0596) in sequence. Top five secondary indices are personnel’s technical ability, facility and equipment attractiveness, data auditability, confidentiality capability and professional service procedures. In the case study, FW’s final actual effectiveness value was 0.9076, which is the same as the actual situation.
Conclusion:The indicator system established in this study is comprehensive, reasonable, reliable and with strong practicality. It is worth popularizing and applying. The implementation of this evaluation system can provide measurable evidence for service demander and a way to improve service quality for suppliers.
Keywords:Fuzzy analytical hierarchy process, Cardiovascular implant devices, Preclinical research and development service, Quality evaluation system
* Correspondence:[email protected]; [email protected];[email protected]
1Animal Experimental Center, Fuwai Hospital, Chinese Academy of Medical
Sciences and Peking Union Medical College, State Key Laboratory of Cardiovascular Disease & Center for cardiovascular experimental study and evaluation, National Center for Cardiovascular Diseases, Beijing Key Laboratory of Pre-clinical Research and Evaluation for Cardiovascular Implant Materials, Beijing 100037, China
Full list of author information is available at the end of the article
Background
Cardiovascular disease is the leading cause of death and disability worldwide [1–4]. Implantation of high-quality medical devices is one of the most commonly used means for the treatment of cardiovascular diseases. With the increasing morbidity and mortality of cardiovascular disease, there is an increasing market demand for high-quality cardiovascular implant devices (CVIDs), such as coronary artery stent, heart valves and artificial assistant equipment [5–8].
CVIDs belong to high-risk class III medical devices, which are characterized by security primacy, technical complexity, professional operation, long development line and high cost. Therefore, the need for a new service industry for the preclinical development and evaluation of implant devices arises at this historic moment. How-ever, there is still no service quality evaluation system, which might be the first step to the smooth, efficient running and standardization of this new industry [9].
According to previous studies, Analytic Hierarchy Process is a useful method for analysis of factors influen-cing service [10], and medical decision support [11–14]. The fuzzy theory has also been recommended for its ability to prevent expert judgment from being influenced by extreme values, to combine the participants’opinions more reasonably, as well as both objectively and accur-ately to prioritize the relevant indicators and to calculate their weight values under a hierarchy model [15–18]. This suggests to us that the Fuzzy Analytic Hierarchy Process (FAHP) has the advantages of both AHP and fuzzy theory, and it maybe an effective method for estab-lishing a service quality evaluation system for the pre-clinical development of CVIDs [19–21].
In the present study, we will focus on establishing a service quality evaluation system for the preclinical de-velopment of cardiovascular implant devices, based on FAHP. This would contribute to strengthening quality control and regulating the behavior in preclinical re-search and development of medical device, so as to guar-antee that the public can safely and effectively use them [22,23].
Methods
Arrangement of a decision-making group (DMG)
First, a DMG was organized to outline a structure for the process indicators according to the previously re-ported inclusive criteria [24,25] as follows:
1) Having an academic degree (PhD, MSc) in one of the mentioned majors: clinical, management. 2) Working as faculty in a hospital or Research
Institute, associated with cardiovascular implant devices.
3) Having empirical studies in subjects relevant to cardiovascular device development and application. 4) willing to answer the expert consultation form
Establishment of the evaluation framework
Then, we comprehensively reviewed literature [26–31] and collected the comments of the DMG. Indicators that could most effectively reflect the service quality in the preclinical development of cardiovascular implant de-vices were selected for constructing the two-index-hierarchy indicator system. The primary dimen-sions included professionalism, security, functionality and stability. The secondary dimensions included per-sonnel’s technical ability, hardware attractiveness, pro-fessional service procedures, permission suitability, confidentiality capability of information and resources, etc.
Calculation of the weights and ranks of the indicators Construct pair-wise comparison (PWC) matrix
With regard to the service validity evaluation frame-work, the DMG were required to perform pair-wise comparisons between the first and second levels of indi-cators, on the basis of their knowledge. To do this, they compared the importance of each indicator of both the first and second levels, with the adjacent indicators of its own level. Then, a matrix−X was created according to the pair-wise comparisons [32–34].
~xij¼ ~
x11 ~x12 ⋯ ~x1n ~
x21 ~x22 ⋯ ~x2n
⋮ ⋮ ⋱ ⋮
~xn1 ~xn2 ⋯ ~xnn
2 6 6 4
3 7 7
5 ð1Þ
Comparison matrix consistency check
After the comparison, matrices were established, and the consistency checks of the matrices was performed by computing the consistency ratio (CR):
CR¼CI
RI;CI¼ðλmax−nÞ=ðn−1Þ ð2Þ
Where: λmax is the largest Eigen value of the com-parison matrix.“CI” indicates the consistency index,“RI” denotes the random index, and“n” is the number of cri-teria that would be judged against (i.e., matrix size).
Determination of the indicators’weights
absolutely more important (AMI). To score the import-ance of indicators influencing the service quality for pre-clinical research on cardiovascular implant devices, 1/9– 9 scaling method was used as the scoring principle which showed the relative importance of the former in-dicator (A) compared with the latter inin-dicator (B). All of the primary indicators and the secondary indicators were paired and compared respectively. The data were shown in Additional file2.
The pair-wise comparison matrix between criteria is then formed based on the fuzzy numbers to evaluate the weights using the FAHP method [35–39]. Based on the previously constructed pair-wise comparison matrix−xij, the weights determined are as follows [24]:
αj Π n
j¼1lij
1=n
;βj¼ Πn j¼1mij
1=n ;γj Πn
j¼1nij
1=n ;δj
¼ jΠ¼n
1sij
1=n
ð3Þ
and
α¼jΣ¼n
1αj;β¼ Σ n
j¼1βj;γ¼ Σ n
j¼1γj;δ¼ Σ n
j¼1δj ð4Þ
We then prioritized the extracted indicators of service quality in a hierarchy model identified by the FAHP ap-proach [4] (see Additional file3).
Results
Demographic characteristics of experts
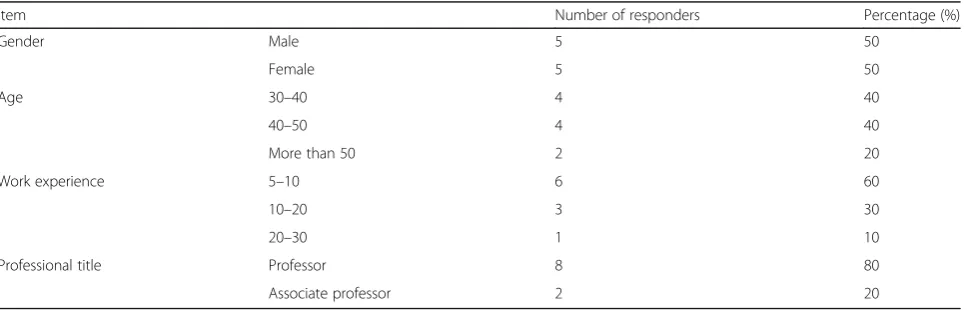
A total of 10 experts with a senior professional title in the internal (n= 5) and surgery (n = 5) departments of national center for cardiovascular diseases, were invited to participate in this study. Half male and half female, most belonged to the 30–50 age group. Six expert’s work experience was 5–10 years (60%), 3 expert’s work experi-ence was 10–20 years (30%) and 1 expert’s work was
more than 20 years (10%). Information describing the DMs is presented in Table1.
Extracting the affecting dimensions of service quality After a comprehensive review of the literature [17, 19,
21] and consideration of the DMG’s opinions, we se-lected indicators that can be applied to effectively assess the service quality in preclinical development of cardio-vascular implant devices. Thus a two-level evaluation system, including primary and secondary dimensions, was established.
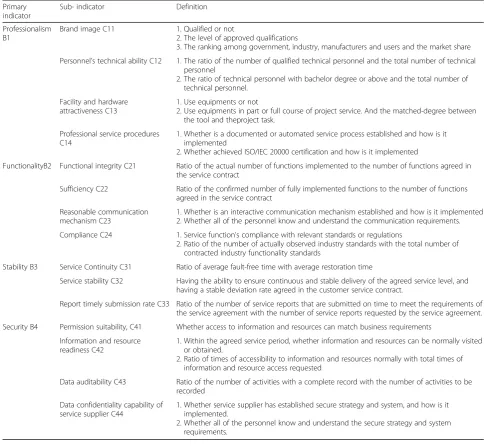
As shown in Table 2 and Fig. 1, the primary dimen-sions include professionalism, security, functionality and stability. With respect to the DMG expertise, we further developed some secondary indicators for each primary dimension. “Professionalism” indicators include person-nel’s technical ability, hardware attractiveness, profes-sional service procedures and brand image. Security includes the permission suitability, readiness, auditability and confidentiality capability of information and re-sources. Functionality includes functional integrity, suffi-ciency, reasonable interactive communication mechanism and applicance. Stability includes service continuity, stability, and report timely submission rate.
Extracting the weights and important coefficients of service quality indicators
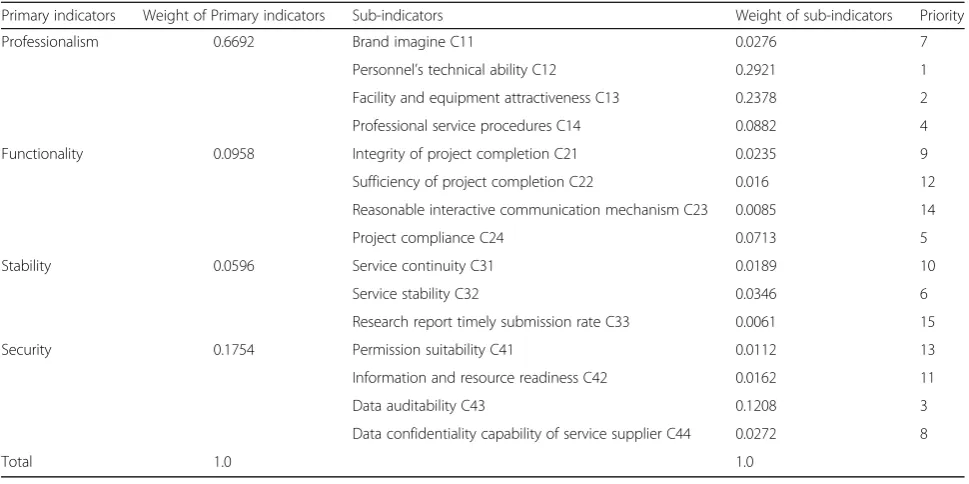
The weight of each evaluation indicator was calculated. Accordingly, the order of primary indicators, from top to bottom, is professionalism (0.6457), security (0.1193), functionality (0.0958) and stability (0.0596). The top five sub-dimemsions, in sequence, are personnel’s technical ability, hardware attractiveness, data auditability, confi-dentiality capability, professional service procedures and project compliance (Table3).
In this paper, to verify the consistency and validity of expert scoring results, the consistency ratio (CR) was used. CR enables observation of variations between the different pair-wise comparisons. In general, the CR value
Table 1Descriptive demographic characteristics of specialists
Item Number of responders Percentage (%)
Gender Male 5 50
Female 5 50
Age 30–40 4 40
40–50 4 40
More than 50 2 20
Work experience 5–10 6 60
10–20 3 30
20–30 1 10
Professional title Professor 8 80
Table 2Hierarchical structure of indicators and sub-indicators
Primary indicator
Sub- indicator Definition
Professionalism B1
Brand image C11 1. Qualified or not
2. The level of approved qualifications
3. The ranking among government, industry, manufacturers and users and the market share
Personnel’s technical ability C12 1. The ratio of the number of qualified technical personnel and the total number of technical personnel
2. The ratio of technical personnel with bachelor degree or above and the total number of technical personnel.
Facility and hardware attractiveness C13
1. Use equipments or not
2. Use equipments in part or full course of project service. And the matched-degree between the tool and theproject task.
Professional service procedures C14
1. Whether is a documented or automated service process established and how is it implemented
2. Whether achieved ISO/IEC 20000 certification and how is it implemented
FunctionalityB2 Functional integrity C21 Ratio of the actual number of functions implemented to the number of functions agreed in the service contract
Sufficiency C22 Ratio of the confirmed number of fully implemented functions to the number of functions agreed in the service contract
Reasonable communication mechanism C23
1. Whether is an interactive communication mechanism established and how is it implemented 2. Whether all of the personnel know and understand the communication requirements.
Compliance C24 1. Service function’s compliance with relevant standards or regulations
2. Ratio of the number of actually observed industry standards with the total number of contracted industry functionality standards
Stability B3 Service Continuity C31 Ratio of average fault-free time with average restoration time
Service stability C32 Having the ability to ensure continuous and stable delivery of the agreed service level, and having a stable deviation rate agreed in the customer service contract.
Report timely submission rate C33 Ratio of the number of service reports that are submitted on time to meet the requirements of the service agreement with the number of service reports requested by the service agreement.
Security B4 Permission suitability, C41 Whether access to information and resources can match business requirements
Information and resource readiness C42
1. Within the agreed service period, whether information and resources can be normally visited or obtained.
2. Ratio of times of accessibility to information and resources normally with total times of information and resource access requested
Data auditability C43 Ratio of the number of activities with a complete record with the number of activities to be recorded
Data confidentiality capability of service supplier C44
1. Whether service supplier has established secure strategy and system, and how is it implemented.
2. Whether all of the personnel know and understand the secure strategy and system requirements.
of the pairwise comparison matrix being less than or equal to 0.1 indicates that the expert’s judgments are reasonable; above 0.1 means weak consistency [40]. The results of this study show that the consistency of expert responses is 0.01, which means that the confidence level is over 90%. It is thus concluded that the responses expressed by the experts are well thought out rather than subjectively determined.
Service quality grading
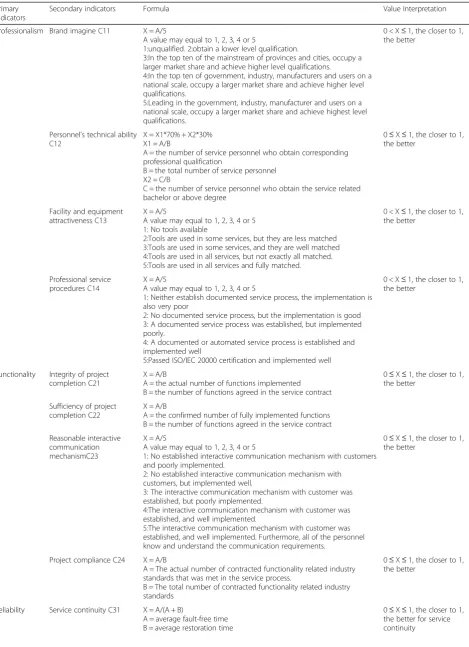
For the convenience application, a service quality grad-ing method was developed in this study. First, the ex-perts graded the formula calculation results (FCR) according to the formulas in Table4. Second, the actual effectiveness value (AEV) of each indicator was achieved by multiplying the FCR times their own weights. Finally, laboratory service ability was graded according to the standards expressed using“star level”. A total of five ser-vice quality levels were suggested, in which level 5 was the highest and level 1 was the lowest in the hierarchy (see Table 5 for details). If needed, the level evaluation method can not only evaluate primary indicators, but also independently evaluate secondary indicators.
Case study
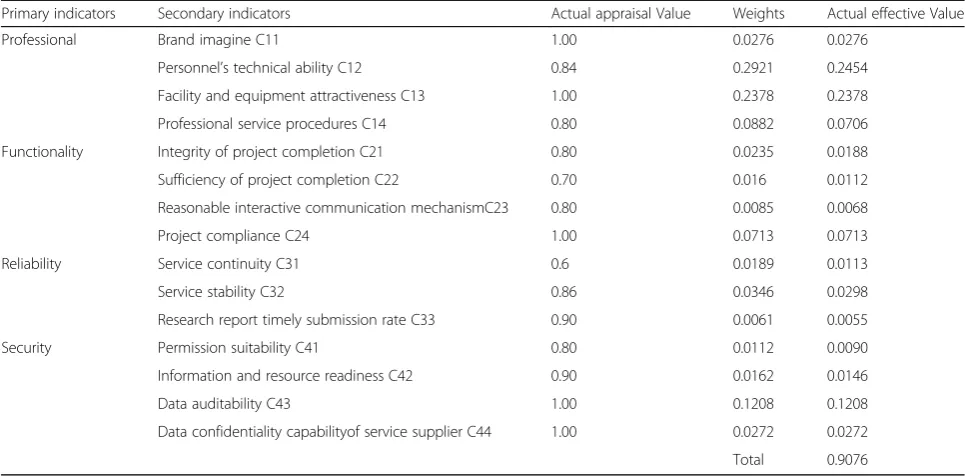
To verify the practical applicability of the proposed ser-vice quality evaluation system, a case study was per-formed. A questionnaire was designed to collect the DMG’s judgments. The DMG’s were then asked to evaluate the service supplier, FW lab, according to the requirements in Table6.
Given that the FW lab undertakes projects from both clinical researchers and domestic/abroad enterprises, who engage in the research & development of cardiovas-cular implants devices. Their customers mainly include clinical doctors (project manager), graduates (project ex-ecutor), and R&D staff of companies. Therefore, in this case study, respondents included different types of cus-tomers: clinical doctors (n= 10), graduates (n = 10), the company research and development staff (n = 10). A total of 30 questionnaires were handed out, and the re-covery number of valid questionnaires was 30 copies. The average age was 35 years old, the sex ratio 3:1 (male: female), all had obtained either a bachelor’s degree, graduate degree or above, and accounted for 75%. Ac-cording to the survey data and interview contents, the FCR of each index was calculated; combined with pri-mary indicators and sub-indicator’s weight, the compre-hensive implementation effectiveness assessment set was obtained. After normalization processing and further as-signment, FW’s final comprehensive service quality AEV was 0.9076, therefore, we concluded that the compre-hensive service ability of FW for the preclinical develop-ment of cardiovascular implant devices is up to five-star level.
Discussion
Quality is regarded as an important factor in all organi-zations especially those involving patient life and health. As for the newly arising industry of services for the pre-clinical development and evaluation of implant devices, there is still no quality evaluation system. In this study, we used the FAHP method to construct a service quality
Table 3Weight and prioritization of indicators and sub-indicators using FAHP
Primary indicators Weight of Primary indicators Sub-indicators Weight of sub-indicators Priority
Professionalism 0.6692 Brand imagine C11 0.0276 7
Personnel’s technical ability C12 0.2921 1
Facility and equipment attractiveness C13 0.2378 2
Professional service procedures C14 0.0882 4
Functionality 0.0958 Integrity of project completion C21 0.0235 9
Sufficiency of project completion C22 0.016 12
Reasonable interactive communication mechanism C23 0.0085 14
Project compliance C24 0.0713 5
Stability 0.0596 Service continuity C31 0.0189 10
Service stability C32 0.0346 6
Research report timely submission rate C33 0.0061 15
Security 0.1754 Permission suitability C41 0.0112 13
Information and resource readiness C42 0.0162 11
Data auditability C43 0.1208 3
Data confidentiality capability of service supplier C44 0.0272 8
Table 4Calculation of different index items for“star”grading
Primary indicators
Secondary indicators Formula Value Interpretation
Professionalism Brand imagine C11 X = A/5
A value may equal to 1, 2, 3, 4 or 5
1:unqualified. 2:obtain a lower level qualification.
3:In the top ten of the mainstream of provinces and cities, occupy a larger market share and achieve higher level qualifications.
4:In the top ten of government, industry, manufacturers and users on a national scale, occupy a larger market share and achieve higher level qualifications.
5:Leading in the government, industry, manufacturer and users on a national scale, occupy a larger market share and achieve highest level qualifications.
0 < X≤1, the closer to 1, the better
Personnel’s technical ability C12
X = X1*70% + X2*30% X1 = A/B
A = the number of service personnel who obtain corresponding professional qualification
B = the total number of service personnel X2 = C/B
C = the number of service personnel who obtain the service related bachelor or above degree
0≤X≤1, the closer to 1, the better
Facility and equipment attractiveness C13
X = A/5
A value may equal to 1, 2, 3, 4 or 5 1: No tools available
2:Tools are used in some services, but they are less matched 3:Tools are used in some services, and they are well matched 4:Tools are used in all services, but not exactly all matched. 5:Tools are used in all services and fully matched.
0 < X≤1, the closer to 1, the better
Professional service procedures C14
X = A/5
A value may equal to 1, 2, 3, 4 or 5
1: Neither establish documented service process, the implementation is also very poor
2: No documented service process, but the implementation is good 3: A documented service process was established, but implemented poorly.
4: A documented or automated service process is established and implemented well
5:Passed ISO/IEC 20000 certification and implemented well
0 < X≤1, the closer to 1, the better
Functionality Integrity of project completion C21
X = A/B
A = the actual number of functions implemented B = the number of functions agreed in the service contract
0≤X≤1, the closer to 1, the better
Sufficiency of project completion C22
X = A/B
A = the confirmed number of fully implemented functions B = the number of functions agreed in the service contract
Reasonable interactive communication mechanismC23
X = A/5
A value may equal to 1, 2, 3, 4 or 5
1: No established interactive communication mechanism with customers and poorly implemented.
2: No established interactive communication mechanism with customers, but implemented well.
3: The interactive communication mechanism with customer was established, but poorly implemented.
4:The interactive communication mechanism with customer was established, and well implemented.
5:The interactive communication mechanism with customer was established, and well implemented. Furthermore, all of the personnel know and understand the communication requirements.
0≤X≤1, the closer to 1, the better
Project compliance C24 X = A/B
A = The actual number of contracted functionality related industry standards that was met in the service process.
B = The total number of contracted functionality related industry standards
0≤X≤1, the closer to 1, the better
Reliability Service continuity C31 X = A/(A + B)
A = average fault-free time B = average restoration time
evaluation indicator system, which will provide a method for the service demanders to select ideal suppliers, and for the service suppliers to improve their service quality.
The adopted FAHP technique in this study is one of the most widely used multi-criteria decision making methods [10]. It has been proposed for medical diagno-sis, evaluation and selection of medical treatments and therapies; however, no studies have been done with the service quality evaluation for the preclinical develop-ment of cardiovascular implant devices. The conven-tional AHP only takes into account the distinct
judgments of decision makers, [18] but it can’t fully re-veal human’s fuzzy opinions [16]. So, FAHP method, a fuzzy extension of AHP, was developed by integrating fuzzy comparison ratios. The fuzzy set theory, puts to-gether the comparison process more flexibly and po-tently in order to clarify experts’ preferences [20]. Practice has proven that it is equally suitable for building a feasible and reasonable service quality evaluation indi-cator system in our study.
In this study, both customer and service supplier fac-tors were comprehensively considered [41] and a rela-tively complete indicator system was constructed through FAHP analysis. The indicator system consists of two index hierarchies. Primary dimensions include pro-fessionalism, security, functionality and stability. Among them, professionalism is the most important with the highest weight values in the primary indicators, based on our research findings.
Professionalism can be reflected in four aspects: brand image, personnel’s technical ability, facility and equip-ment attractiveness, and professional service procedures. Brand image refers to the personality characteristics of
Table 4Calculation of different index items for“star”grading(Continued)
Primary indicators
Secondary indicators Formula Value Interpretation
Service stability C32
Y¼
Xn
i¼1
ðXi−XÞ2
n X¼1‐Y
=ðEu‐ElÞ
Y: Standard deviation ratio
Xi: Sample values for service characteristics X: Sample mean of service characteristics
Eu: The upper limit value of the deviation specified in the service agreement
El: The lower limit value of the deviation specified in the service agreement
n: sampling times for service
If Y > 1,equal to 1; If Y≤1, equal to Y; 0≤X≤1
the closer to 1, the better
Research report timely submission rate C33
X = A/B
A = The number of service reports that are submitted on time to meet the requirements of the service agreement
B = Number of service reports requested by the service agreement
0≤X≤1, the closer to 1, the better
Security Permission suitability C41 X = A/B
A = The number of privilege authorized appropriately
B = The number of privilege requested by the service agreement
0≤X≤1, the closer to 1, the better
Information and resource readiness C42
X = A/B
A = Times of accessibility to information and resources normally B = Total times of information and resource access requested
0≤X≤1, the closer to 1, the better
Data auditability C43 X = A/B
A = The number of activities with a complete record B = The number of activities to be recorded
0≤X≤1, the closer to 1, the better
Data confidentiality capability of service supplier C44
X = A/5
A value may equal to 1, 2, 3, 4 or 5
1: No secure strategy and system, and poorly implemented 2:No secure strategy and system, but well implemented
3:Secure strategy and system was established, but poorly implemented 4:Secure strategy and system was established, and well implemented 5:Secure strategy and system was established, and well implemented. Furthermore, all of the personnel know and understand the secure strategy and system requirements.
0 < X≤1
the closer to 1, the better
Table 5the presentation of star rating results
Rating Actual effective value (X) Star Level Markers
Level I X<0.3 One-Star ★
Level II 0.3≤X<0.5 Two-Star ★★
Level III 0.5≤X<0.7 Three-Star ★★★
Level IV 0.7≤X<0.9 Four-Star ★★★★
Level V 0.9≤X Five-Star ★★★★★
the company or a certain brand in the market and in the public’s heart. It best reflects the supplier’s professional-ism and the public’s recognition of the brand, especially the consumers [42]. However, personnel’s technical abil-ity and facilabil-ity/equipment attractiveness are the founda-tion of professionalism [43]. To enhance the brand image and service professionalism, it is an indispensably important content and method to improve personnel’s technical ability and hardwares. With increasingly fierce market competition, professional service procedures have become another core of corporate competition and have become an important strategy for the entire brand [44]. A good sense of service (reputation) can win more customers for the company, which is bound to enhance the market competitiveness of the company.
The top five secondary indicators in the service quality evaluation system include personnel’s technical ability, fa-cility and equipment attractiveness, data auditability, con-fidentiality capability and professional service procedure in order. Among which, personnel’s technical ability, facil-ity and equipment attractiveness and professional service procedure belong to professionalism as mentioned above. Data auditability and confidentiality capability belong to the primary dimension “security”. Auditability requires a variety of records, which are an important part of the traceability. As for confidentiality, service supplier should establish a secure strategy and system, and all of the personnel should understand the secure strategy and sys-tem requirements. This is an important indicator pro-posed from the perspective of customer requirement.
For the convenience of popularization and application of this system, this study also proposed the use of a
“star” system to represent service quality evaluation re-sults. As a case study, this study used the system to as-sess the service quality of FW lab which is the largest cardiovascular implanted devices preclinical research and development service laboratory in China. The re-sults show that the evaluation rere-sults obtained by this system are consistent with the actual survey results.
In terms of enterprise brand image, most of the do-mestic cardiovascular implant device manufacturers are cooperating with the FW laboratory. FW laboratory has obtained the highest level of qualification, and occupied more than 60% market share. In terms of professional service personnel, the laboratory has a total of 40 em-ployees, all of whom are qualified. More than half of the people have obtained a professional bachelors degree or above, with a solid basis and rich practical experience in team work. FW Laboratory has the first domestic one-stop hybrid operating room dedicated to animal ex-periment (cleanliness up to grade 10.000). It is equipped with 3 mobile C arm X-ray machines (American GE), the Dutch Philips real-time three-dimensional ultra-sound machine, Germany Drager anesthesia machine, a breathing machine and other advanced equipment, which are attractive enough.
Based on the long-term service practice, FW laboratory has accumulated a wealth of experience, mastered ad-vanced technologies and established professional service procedure. The integrity and stability of service, experi-mental data availability and readiness are satisfactory, which were widely recognized. It is really up to five-star level laboratory. According to the evaluation results, a proposal for improving its service was put forward:
Table 6Comprehensive evaluation for pre-clinical service quality evaluation of cardiovascular implantation in FW
Primary indicators Secondary indicators Actual appraisal Value Weights Actual effective Value
Professional Brand imagine C11 1.00 0.0276 0.0276
Personnel’s technical ability C12 0.84 0.2921 0.2454
Facility and equipment attractiveness C13 1.00 0.2378 0.2378
Professional service procedures C14 0.80 0.0882 0.0706
Functionality Integrity of project completion C21 0.80 0.0235 0.0188
Sufficiency of project completion C22 0.70 0.016 0.0112
Reasonable interactive communication mechanismC23 0.80 0.0085 0.0068
Project compliance C24 1.00 0.0713 0.0713
Reliability Service continuity C31 0.6 0.0189 0.0113
Service stability C32 0.86 0.0346 0.0298
Research report timely submission rate C33 0.90 0.0061 0.0055
Security Permission suitability C41 0.80 0.0112 0.0090
Information and resource readiness C42 0.90 0.0162 0.0146
Data auditability C43 1.00 0.1208 0.1208
Data confidentiality capabilityof service supplier C44 1.00 0.0272 0.0272
because of high frequency use, some precise instruments should be checked regularly to avoid impact on service continuity.
This study has several limitations. Our experts were limited to Beijing shanghai and Tianjin. Future research can be in a more culturally diverse geographical region and compared with the results of this paper since prefer-ences/experiences may change by country, tradition or socioeconomic level. More studies are required to inves-tigate the applicability of the indicators of service quality evaluation system developed in this paper.
Conclusions
The service quality evaluation system constructed in this study is effective and can be popularized. Application of this system will provide a measurable basis for the ser-vice demander to select serser-vice supplier and provide a method for the supplier to improve their service quality.
Additional files
Additional file 1:Expert score sheet. To perform pair-wise comparisons between the first and second levels of indicators, linguistic variables were used in the sheet to convert the measured qualitative factors to fuzzy numbers. EI: equally important; WMI: weakly more important; SMI: strongly more important; VSMI: very strongly more important; AMI; abso-lutely more important. (PDF 392 kb)
Additional file 2:Raw data for expert scoring. A total of 10 experts were invited to participate in this study. The score sheet recovery rate was 100%. The numbers in the last column represented the average of expert scores. (PDF 85 kb)
Additional file 3:Raw data for the weight and priority of indicators and subindicators using FAHP. With respect to the expert scoring results, the weight and priority of each evaluation indicator were calculated. The order of primary indicators, from top to bottom, was professionalism, security, functionality and stability. The top five sub-dimemsions included personnel’s technical ability, hardware attractiveness, data auditability, confidentiality capability, professional service procedures and project compliance. (PDF 56 kb)
Abbreviations
AMI:Absolutely more important; CR: Consistency ratio; CVIDs: Cardiovascular implant devices; DMG: Decision-making group; EI: Qually important; FAHP: Fuzzy Analytical Hierarchy Process; PWC: Pair-wise comparison; SMI: Strongly more important; VSMI: Very strongly more important; WMI: Weakly more important
Acknowledgments
None.
Funding
This work was supported by Beijing Municipal Science & Technology Commission [grant numbers Z161100005016014, Z101107052210004], Beijing Key Laboratory of Preclinical Research and Evaluation of Cardiovascular Implant Materials (grant number: 2018-PT2-ZR04) and China Union Medical College Small-scale Characteristic School Project (grant number: 2017-E-JG02). The funding body did not involve in the design of the study or collec-tion, analysis, and interpretation of data.
Availability of data and materials
All data generated or analysed during this study are included in this published article [and its supplementary information files].
Authors’contributions
YCC, YT, XW and JJL have contributed in study design. FLL, BQ Y and BL have contributed in acquisition and analysis of data. GXY has contributed in interpretation of data. YCC and QZ have contributed in drafting and development of the final manuscript. Gd has critically evaluated the draft article. All authors reviewed and approved final version of the manuscript.
Ethics approval and consent to participate
Not applicable.
Consent for publication
Not applicable.
Competing interests
The authors declare that they have no competing interests.
Publisher’s Note
Springer Nature remains neutral with regard to jurisdictional claims in published maps and institutional affiliations.
Author details
1Animal Experimental Center, Fuwai Hospital, Chinese Academy of Medical
Sciences and Peking Union Medical College, State Key Laboratory of Cardiovascular Disease & Center for cardiovascular experimental study and evaluation, National Center for Cardiovascular Diseases, Beijing Key Laboratory of Pre-clinical Research and Evaluation for Cardiovascular Implant Materials, Beijing 100037, China.2Department of Biology, Boston University, Boston, MA 02215, USA.3School of Agricultural Economics and Rural
Development, Renmin University of China, Beijing 100872, China.
Received: 25 October 2018 Accepted: 15 February 2019
References
1. Santulli G. Epidemiology of cardiovascular disease in the 21 st century: updated numbers and updated facts. J Cardiovasc Dis. 2013;1(1):1–2. 2. Wilkins E, Wilson L, Wickramasinghe K, Bhatnagar P, Leal J,
Luengo-Fernandez R. Townsend, N. European Cardiovascular Disease Statistics 2017 edition. Brussels: European Heart Network; 2017. p. 192.https://www.statista. com/study/44317/european-cardiovascular-disease-statistics-2017/. 3. Mozaffarian D, Benjamin EJ, Go AS, Arnett DK, Blaha MJ, Cushman M, Turner
MB. Heart disease and stroke statistics-2015 update: a report from the American Heart Association. Circulation. 2015;131(4):e29–39.https://doi.org/ 10.1161/CIR.0000000000000152.
4. Li H, Ge J. Cardiovascular diseases in China: current status and future perspectives. IJC Heart Vasc. 2015;6:25–31.https://doi.org/10.1016/j.ijcha. 2014.10.002.
5. Grand View Research, Angioplasty Balloons Market Size, Share & Trends Analysis Report By Type, By Application, By End Use, And Segment Forecasts, 2018–2025. 2018;25–30 Report ID: GVR-1-68038-356-0.https:// www.grandviewresearch.com/industry-analysis/angioplasty-balloons-market. 6. Grand View Research Connected Drug Delivery Devices Market Analysis
Report By Technology, By Product, By End User, And Segment Forecasts, 2018–2025. 2018, 46–50. Report ID: GVR-2-68038-651-6.https://www. grandviewresearch.com/industry-analysis/connected-drug-delivery-devices-market.
7. Grand View Research Minimally Invasive Surgical Instruments Market Size, Share & Trends Analysis Report by Device, Application, By End Use, And Segment Forecasts, 2018 - 2025, 2018.13–18. Report ID: GVR-2-68038-609-7.
https://www.grandviewresearch.com/industry-analysis/minimally-invasive-surgical-instruments-market.
8. Grand View Research, Hi-Tech Medical Devices Market Analysis Report By Product, By Site, And Segment Forecasts, 2018–2025. 2018.13–16. Report ID: GVR-2-68038-461-1.https://www.grandviewresearch.com/industry-analysis/ hi-tech-medical-devices-market.
9. IMDRF. International Medical Device Regulators Forum. IMDRF Website, 2017. (August), 1–17. Retrieved fromhttp://www.imdrf.org/index.asp. 10. Shafii M, Rafiei S, Abooee F, Bahrami MA, Nouhi M, Lotfi F, Khanjankhani K.
Public Health and Research Perspectives. 2016;7(4):239–47.https://doi.org/ 10.1016/j.phrp.2016.05.001.
11. Sloane EB, Liberatore MJ, Nydick RL. Medical decision support using the Analytic Hierarchy Process. Journal of Healthcare Information Management: JHIM. 2002;16(4):38–43. Retrieved fromhttp://www.ncbi.nlm.nih.gov/ pubmed/12365298.
12. Schmidt K, Aumann I, Hollander I, Damm K, Von Der Schulenburg JMG. Applying the analytic hierarchy process in healthcare research: a systematic literature review and evaluation of reporting. BMC Medical Informatics and Decision Making. 2015.https://doi.org/10.1186/s12911-015-0234-7. 13. Padilla-Garrido N, Aguado-Correa F, Cortijo-Gallego V, López-Camacho F.
Multicriteria decision making in health care using the analytic hierarchy process and microsoft excel. Med Decis Mak. 2014;34(7):931–5.https://doi. org/10.1177/0272989X14534533.
14. Hancerliogullari G, Hancerliogullari KO, Koksalmis E. The use of multi-criteria decision making models in evaluating anesthesia method options in circumcision surgery. BMC Medical Informatics and Decision Making. 2017; 17(1):1–13.https://doi.org/10.1186/s12911-017-0409-5.
15. Goepel KD. Implementing the analytic hierarchy process as a standard method for multi-criteria decision making in corporate enterprises–a new AHP excel template with multiple inputs. Proceedings of the International Symposium on the Analytic Hierarchy Process, 2013 of Medical Devices. 2005. p. 1–10. Retrieved fromhttps://www.researchgate.net/publication/ 275584446_Implementing_the_Analytic_Hierarchy_Process_as_a_Standard_ Method_for_Multi-Criteria_Decision_Making_in_Corporate_Enterprises_-_a_ New_AHP_Excel_Template_with_Multiple_Inputs.https://doi.org/10.1586/ 17434440.2.1.41.
16. Chang CC, Liang C, Shu KM, Tsai CW. Key successful factors of knowledge management for university students using e-portfolios: approach of fuzzy Delphi and fuzzy AHP. Comput Appl Eng Educ. 2015;23(5):673–681.https:// doi.org/10.1002/cae.21640.
17. Chen M-K, Wang S-C. The use of a hybrid fuzzy-Delphi-AHP approach to develop global business intelligence for information service firms. Expert Syst Appl. 2010;37(11):7394–407.https://doi.org/10.1016/j.eswa.2010.04.033. 18. Ma Z, Shao C, Ma S, Ye Z. Constructing road safety performance indicators using fuzzy delphi method and grey delphi method. Expert Syst Appl. 2011; 38(3):1509–14.https://doi.org/10.1016/j.eswa.2010.07.062.
19. Boyle J, Maeder A, Bell J, John S, Scott R. Medical device research. Expert Review of Medical Devices. 2005.https://doi.org/10.1586/17434440.2.1.41. 20. Parasuraman A, Zeithaml VA, Berry LL. A conceptual model of service
quality and its implications for future research. J Mark. 1985;49(4):41.https:// doi.org/10.2307/1251430.
21. Sharples S, Martin J, Lang A, Craven M, O’Neill S, Barnett J. Medical device design in context: a model of user-device interaction and consequences. Displays. 2012;33(4–5):221–32.https://doi.org/10.1016/j.displa.2011.12.001. 22. Kim CE, Shin JS, Lee J, Lee YJ, Kim MR, Choi A, Park KB, Lee HJ, Ha IH.
Quality of medical service, patient satisfaction and loyalty with a focus on interpersonal-based medical service encounters and treatment effectiveness: a cross-sectional multicenter study of complementary and alternative medicine (CAM) hospitals. BMC Complement Altern Med. 2017;17:174.
https://doi.org/10.1186/s12906-017-1691-6.
23. Koenig SC, Jimenez JH, West SD, Sobieski MA, Choi Y, Monreal G, Slaughter MS. Early feasibility testing and engineering development of a sutureless beating heart connector for left ventricular assist devices. ASAIO J. 2014; 60(6):617–25.https://doi.org/10.1097/MAT.0000000000000134.
24. Cronin JJ, Taylor SA. SERVPERF versus SERVQUAL: reconciling performance-based and perceptions-minus-expectations measurement of service quality. J Mark. 1994;58(1):125.https://doi.org/10.2307/1252256.
25. Kang G-D, James J. Service quality dimensions: an examination of Grönroos’s service quality model. Manag Serv Qual. 2004;14(4):266–77.
https://doi.org/10.1108/09604520410546806.
26. Altenstetter C. Medical device regulation in the European Union, Japan and the United States. Commonalities, differences and challenges. Innovation: The European Journal of Social Science Research. 2012;25(4):362–88.https:// doi.org/10.1080/13511610.2012.723328.
27. Cronin EM, Varma N. Remote monitoring of cardiovascular implanted electronic devices: a paradigm shift for the 21st century. Expert Review of Medical Devices. 2012.https://doi.org/10.1586/erd.12.18.
28. Gustafsson F, Rogers JG. Left ventricular assist device therapy in advanced heart failure: patient selection and outcomes. Eur J Heart Fail. 2017.https:// doi.org/10.1002/ejhf.779.
29. Gregory SD, Timms D, Gaddum N, Mason DG, Fraser JF. Biventricular assist devices: a technical review. Ann Biomed Eng. 2011.https://doi.org/10.1007/ s10439-011-0348-8.
30. Kramer DB, Xu S, Kesselheim AS. Regulation of medical devices in the United States and European Union. N Engl J Med. 2012;366(9):848–55.
https://doi.org/10.1056/NEJMhle1113918.
31. Lee S, Fukamachi K, Golding L, Moazami N, Starling RC. Left ventricular assist devices: from the bench to the clinic. Cardiology. 2013;125(1):1–12.https:// doi.org/10.1159/000346865.
32. Hung YH, Huang ML, Chen KS. Service quality evaluation by service quality performance matrix. Total Qual Manag Bus Excell. 2003;14(1):79–89.https:// doi.org/10.1080/14783360309706.
33. Chen L-F, Chen S-C, Su C-T. An innovative service quality evaluation and improvement model. Serv Ind J. 2018;38(3–4):228–49.https://doi.org/10. 1080/02642069.2017.1389907.
34. Dagger TS, Sweeney JC, Johnson LW. A hierarchical model of health service quality: scale development and investigation of an integrated model. J Serv Res. 2007;10(2):123–42.https://doi.org/10.1177/1094670507309594. 35. Lai IKW, Hitchcock M. A consideration of normality in importance–
performance analysis. Curr Issue Tour. 2015;18(10):979–1000.https://doi.org/ 10.1080/13683500.2014.990423.
36. Azzopardi E, Nash R. A critical evaluation of importance-performance analysis. Tour Manag. 2013;35:222–33.https://doi.org/10.1016/j.tourman. 2012.07.007.
37. Feng M, Mangan J, Wong C, Xu M, Lalwani C. Investigating the different approaches to importance-performance analysis. Serv Ind J. 2014.https:// doi.org/10.1080/02642069.2014.915949.
38. Sever I. Importance-performance analysis: a valid management tool? Tour Manag. 2015;48:43–53.https://doi.org/10.1016/j.tourman.2014.10.022. 39. Yu KT, Shen CY. Service quality management by expanded traditional
importance-performance analysis. Journal of the Chinese Institute of Industrial Engineers. 2011;28(2):146–54.https://doi.org/10.1080/10170669. 2010.546557.
40. Saaty TL. The analytic hierarchy process: planning, priority setting, resources allocation. McGraw-Hill Inc.; 1980. Retrieved fromhttp://linkinghub.elsevier. com/retrieve/pii/0377221782900224.
41. Shen CY. Strategic vendor selection criteria discussed in relation to demand and supply perspectives. Journal of Industrial and Production Engineering. 2014;31(7):405–16.https://doi.org/10.1080/21681015.2014.975161. 42. Ramseook-munhurrun P, Lukea-bhiwajee SD, Naidoo P. Service quality in
the public service. International Journal of Marketing and Marketing Research. 2010;3(1):37–50.https://doi.org/10.1017/CBO9781107415324.004. 43. Völckner F, Sattler H, Hennig-Thurau T, Ringle CM. The role of parent brand
quality for service brand extension success. J Serv Res. 2010;13(4):379–96.
https://doi.org/10.1177/1094670510370054.
44. Gorla N, Somers TM, Wong B. Organizational impact of system quality, information quality, and service quality. J Strateg Inf Syst. 2010;19(3):207–28.