R E S E A R C H
Open Access
Internal migration of physicians who
graduated in Brazil between 1980 and 2014
Mario Cesar Scheffer
1†, Alex Jones Flores Cassenote
1*†, Aline Gil Alves Guilloux
1and Mario Roberto Dal Poz
2Abstract
Background:The internal migration of physicians from one place to another in the same country can unbalance the supply and distribution of these professionals in national health systems. In addition to economic, social and demographic issues, there are individual and professional factors associated with a physician’s decision to migrate. In Brazil, there is an ongoing debate as to whether opening medicine programmes in the interior of the country can induce physicians to stay in these locations. This article examines the migration of physicians in Brazil based on the location of the medical schools from which they graduated.
Methods:A cross-sectional design based on secondary data of 275,801 physicians registered in the Regional Councils of Medicine (Conselhos Regionais de Medicina—CRMs) who graduated between 1980 and 2014. The evaluated outcome was migration, which was defined as moving away from the state where they completed the medicine programme to another state where they currently work or live.
Results:57.3% of the physicians in the study migrated. The probability of migration ratio was greater in small grouped municipalities and lower in state capitals. 93.4% of the physicians who trained in schools located in cities with less than 100,000 inhabitants migrated. Fewer women (54.2%) migrated than men (60.0%). More than half of the physicians who graduated between 1980 and 2014 are in federative units different from the unit in which they graduated. Individual factors, such as age, gender, time of graduation and specialty, vary between the physicians who did or did not migrate.
Conclusions:The probability of migration ratio was greater in small municipalities of the Southeast region and strong in the states of Tocantins, Acre and Santa Catarina. New studies are recommended to deepen understanding of the factors related to the internal migration and non-migration of physicians to improve human resource for health policies.
Keywords:Human resources for health, Distribution of physicians, Medical schools, Internal migration, Brazil
Background
The internal migration of physicians who leave a city or region of the country to establish themselves in another city or region of the same country can unbalance the distribution of these professionals in the national terri-tories [1]. Relatively few studies on the various forms of internal migration of physicians and other health profes-sionals are available in the international literature.
Studies on the mobility of physicians between countries identified a convergence of individual and professional
motivations as well as policy, economic, social and demo-graphic issues [2–4]. Similar to the determinants of the mobility of skilled workers in general [5], physicians most commonly migrate from places with worse living and working conditions and with few opportunities for profes-sional development. The attractiveness of specialized education centres, career prospects [6,7], better pay [8,9] and age [10] plays a relevant role in the decision of physi-cians to migrate. For instance, young physiphysi-cians are more inclined to change cities or countries.
In Brazil, recent policies have focused on the number, supply, demand, distribution and training of physicians. Since 2013 with the institution of the More Doctors law [11], new training programmes have opened with expanded * Correspondence:[email protected]
†Equal contributors
1Preventive Medicine Department, Medical School of University of São Paulo, São Paulo, Brazil
Full list of author information is available at the end of the article
graduate vacancies in medicine, expanded medical resi-dency programs and the admission of foreign and Brazilian physicians to practice in underserved municipalities and regions.
The “interiorization of medical training” is the decentralization of medical education resources to cities and regions where there are no or few medical schools are considered a possible inducing factor for physicians to stay in these localities [12]. There are no studies in Brazil that support this relationship, although physicians tend to remain in the cities where they conclude their medical residency [13] and these programmes are more concentrated in the South and Southeast regions of Brazil [14].
The objective of the present study is to evaluate the profile and distribution of physicians trained in Brazil between 1980 and 2014. We considered the federative units and the cities where the professionals graduated and where they currently work or reside to contribute to the understanding of the internal migration of physicians in the country.
Methods
This was cross-sectional study using secondary data from the Medical Demographics in Brazil [15]. This sur-vey is the census that includes administrative records from: Regional Medicine Councils (Conselhos Regionais de Medicina—CRMs); National Residency Commission (Comissão Nacional de Residência—CNRM) of the Bra-zilian Ministry of Education (Ministério da Educação— MEC); and the Brazilian Medical Association (Associa-ção Médica Brasileira—AMB).
The CRMs are responsible for registration and inspec-tion of physicians and their professional activity. All the active physicians in Brazil must be registered in a med-ical council; there are 27 medmed-ical councils, one in each Brazilian Federal Unit, which together integrated the Federal Medicine Council’s (Conselho Federal de Medi-cina—CFM) database.
All physicians registered in the CRMs who completed a degree in medicine between 1980 and 2014 were in-cluded in the study. The analysed time interval, which encompassed a significant contingent of graduated and enrolled physicians, included public or private degree programmes in various locations.
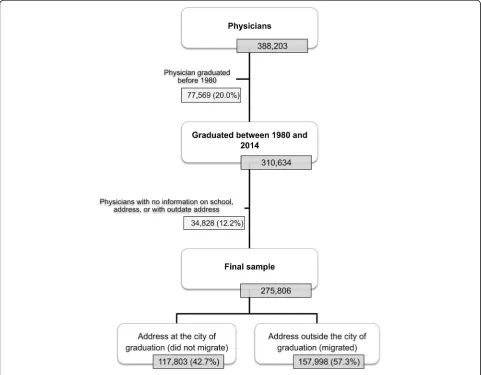
The initial database was composed of 388,203 physi-cians, of which 20% (77,569) did not match the temporal inclusion criteria. Of the 310,634 physicians considered, those with absent or incomplete information concerning current address or graduating school place were ex-cluded, which led to the exclusion of 12.2% of the physi-cians (34,828). The final database included 275,801 physicians that make up the universe of physicians who graduated in Brazil between 1980 and 2014 (Table 1).
The physicians’ places of graduation (medical school headquarter city), the dates of the first records of the physicians in the CRM (primary enrolment) and the current addresses provided by the physicians to the CRM, which corresponded to a residence and/or work address, were considered.
The evaluated primary outcome of interest was migra-tion. The binary variable (did not migrate/migrated) was defined as a move from one state (state of the school where the physician completed the medical degree) to another state (current living or working location). The qualitative nominal and ordinal variables were evaluated as factors and referred to the characteristics of the physi-cians (age, gender, date of graduation, and specialty) and the medical programmes (geographical location and public or private institution).
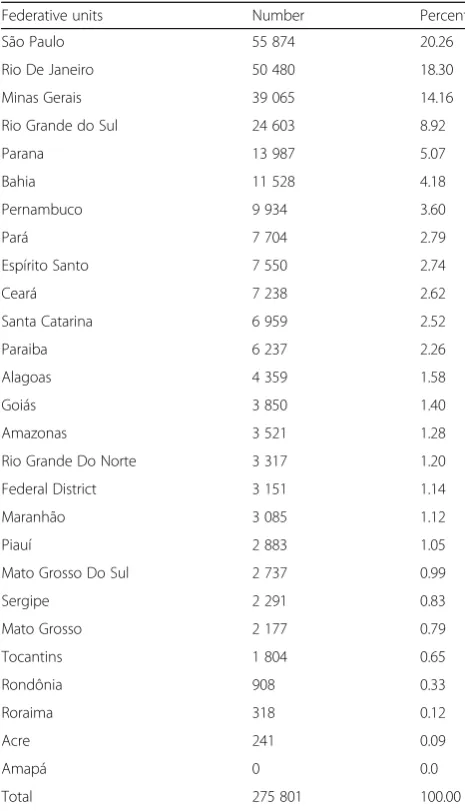
Table 1Physicians who graduated in Brazil between 1980 and 2014 according to the location of the graduating school in the federative units
Federative units Number Percent
São Paulo 55 874 20.26
Rio De Janeiro 50 480 18.30
Minas Gerais 39 065 14.16
Rio Grande do Sul 24 603 8.92
Parana 13 987 5.07
Bahia 11 528 4.18
Pernambuco 9 934 3.60
Pará 7 704 2.79
Espírito Santo 7 550 2.74
Ceará 7 238 2.62
Santa Catarina 6 959 2.52
Paraiba 6 237 2.26
Alagoas 4 359 1.58
Goiás 3 850 1.40
Amazonas 3 521 1.28
Rio Grande Do Norte 3 317 1.20
Federal District 3 151 1.14
Maranhão 3 085 1.12
Piauí 2 883 1.05
Mato Grosso Do Sul 2 737 0.99
Sergipe 2 291 0.83
Mato Grosso 2 177 0.79
Tocantins 1 804 0.65
Rondônia 908 0.33
Roraima 318 0.12
Acre 241 0.09
Amapá 0 0.0
The variable “type of municipality of the medical school”was stratified into three levels based on the 2010 census conducted by the Brazilian Institute of Geog-raphy and Statistics [15,16] according to the population strata as follows: (1) capitals, (2) large interior munici-palities (LM interior) with 100,000 or more inhabitants and (3) small interior municipalities (SM interior) with less than 100,000 inhabitants.
The migration according to the type of municipality of the medical school was analysed using a probability mi-gration ratio (PMR) like indicator obtained from the ra-tio between the probability of the physician migrating following graduation from a school located in the capi-tals (reference category) divided by the probability of the physician migrating following graduation from a school located in the interior (LM interior and SM interior).
The Statistical Package for the Social Sciences (SPSS) 20 for Windows (International Business Machines Corp., Armonk, NY, USA) was used for the analysis. The map was generated with the aid of QGIS Geographic Information
System version 2.4.0-Chugiak (QGIS Development Team 2016. Open Source Geospatial Foundation Project:http:// qgis.org/en/site/).
This study was approved by the Ethics in Research Committee of the Medical School of the University of São Paulo (Universidade de São Paulo) (Opinion n. 797,424, 09/03/2014).
Results
Among the 275,801 total physicians considered, 157,998 (57.3%) migrated (i.e., were living and/or working in a different state than the state where the medical school from which they graduated was located at the time of the study) (Table1and Fig.1).
From the total physicians analysed, 52.9% were male, 22.8% were below 35 years of age, 22.5% had graduated at least 5 years ago and 60% had completed their specialization or medical residence in one of the 53 recognized medical specialties. Most of the physicians
graduated from public schools (57.9%) located in the Southeast region (55.5%) and the state capitals (56.1%).
From 1980 to 2014, more than half of the Brazilian physicians (52.7%) graduated from schools located in the following three states: São Paulo (55,874 physicians or 20.2% of the total), Rio de Janeiro (50,480 or 18.3%) and Minas Gerais (39,065 or 14.1%). The states with the few-est graduated physicians were Acre (241 or 0.09%), Ror-aima (318 or 0.12%) and Rondônia (908 or 0.33%). The state of Amapá did not have any graduated physicians registered because it did not have a medical programme during the analysed period (Table1).
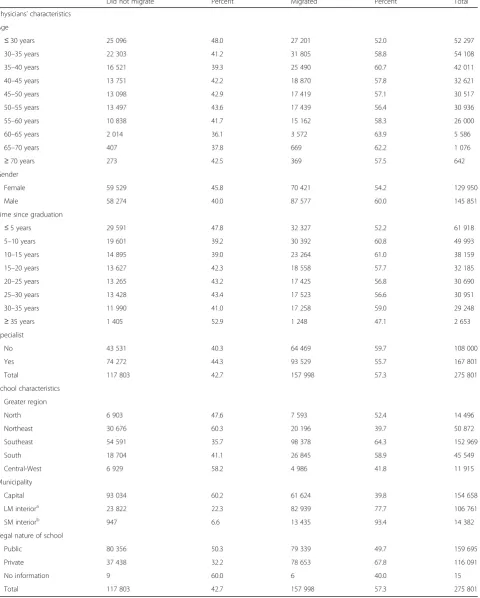
A total of 60.7% of the physicians older than 35 to 40 years of age migrated. In the age range below or equal to 30 years, 52.0% migrated (Table2). The women migrated less than the men (54.2 and 60.0%, respect-ively). A greater proportion of physicians who graduated 10 to 15 years before the study migrated (60.1% mi-grated) compared to the other groups stratified by the time since graduation. Additionally, more physicians without a specialization migrated (59.7%) compared with the specialists (55.7%) and physicians from private med-ical schools (67.8%) compared with the public medmed-ical schools (49.7).
Migration was also analysed according to the location of the graduate schools based on the municipality size and country region. In all regions, PMR was greater in small municipalities and lower in the capitals. Compared to the capitals, PMR of physicians who graduated from schools located in the group of small municipalities was 9.7-fold higher (Table3).
A total of 93.4% of the physicians who graduated from schools located in municipalities with less than 100,000 inhabitants migrated (Table2). The Southeast region had the largest absolute and relative contingent of physicians who graduated from small municipalities, and 93.8% of these physicians migrated (Table3). Regarding the nature of the schools, physicians who graduated from private schools migrated more often (67.8%) than physicians who graduated from public schools (49.7%), although in the physicians analysed the physicians who graduated from private schools represented 42.1% of the total.
Among the Brazilian states, the largest migration ra-tios were observed in Tocantins (85.3%), Santa Catarina (70.5%), Acre (60.6%) and Rio Grande do Sul (61.9%), whereas Alagoas (25.3%), Ceará (31.5%), Amazonas (33. 5%) and Piauí (34.8%) had the smallest migration per-centages (Fig.2).
Table4shows the physician population rate (PPR) and the percent of graduated, migrated and immigrated phy-sicians according Brazilian states and populational stratum. In this table, it is possible to evaluate some phe-nomena: (I) in almost all situations, small municipalities (SM interior) lost more than 85% of medical graduates;
(II) from the 16 municipalities (LG interior) that had the potential to train physicians, only 2 of them lost less than 65% of medical graduates; (III) from the 26 capital cities, only 6 lost more than 65% of medical graduates; and (IV) the capital of São Paulo state receives twice as many physicians as it loses.
There is a high migratory flow of physician from capi-tals, LG interior and LM interior for the capitals of the Brazilian states, with special focus on the Southeast re-gion or to the capital of the same rere-gion of the medical school graduation: 26.1% of the physician from capitals of the North region migrated to capital cities of the Southeast region; 36.1% of the physician from LM inter-ior of the Southeast region migrated to some capitals of the same region. Other similar examples can be seen in Additional file1: Table S1.
Discussion
In December of 2017, Brazil had 447.321 [17] physicians and a population of 207,660,929 [18] inhabitants, which corresponded to a density of 2.17 physicians per 1000 inhabitants. The distribution of these professionals in the national territory was unequal [18], with the North (1.09 physicians per 1000 inhabitants) and Northeast (1. 3) regions below the national ratio. In the seven North-ern states, the ratio varied from 0.91 to 1.51. In the Northeast, the state of Maranhão had the lowest ratio of the country, with 0.79 physicians per 1000 inhabitants. The Southeast, with 2.75 physicians per 1000 inhabi-tants, the South, with 2.18, and the Central-West region, with 2.20, were above the national average.
In 2014, there were 241 active medical schools in Brazil, which together offered approximately 20,340 vacancies and were located mostly in the Southeast (99 schools, 41. 0%) and Northeast (61 schools, 25.3%). Among the states, São Paulo (41 schools, 17%), Minas Gerais (34 schools, 14. 1%), Rio de Janeiro (17 schools, 7.0%), Paraná (15 schools, 6.2%) and Rio Grande do Sul (15 schools, 6.2%) had the most medical schools. Currently, there are medical schools in all 27 federative units [17].
In the present study, 176 schools that trained physi-cians in Brazil between the years considered (1980 and 2014) were headquartered in 103 different municipal-ities. Of these, 25 were located in the state capitals and the Federal District, 63 were in large interior municipal-ities and 14 were in small interior municipalmunicipal-ities.
Table 2Physicians who graduated between 1980 and 2014 who migrated and did not migrate according to gender, time since graduation, specialization and characteristics of the graduating schools
Did not migrate Percent Migrated Percent Total
Physicians’characteristics
Age
≤30 years 25 096 48.0 27 201 52.0 52 297
30–35 years 22 303 41.2 31 805 58.8 54 108
35–40 years 16 521 39.3 25 490 60.7 42 011
40–45 years 13 751 42.2 18 870 57.8 32 621
45–50 years 13 098 42.9 17 419 57.1 30 517
50–55 years 13 497 43.6 17 439 56.4 30 936
55–60 years 10 838 41.7 15 162 58.3 26 000
60–65 years 2 014 36.1 3 572 63.9 5 586
65–70 years 407 37.8 669 62.2 1 076
≥70 years 273 42.5 369 57.5 642
Gender
Female 59 529 45.8 70 421 54.2 129 950
Male 58 274 40.0 87 577 60.0 145 851
Time since graduation
≤5 years 29 591 47.8 32 327 52.2 61 918
5–10 years 19 601 39.2 30 392 60.8 49 993
10–15 years 14 895 39.0 23 264 61.0 38 159
15–20 years 13 627 42.3 18 558 57.7 32 185
20–25 years 13 265 43.2 17 425 56.8 30 690
25–30 years 13 428 43.4 17 523 56.6 30 951
30–35 years 11 990 41.0 17 258 59.0 29 248
≥35 years 1 405 52.9 1 248 47.1 2 653
Specialist
No 43 531 40.3 64 469 59.7 108 000
Yes 74 272 44.3 93 529 55.7 167 801
Total 117 803 42.7 157 998 57.3 275 801
School characteristics
Greater region
North 6 903 47.6 7 593 52.4 14 496
Northeast 30 676 60.3 20 196 39.7 50 872
Southeast 54 591 35.7 98 378 64.3 152 969
South 18 704 41.1 26 845 58.9 45 549
Central-West 6 929 58.2 4 986 41.8 11 915
Municipality
Capital 93 034 60.2 61 624 39.8 154 658
LM interiora 23 822 22.3 82 939 77.7 106 761
SM interiorb 947 6.6 13 435 93.4 14 382
Legal nature of school
Public 80 356 50.3 79 339 49.7 159 695
Private 37 438 32.2 78 653 67.8 116 091
No information 9 60.0 6 40.0 15
Total 117 803 42.7 157 998 57.3 275 801
a
LM interior—interior large municipalities≥100 000 inhabitants;
Given the trend towards the interiorization and privatization of medical education in Brazil [19], the re-sults of this study allow us to draw preliminary conclu-sions about the relationship between the location and nature of the school and the non-migration of physicians.
If adopted as an isolated measure, the opening of new, mostly private programmes in municipalities in the in-terior of the country in regions with a scarcity or a lower density of physicians per inhabitant may not directly affect the permanence of the graduated physicians in these locations. In this sense, the analysis has limitations because the study included a low number of physicians who graduated in small municipalities in the Northeast, North, Central-West and South regions because the in-ternalization of medical schools is a recent phenomenon in Brazil.
The less-intense migration of women compared to men corroborates the literature, which indicates that the
female gender is less prone to territorial relocation [20]. Thus, the feminization of medicine in Brazil [21] takes on increased relevance in the different aspects of the observed migration process, with a possible future posi-tive effect on the non-migration of physicians.
The state capitals retained more physicians who gradu-ated there. Although they had a smaller proportion than the capitals, the large cities of the country seemed to be more attractive than small cities to the physicians who graduated in these locations, which experienced a mass migration of physicians who graduated from their schools. In Brazil, it was observed that the 39 cities with more than 500,000 inhabitants concentrated 30% of the popu-lation and 60% of the physicians, which directly affected the low physician/inhabitant ratio in the small munici-palities. For example, in locations with 5000 to 10,000 inhabitants, the ratio is 0.28 physicians per 1000 resi-dents. In municipalities with between 10,000 and 20,000 Table 3Physicians who graduated in Brazil between 1980 and 2014 who migrated and did not migrate according to the location of the graduating school in the Greater Regions and in municipalities grouped by size
Did not migrate Percent Migrated Percent Total PMR
North
Capital 6 628 52.4 6 027 47.6 12 655 1.00
LM interior 167 17.5 789 82.5 956 3.00
SM interior 108 12.2 777 87.8 885 4.29
Total 6 903 47.6 7 593 52.4 14 496 –
Northeast
Capital 29 635 62.9 17 461 37.1 47 096 1.00
LM interior 1 041 27.6 2 735 72.4 3 776 2.28
SM interior 0 0.0 0 0.0 0 –
Total 30 676 60.3 20 196 39.7 50 872 –
Southeast
Capital 36 723 60.3 24 218 39.7 60 941 1.00
LM interior 17 057 21.6 61 921 78.4 78 978 2.79
SM interior 811 6.2 12 239 93.8 13 050 9.70
Total 54 591 35.7 98 378 64.3 152 969 –
South
Capital 13 200 58.1 9 505 41.9 22 705 1.00
LM interior 5 476 24.2 17 164 75.8 22 640 2.40
SM interior 28 13.7 176 86.3 204 4.24
Total 18 704 41.1 26 845 58.9 45 549 –
Central-West
Capital 6 848 60.8 4 413 39.2 11 261 1.00
LM interior 81 19.7 330 80.3 411 3.09
SM interior 0 0.0 243 100.0 243 –
Total 6 929 58.2 4 986 41.8 11 915 –
Total 117 803 42.7 157 998 57.3 275 801 –
residents, the ratio is 0.36, whereas in municipalities with between 20,000 and 50,000 residents, the ratio is 0. 64 physicians per 1000 inhabitants [15].
The results presented in Table4and in Additional file1: Table S1 suggest that there is a high migratory flow be-tween the capitals of the Brazilian states, especially with high influence of the state capitals from Southeast region; this region concentrates the largest number of medical residency programs in Brazil [14]. The few municipalities with less than 100,000 inhabitants, with the potential to train physicians, presented little retention capacity, losing their graduates to other regions. This situation has con-tributed to maintaining the low average per capita medical rate in these localities.
In this study, we also observed that there is a higher migration rate for physicians coming from private schools. This result may raise a warning about the new interiorization policies of medical schools in Brazil, a process that has resulted in an increase in the opening of private schools in the interiors of the states; one of the arguments used by the managers of this policy was that there could be retention of doctors in the host cities of medical schools and their surroundings.
In a systematic review realized by Willis–Shattuck et al. [22] to examine motivating factors that would reduce medical migration both within and across countries, the following factors were listed: financial incentives, career development, continuing education, hospital infrastructure, resource availability, hospital management and personal rec-ognition or appreciation. A more recent systematic review
identified similar variables with a high degree of similarity between selected studies; however, workload and autonomy seem to be specific to physicians’choice of workplace be-tween the public and private sectors [23].
A study that analysed geographical mobility of general practitioners in rural Australia found that in small towns of < 5000 residents had the highest risk of leaving rural practice. Mobility rates were significantly higher for GPs who had worked in a location for under 3 years and those working as either contracted or salaried em-ployees, and somewhat higher for international medical graduates [24].
Mobility of US Rural Primary Care Physicians During 2000–2014 was analysed. The researchers noted that county-level physician mobility was higher for counties that lacked a hospital (absolute increase = 5.7%), had a smaller population size, and had lower primary care physician supply, but area level economic and demo-graphic factors had little impact. Their conclusion was that outcomes were notably poorer in the most remote locations and those already having poorer physician sup-ply and professional support [25].
This study may be considered a starting point for the required in-depth analysis of migratory patterns of phy-sicians in Brazil. By using the database of administrative and professional records, it was possible to characterize the variables associated with the medical school and with the physicians who did or did not migrate.
Due to the sole focus on the comparison of the current address and graduation location, the present study did not
Table 4Training and migration/immigration of physician in Brazilian municipalities according to states and population strata between 1980 and 2014
State Stratum Population Physician in 2014 PPRa %graduated %migrated %immigrated
Rondônia Capital 484 992 1 283 2.65 0.29% 49.0% 54.6%
LG interior 229 295 334 1.46 0.00% 0.00% 100.0%
SM interior 1 013 927 670 0.66 0.04% 68.3% 91.8%
Acre Capital 357 194 726 2.03 0.09% 60.6% 74.7%
LG interior – – – – – –
SM interior 419 269 175 0.42 0.00% 0.00% 100.0%
Amazonas Capital 1 982 177 4 123 2.08 1.28% 33.5% 20.7%
LG interior 109 225 31 0.28 0.00% 0.00% 100.0%
SM interior 1 716 519 212 0.12 0.00% 0.00% 100.0%
Roraima Capital 308 996 657 2.13 0.12% 49.7% 63.9%
LG interior – – – – – –
SM interior 179 076 20 0.11 0.00% 0.00% 100.0%
Para Capital 1 425 922 5 333 3.74 2.79% 53.3% 5.1%
LG interior 2 435 197 1 341 0.55 0.00% 0.00% 100.0%
SM interior 4 138 610 617 0.15 0.00% 0.00% 100.0%
Amapa Capital 437 256 621 1.42 0.00% 0.00% 100.0%
LG interior 108 897 29 0.27 0.00% 0.00% 100.0%
SM interior 188 843 23 0.12 0.00% 0.00% 100.0%
Tocantins Capital 257 904 840 3.26 0.02% 64.2% 96.1%
LG interior 164 093 548 3.34 0.35% 82.5% 53.1%
SM interior 1 056 167 762 0.72 0.28% 90.4% 83.3%
Maranhao Capital 1 053 922 3 327 3.16 1.09% 40.1% 22.8%
LG interior 1 185 668 989 0.83 0.03% 90.5% 98.6%
SM interior 4 554 711 634 0.14 0.00% 0.00% 100.0%
Piaui Capital 836 475 3 714 4.44 1.05% 34.8% 23.6%
LG interior 148 832 188 1.26 0.00% 0.00% 100.0%
SM interior 2 198 859 675 0.31 0.00% 0.00% 100.0%
Ceara Capital 2 551 806 8 684 3.40 2.33% 25.0% 25.3%
LG interior 1 491 079 1 470 0.99 0.30% 82.8% 86.3%
SM interior 4 735 691 1 331 0.28 0.00% 0.00% 100.0%
RG Do Norte Capital 853 928 3 808 4.46 1.16% 38.1% 26.4%
LG interior 509 728 747 1.47 0.04% 70.6% 93.9%
SM interior 2 010 303 472 0.23 0.00% 0.00% 100.0%
Paraiba Capital 769 607 4 291 5.58 1.55% 54.6% 19.7%
LG interior 637 589 1 678 2.63 0.71% 66.7% 37.8%
SM interior 2 507 225 799 0.32 0.00% 0.00% 100.0%
Pernanbuco Capital 1 599 513 10 360 6.48 3.51% 37.5% 15.4%
LG interior 2 872 156 2 792 0.97 0.10% 59.8% 93.5%
SM interior 4 736 881 1 034 0.22 0.00% 0.00% 100.0%
Alagoas Capital 996 733 3 987 4.00 1.58% 47.5% 11.9%
LG interior 227 640 261 1.15 0.00% 0.00% 100.0%
SM interior 2 076 562 362 0.17 0.00% 0.00% 100.0%
analyse the migratory flow of physicians as a whole and did not consider the effect of the birthplace on relocation. Because this study was a cross-sectional study, it was not possible to capture possible intermediate moves and desti-nations over time or define whether the current location of the physician was definitive. In a classic study from
1978 on the flows and stocks of nurses and physicians, Mejía [26, 27] highlighted the difficulties of defining whether a professional’s migration was “permanent” or “temporary”based on secondary data.
Another limitation of the analysis is the concept of migra-tion adopted in this study. The movement of a physician Table 4Training and migration/immigration of physician in Brazilian municipalities according to states and population strata between 1980 and 2014(Continued)
State Stratum Population Physician in 2014 PPRa %graduated %migrated %immigrated
LG interior 272 877 40 0.15 0.00% 0.00% 100.0%
SM interior 1 308 208 157 0.12 0.00% 0.00% 100.0%
Bahia Capital 2 883 682 11 582 4.02 3.98% 34.7% 16.4%
LG interior 3 137 964 4 428 1.41 0.20% 81.4% 96.6%
SM interior 9 022 491 2 641 0.29 0.00% 0.00% 100.0%
Minas Gerais Capital 2 479 165 16 739 6.75 5.11% 35.6% 31.7%
LG interior 6 608 202 16 518 2.50 7.23% 71.8% 54.6%
SM interior 11 505 989 12 194 1.06 1.83% 89.4% 93.7%
Esp. Santo Capital 348 268 4 146 11.90 2.56% 65.4% 19.6%
LG interior 2 022 488 3 611 1.79 0.18% 78.8% 96.2%
SM interior 1 468 610 1 034 0.70 0.00% 0.00% 100.0%
Rio De Jan. Capital 6 429 923 40 378 6.28 7.42% 37.7% 39.2%
LG interior 7 860 741 16 550 2.11 7.98% 82.6% 60.6%
SM interior 2 078 515 3 035 1.46 2.90% 96.5% 83.8%
São Paulo Capital 11 821 873 54 978 4.65 7.01% 35.5% 65.3%
LG interior 20 588 317 47 241 2.29 13.25% 79.5% 76.5%
SM interior 10 950 963 11 825 1.08 0.00% 0.00% 100.0%
Parana Capital 1 848 946 10 738 5.81 3.68% 41.4% 26.7%
LG interior 3 825 638 7 283 1.90 1.39% 65.4% 75.3%
SM interior 5 322 881 4 093 0.77 0.00% 0.00% 100.0%
Santa Cat. Capital 453 285 3 604 7.95 1.15% 62.3% 54.6%
LG interior 2 504 181 6 380 2.55 1.30% 76.9% 82.7%
SM interior 3 676 788 3 559 0.97 0.07% 86.3% 98.8%
RG Do Sul Capital 1 467 816 13 068 8.90 3.40% 35.5% 36.0%
LG interior 3 865 596 8 504 2.20 5.52% 78.2% 48.0%
SM interior 5 830 631 5 730 0.98 0.00% 0.00% 100.0%
MG Do Sul Capital 832 352 2 900 3.48 0.86% 40.5% 36.2%
LG interior 424 478 967 2.28 0.13% 82.2% 89.1%
SM interior 1 330 439 1 022 0.77 0.00% 0.00% 100.0%
Mato Grosso Capital 569 830 2 279 4.00 0.79% 53.4% 40.8%
LG interior 594 533 628 1.06 0.00% 0.00% 100.0%
SM interior 2 017 750 1 579 0.78 0.00% 0.00% 100.0%
Goias Capital 1 393 575 7 915 5.68 1.29% 31.4% 57.0%
LG interior 1 892 869 1 615 0.85 0.01% 63.4% 98.6%
SM interior 3 147 604 2 381 0.76 0.09% 100.0% 100.0%
Dist. Federal Capital 2 789 761 8 299 2.97 1.14% 37.2% 63.3%
LM interior—interior large municipalities≥100 000 inhabitants; SM interior—interior small municipalities < 100 000 inhabitants
a
from one state to another may not represent a large dis-placement when it occurs between cities near the state border and can underestimate large displacements within the same state.
In this study, it was not possible to isolate the effect of the location of the medical school in relation to other cultural, employment, and socioeconomic factors that can influence migration.
Future studies on the subject may consider the charac-teristics of the place of origin (prior to obtaining the medical degree) and the current location of the profes-sionals who migrated. For this purpose, more refined methods will be required, such as methods that use mi-gration networks to establish possible migratory patterns.
Conclusion
More than half of the physicians who graduated between 1980 and 2014 are living and/or working in federative units different from the unit where the medical school from which they graduated was located.
The considerable and dynamic internal migration of physicians in Brazil (defined in this study as the reloca-tion or mobility of professionals from one state to an-other) seems to contribute to imbalances in the distribution, supply and availability of physicians in the country, whose motives are not yet fully clear.
When compared with physicians who remained in the state in which they graduated, there was a difference in the profiles of the physicians who migrated regarding in-dividual factors, such as age, gender, time since gradu-ation and specialty, which could partially explain the decision to migrate.
The probability of migration ratio was greater in small municipalities of the Southeast region and in the states of Tocantins, Acre and Santa Catarina, which also expe-rienced a more pronounced migration of physicians.
To guide adequate human resource policies in health, new studies are required that consider the socioeco-nomic level of the location, the establishment of services and employment and continued training opportunities among other possible factors for the non-migration of physicians.
The “push” and “pull” mechanisms that motivate the internal migration of physicians are complex and multi-factorial and can have consequences that require more research. For instance, qualitative studies should be per-formed to examine the migration networks and flows that are able to capture the controlled turnover (i.e., the supply of jobs to physicians from the outside) to meet the needs of health services and to offset retirement and other forms of replacement and exchange of profes-sionals. More studies are also needed on voluntary turn-over, which is when the physician leaves a certain place
in search of better living conditions, wages or career prospects without a previous offer.
Similarly, the motivations for temporary migration should be explored by human resources policies, which can produce benefits by aggregating value to the profes-sional and the local health system upon the physician’s return. This situation is in contrast to permanent migra-tion, which can represent the transfer of human capital from one place to another and thus weaken the capacity of local health systems [2,27–30].
Finally, research efforts should focus on monitoring the future movement of physicians in Brazil and other countries to identify factors related to internal migration and non-migration of these professionals and contribute to the conception, planning and assessment of public policies of human resources in health.
Additional file
Additional file 1:Table S1.Origin and destination of the physicians who graduated in Brazil between 1980 and 2014. (DOCX 33 kb)
Funding
This study takes place with the financial support Fundação Faculdade de Medicina (FFM), conselho Regional de Medicina do Estado de São Paulo (Cremesp) and Conselho Federal de Medicina (CFM), agreement (#0075/ 2015). Alex Jones Flores Cassenote was given a PhD Student scholarship from the São Paulo Research Foundation–FAPESP (proc. 2013/18158–0).
Availability of data and materials
The datasets generated and/or analysed during the current study are not publicly available due to restriction prohibiting the authors from making the minimal data set publicity available, due to ethical issues related to participant confidentiality imposed by the Ethics Committee of the medical School of the University of São Paulo. Data from this paper are available upon request to the Ethics Committee of the Medical School of the University of São Paulo. Mailing address: 251 Dr. Arnaldo Avenue- Cerqueira César–01246-000–São Paulo–SP–Brazil. Phone: +55 (11) 3893-4401: Dr. Maria Aparecida Azevedo Koike FoLMueira.
Authors’contributions
MSC, AJFC and AGAG made substantial contributions to conception and design, or acquisition of data, or analysis and interpretation of data; MSC and MRDP have been involved in drafting the manuscript or revising it critically for important intellectual content; MSC, AJFC and AGAG given final approval of the version to be published. Each author should have participated sufficiently in the work to take public responsibility for appropriate portions of the content; and MSC, AJFC and AGAG agreed to be accountable for all aspects of the work in ensuring that questions related to the accuracy or integrity of any part of the work are appropriately investigated and resolved. All authors read and approved the final manuscript.
Ethics approval and consent to participate
This study was approved by the Ethics in Research Committee of the Medical School of the University of São Paulo (Universidade de São Paulo) (Decision #. 797,424, 09/03/2014).
Competing interests
The authors declare that they have no competing interests.
Publisher’s Note
Author details
1Preventive Medicine Department, Medical School of University of São Paulo, São Paulo, Brazil.2Institute of Social Medicine, University of Rio de Janeiro State, Rio de Janeiro, Brazil.
Received: 6 July 2017 Accepted: 20 April 2018
References
1. World Health Organization, Poz M, Gupta N, Quain E, Soucat A. Handbook on monitoring and evaluation of human resources for health. Geneva: World Health Organization; 2009.
2. García-Pérez MA, Amaya C, Otero Á. Physicians’migration in Europe: an overview of the current situation. BMC Health Serv Res. 2007;7:201. 3. OCDE. Les Migrations Internationales dês Personnels de Santé: Améliorer La
Coopération Internationalepourfaire Face à la Crise Mondiale. Paris: OCDE; 2010.
4. Wismar M, Maier CB, Glinos IA, Dussault G, Figueras J. Health professional mobility and health systems: evidence from 17 European countries. European Observer. 2011;13:1–4.
5. OECD. 2015. International Migration Outlook, 22 Sep, ISBN: 9789264243453. 6. Arah O, Ogbu U, Okeke C. Too poor to leave, too rich to stay:
developmental aid global health correlates of physician migration to the United States, Canada, Australia, and the United Kingdom. Am J Public Health. 2008;98:148–54.
7. Séchet R, Vasilcu D. Les Mobilités des Médecins en Europe: Le cas des Mobilités Entre La Roumanie et la France. Sofia, BuLMarie: Genre, Médecins, Mobilités; 2012.
8. Vujicic M, Zurn P, Diallo K, Adams O, Poz MR. The role of wages in the migration of health care professionals from developing countries. Hum Resour Health. 2004;2:3.
9. Okeke EN. Do higher salaries lower physician migration? Health Policy Plan. 2014;29:603–14.
10. Canadian Institute for Health Information. Distribution and internal migration of Canada’s physician workforce. Ottawa: Canadian Institute for Health Information; 2007.
11. Brasil. Lei n° 12.871, de 22 de outubro de 2013 2013. Programa Mais Médicos. Diário Oficial da União. 23 Out 2013, Seção 1, página 1[Online]. Available at:http://www.planalto.gov.br/ccivil_03/_ato2011-2014/2013/lei/ l12871.htm. Accessed 22 May 2014.
12. Oliveira FP, Vanni T, Pinto HA, et al. Mais médicos: um programa brasileiro em uma perspectiva Internacional. Interface - Comunicação, Saúde, Educação. 2015;19:623–34.
13. Póvoa L, Andrade M. Distribuição geográfica dos médicos no Brasil: uma análise a partir de um modelo de escolha locacional. Cadernos de Saúde Pública. 2006;22:1555–64.
14. Pinto LDS, Machado M. Médicos migrantes e a formação profissional: um retrato brasileiro. Revista Brasileira de Educação Médica. 2000;24:53–64. 15. Scheffer M, Biancarelli A, Cassenote A, Demografia Médica no Brasil. 2015.
Conselho Regional de Medicina do Estado de São Paulo e Conselho Federal de Medicina, 284 [Online]. Available at: http://www.usp.br/agen/wp-content/uploads/DemografiaMedica30nov2015.pdf. [Accessed 20 Mar 2016]. 16. Instituto Brasileiro de Geografia e Estatística. 2014. Estimativas
populacionais para os municípios brasileiros em 01.07.2014 [Online]. Available at:https://ww2.ibge.gov.br/home/estatistica/populacao/ estimativa2014/estimativa_dou.shtm.
17. Conselho Federal de Medicina. 2017. CFM. Estatística[Online]. Available at:http://portal.cfm.org.br/index.php?option=com_estatistica. [Accessed 15 Dec 2017].
18. Instituto Brasileiro de Geografia e Estatística. 2017. IBGE. População [Online]. Available at:http://www.ibge.gov.br/apps/populacao/projecao/index.html. [Accessed 15 Dec 2017].
19. Scheffer MC, Poz MR. The privatization of medical education in Brazil: trends and challenges. Hum Resour Health. 2015;13:96.
20. OCDE, Simoens S, Hurst J. The supply of physician services in OECD countries. OECD health working papers, no. 21. Paris: OCDE; 2006. 21. Scheffer MC, Cassenote AJF. A feminização da medicina no Brasil. Revista
Bioética. 2013;21:268–77.
22. Willis-Shattuck M, Bidwell P, Thomas S, Wyness L, Blaauw D, Ditlopo P. Motivation and retention of healthworkers in developing countries: a systematic review. BMC Health Serv Res. 2008;8:247.
23. El Koussa M, Atun R, Bowser D, Kruk ME. Factors influencing physicians’ choice of workplace: systematic review of drivers of attrition and policy interventions to address them. J Glob Health. 2016;6(2):020403.
24. McGrail MR, Humphreys JS. Geographical mobility of general practitioners in rural Australia. Med J Aust. 2015;203(2):92–6.
25. McGrail MR, Wingrove PM, Petterson SM, Bazemore AW. Mobility of US Rural Primary Care Physicians during 2000-2014. Ann Fam Med. 2017;15(4):322–8. https://doi.org/10.1370/afm.2096.
26. Mejia A. Migration of physicians and nurses: a world wide picture. Int. J. Epidemiol. 1978;7:207–15.
27. Bach S. Migration patterns of physicians and nurses: still the same story? Bull World Health Organ. 2004;82:624–5.
28. Forcier MB, Simoens S, Giuffrida A. Impact, regulation and health policy implications of physician migration in OECD countries. Hum Resour Health. 2004;2:12.
29. Canadian Institute for Health Information (CIHI). 2011. Supply, distribution and migration of Canadian physicians [online]. Available at:https://secure. cihi.ca/estore/productSeries.htm?pc=PCC34.