~ 15 ~ WWJMRD 2018; 4(11): 15-22
www.wwjmrd.com
International Journal Peer Reviewed Journal Refereed Journal Indexed Journal
Impact Factor MJIF: 4.25
E-ISSN: 2454-6615
Roshen Tariq Ahmed Hamdi Energy and Renewable Energies Technology Center University of Technology Baghdad, Iraq
Correspondence:
Roshen Tariq Ahmed Hamdi Energy and Renewable Energies Technology Center University of Technology Baghdad, Iraq
Solar cell Modeling Based Matlab-Software
Roshen Tariq Ahmed Hamdi
Abstract
Due to the large demand and the need to use energy to meet the requirements of life and since the sources of energy available such as coal and oil are disappearing soon, attention, studies and research are moving towards renewable and alternative energies such as wind power, hydro, thermal, and solar energies etc… as renewable sources in the future.
This research is related to solar energy as an assistant to researchers and designers who design solar cell systems. Instead of much time, effort and expense in designing and building a solar cell system, this program helps to design these systems by knowing the specifications of the solar cell which help the designers to improve their systems design. If the results are good, then you can start building the solar system, the software used is the Matlab Software, by this software the curves of power, current and voltages obtained which gives the specifications of the solar cell accurately.
Keywords: Matlab, Solar cell, modeling
Introduction
Energy is an essential element of social and economic development and it is crucial for reaching all development goals. Most of the energy produced is burning fossil fuels and therefore produces polluting pollutants that cause high environmental pollution, whether air, soil, or water [1]. The current trend towards alternative and renewable energies has become a foregone conclusion and most countries emphasize this trend to reduce the environmental risks of pollution such as global warming and climate change [2]. A standout amongst the most essential sustainable power sources is sun powered vitality.
One of the main important sources of energy that will not run out as it is environmentally friendly and clean is solar energy. The interest in solar energy and its diversified applications have increased by 20% to 25% over the past few years, and their prices are declining due to the diversity of solar technology and encouraging consumers to use solar energy.
There are many factors that affect the specifications of the solar cell such as heat, humidity, radiation intensity, wind speed and angle of the fall of the sun, these effects have a major role in the process of design and construction of the solar system, The specifications of the solar photovoltaic cell can be estimated by obtaining the cell’s specifications curves, which are the curves that link the cell's power to its output volt and current of the cell, By studying these curves, the designer can know a lot of details related to the solar cell [3].
When designing solar cells system, the variables affecting the performance of the photovoltaic cell must be accurately identified and complete information on the effect of these variables can be processed from experimental data. So, researchers have developed different software to design the many types of solar cells that describe electrical cell behavior and simulate this behavior [4]. The reference (p) presented a simulated photovoltaic (PV) model consisting of a module and the model was executed using Matlab. Ref. [5] compared the simulation results conducted by them with standard PV module characteristics in test conditions (STC). The results of the study were well agreed with the data provided by the manufacturer. So the study concluded that the simulation used is very useful for students and engineers because of its speed and ease of use to determine the performance of any photovoltaic module.
Ref. [6] provided a simple model of two-diode for a photovoltaic (PV) system able to infer equations that translated the current and voltage. The study analyzed the accuracy of the
c
model by comparing it to other studies. The experimentalresults also showed a good compatibility with the results of the voltage and current measured in practice. The simulations achieved resulted in a simplified and accurate model for use in low radiation conditions. The study recommended using equations performed using the MATLAB program.
Ref. [7] developed a numerical simulation using the Matlab program and transport matrices to solve optical equations. This method allowed for optical reflectivity, wavelength absorption, and layer thickness. The electrical cell
performance was simulated using PC1D and Silvaco. The results showed a 0.3% increase in cell efficiency.
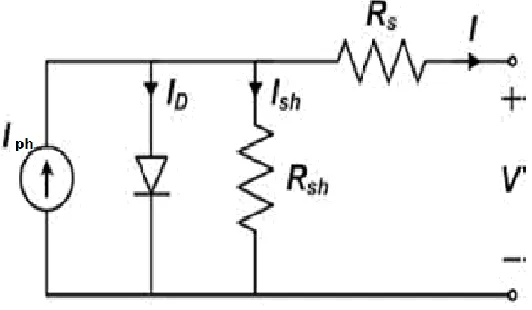
The present study aims to build and equip a simulation model using the Matlab language, through which we can obtain the PV cell performance specification curves. This simulation programming is used for the purpose to obtain these curves; the PV cell must be represented by an electronic circuit consisting of DC source, diode, Resistors, as shown in Figure (1). The current (Iph) source is connected in parallel with the diode and Rsh resistor and all components connected respectively with Rs resistor [8].
Fig. 1: PV cell model
Mathematical modeling of the PV cell
Depending on the circuit in fig. 1 and using Kirchhoff's law it is clear that:
sh d
ph
I
I
I
I
(1)Where:
I = Output current
Ish = Shunt resistance current Id = Diode’s current Iph = Current of photo cell
The current passes these segments are regulated by the voltage across finished them:
s
j
V
IR
V
(2)Where
V = Terminals voltage (volt)
Vj = Voltages of the diode and resistor Rsh (volt) Rs = Series resistance (Ω)
Using the Shockley diode condition, the current Transit of the diode is:
1
T j V n V od
I
e
I
(3)Where:
Io = Reverse saturation current of the diode. Thermal voltage is:
q
T
k
V
T
(4)VT 0.0259 volt at 25o C
n = the diode’s ideality factor (No units). q = Charge of the electron = (1.60210-19 C). k = Boltizmann's constant (1.38110-23 J/K). T = Operating temperature (Kelvin).
Employing Ohm's law, the current passes in the parallel resistor is: sh s sh j sh
R
IR
V
R
V
I
(5)Where:
Rsh = Parallel resistance (Ω).
By compensating these values in Equation 1, these variables affect the solar cell and this effect is clearly reflected on the resulting current and voltages [8, 9, 10]:
sh s V n IR V o ph
R
IR
V
e
I
I
I
T s
1
(6)Photo current is managed and evaluated by the accompanying equation:
1000
298
G
T
K
I
I
ph sh i (7)Where:
Isc = Short circuit current.
Ki = Temperature coefficient of the solar cell short circuit = 0.0017
G = Radiance (mW/m2) in this equation 7 is divided by 1000 to change units from mW/m2 to W/m2.
~ 17 ~
greatest value, known as the short circuit of the photovoltaic cell [13, 14, 15].
The (I-V) curve of the solar cell ranges between the short circuit current (Isc) when the return voltage is zero and the voltage of the open circuit (Voc) where the highest voltage value and the current value is zero. The maximum voltage that can be achieved from the cell is in the open circle case at the end of the day, and the most extreme case is in the closed circuit. Obviously neither of these conditions produces any electrical energy, but there must be a point somewhere in the middle where the solar cell can generate its maximum energy [8, 16, 17].
When the PV cell operates at open circuit case, the total current I = 0, the voltage between the two terminals represents the open-circuit voltage. Assuming that the bounded resistance between the two terminals in parallel is of sufficiently high value, and then the VOC is:
Voc=VT ln [Iph/Io]
At the second case (short circuit), this makes the entire current passes through this contact point between the two terminals, so Iph is proportionate to Isc.
d ph
I
I
I
Where:
Id = from equation 3
1
T j V n V od
I
e
I
, so:
1
T j V n V o shI
e
I
I
As mentioned above, the entire current passes through the diode due to the high shunt resistance value.
1
T n k N V q o ph se
I
I
o
1
T n k N V q sh o se
I
I
(8)The current passes through the shunt resistance can be obtained by:
n k T T E q ref o sh ref ge
T
T
I
I
1 1 3 (9) Where:Tref = Ref. temp. in (K). Eg = Silicon band gap.
For a system of photovoltaic cells consists of a group of cells connected in series symbolized as Ns, while in the case of linking the cells in parallel their numbers symbolized as Np.
cell p
ule
N
I
I
mod
AndV
module
N
s
V
cellThe final equation of the output current from a module’s is:
sh s T k n N IR V q sh p ph p R IR V e I N I N I s s 1 (10)
These above equations explain briefly the mathematical modeling of the solar cell in details, the next sections of this research is to write the software depending on these equations [8, 18, 19, 20].
Software parameters settings of the solar cell
In this research, Matlab programming was used to obtain solar cell properties by obtaining the I-V and P-V curves. These curves help designers to choose the type and specification of the solar cell. In the program shown below, the mathematical equations mentioned in the previous part of this section were used, which is a representation of the solar cell [8].
The specifications of this program, it is possible to change the variables affecting the specifications of the solar cell and several values at the same time such as temperature, radiation intensity, cell type used by changing the values of resistance etc….
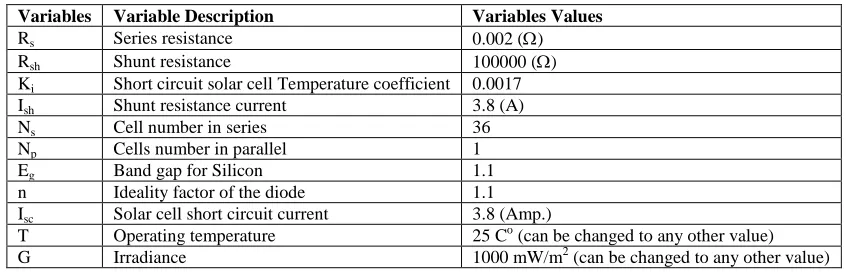
For the purpose of completing the program used in this research, a number of variables (constants) were assumed in the equations mentioned in the previous section and as shown in Table 1 [21, 22, and 23].
Table 1: Photo cell Model Parameters
Variables Variable Description Variables Values
Rs Series resistance 0.002 ()
Rsh Shunt resistance 100000 ()
Ki Short circuit solar cell Temperature coefficient 0.0017
Ish Shunt resistance current 3.8 (A)
Ns Cell number in series 36
Np Cells number in parallel 1
Eg Band gap for Silicon 1.1
n Ideality factor of the diode 1.1
Isc Solar cell short circuit current 3.8 (Amp.)
T Operating temperature 25 Co (can be changed to any other value)
Software modeling
The objective of this article is to write software by using Matlab to anticipate the performance and characteristics of the solar cell through different operating conditions and settings as shown in table (1) which can be changed
according to the system designed in order to obtain performance maps as following so the software is general purpose [8, 24].
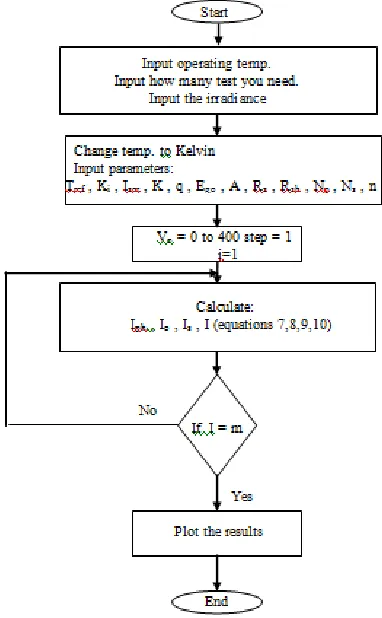
The software flowchart shown in figure 2 below:
Fig. 2: Solar cell modeling flowchart
From the above program flowchart, it will ask few questions to enter some parameters such as operating temperature, number of tests and irradiance of each one (test), the program can be improved or changed very easily by the same way by adding few steps to enter other parameters other than temperature and irradiance such as resistance values (series and shunt), short circuit current, diode ideality factor, cells of series and parallel number, shunt resistance current. In this program equation 7, 8, 9, 10 have been applied in order to get the results [25, 26].
Results and calculations
After running the program with setting described in table (1) with operating temperature equal to 25 Co, one get the results as appeared in figures (3, 4, 5).
Figure 3 demonstrates the connection between current and voltage of the photovoltaic cell for different irradiance, and from these curves the short circuit current increase when the irradiance increase and vise versa, same thing for open circuit voltage, it will increase for greater irradiance.
~ 19 ~
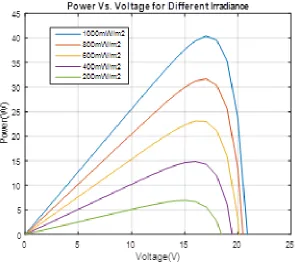
Figure 4 shows the relationship of power and voltage of the solar cell for different irradiance, from these curves the maximum output power increase when the irradiance
increase and vise versa, same thing for open circuit voltage, it will increase for greater irradiance.
Fig. 4: Solar cell power Vs. Voltage for different irradiance.
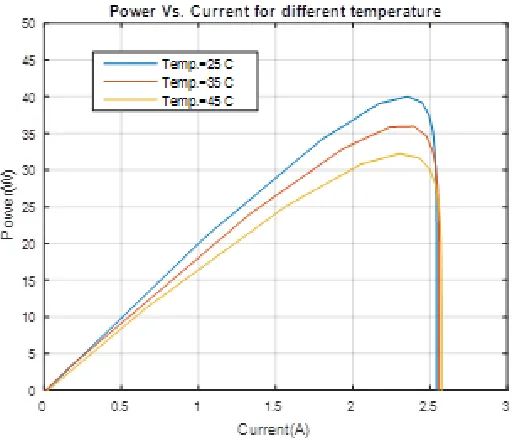
Figure 5 shows the relationship of power and current of the solar cell for different irradiance, from these curves the maximum output power increase when the irradiance
increase and vise versa, same thing for short circuit current, it will increase for greater irradiance.
Fig. 5: Solar cell power Vs. Current for different irradiance.
The above results show the impact of irradiance variation on the photovoltaic characteristics curve. Another test has been done to know the influence of temperature variation on the PV characteristics while irradiance is fixed at (1000
Fig. 6: Solar cell current vs. voltage for different temp
Fig. 7: Solar cell power Vs. Voltage for different temp.
~ 21 ~
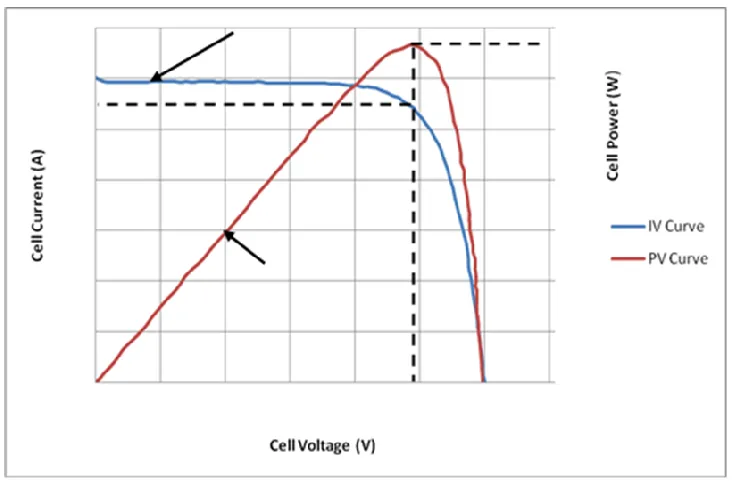
Fig. 9 represents the maximum power obtained from a solar cell; there is a specific value for both the voltage and current at which the maximum power can be obtained (Vmp and Imp). At the end, the time when the PV cell generates its maximum power as shown in the upper right zone of the left rectangle. This point is the “maximum power point” or MPP. The intersection point of the blue curve with the vertical line falling from the maximum power shows the maximum power point (MPP). This point expresses the
best specification and efficiency of the solar cell [8]. The PV Maximum power point (MPP) is situated close to the I-V characteristics curves. The comparing estimations of Vmp and Imp can be assessed from the Voc and Isc: Vmp is about (0.8–0.90) of Voc and Imp almost (0.85–0.95) of Isc. Since photovoltaic current and voltage affected by temperature variation, then the resulted power will vary with this variation [25, 26].
Fig. 9: Clarifying curve for Maximum power point calculation [27].
Conclusion
One can notice from this article that solar cell can be simulated by using Matlab-Software, also there are many other programs can be used but Matlab has the facilities that it is very easy and it have many functions can help to make changes for the parameters simply.
From this work solar cell characteristics curve obtained by the software mentioned above and by changing the hardware parameters such value of the resistances, connection of the cells, Isc, Voc and ideality factor, and environment parameters such as temperature and irradiance.
So this program help the manufacturer and designer to simulate the solar cell and make many changes till get the appropriate solar cell specification and after that they begin to manufacture it so it reduce coast and time spending. The maximum efficiency of the solar cell is achieved at the maximum output power. The suggested software declared that this maximum power can be reached by changing the solar cell parameters as mentioned above.
The program is very easy, when the program run it ask few questions about the parameters and number of tests needed and by run the program the characteristic of the solar cell is obtained, the program can improved in the future to get other facilities of the solar cell properties by adding few simple steps.
From the output curves it is seen that when irradiance increase the output power and current increase while increasing temperature is reduce the output power and output voltage of the solar cell.
Reference
1. A. M. K. El-Ghonemy, “Photovoltaic Solar Energy: Review,” International Journal of Scientific & Engineering Research, Volume 3, Issue 11, 2012. 2. Al-Maamary H M S, Kazem H A, Chaichan M T,
Changing the energy profile of the GCC States: A review, International Journal of Applied Engineering Research (IJAER), vol. 11, No. 3, pp. 1980-1988, 2016.
3. Gueymard CA. “The sun’s total and spectral irradiance for solar energy applications and solar radiation models”. Solar Energy 004;76(4):423–53.
4. L. Sandrolini, M. Artioli,U. Reggiani, “Numerical method for the extraction of photovoltaic module double-diode model parameters through cluster analysis”, Applied Energy, vol. 87, pp. 442-451; 2010. 5. D. Bonkoungou, Z. Koalaga, D. Njomo, “Modelling
and Simulation of photovoltaic module considering single-diode equivalent circuit model in MATLAB”, International Journal of Emerging Technology and Advanced Engineering, Volume 3, Issue 3, 493-502. 6. K. Ding, J. Zhang, X. Bian, J. Xu, A simplified model
for photovoltaic modules based on improved translation equations, Solar Energy, Volume 101, pp. 40-52, 2014.
7. N. Sahouane, A. Zerga, Optimization of Antireflection Multilayer for Industrial Crystalline Silicon Solar Cells, Energy Procedia, Volume 44, pp. 118-125, 2014.
Research (KJAR) | Print-ISSN: 2411-7684–Electronic-ISSN: 2411-7706, kjar.spu.edu.iq, Volume2, Issue1, DOI:10.24017/science.2017.1.4, June2017.
9. Kazem HA, Yousif J H, Chaichan M T, "Modeling of Daily Solar Energy System Prediction using Support Vector Machine for Oman", International Journal of Applied Engineering Research, vol. 11, No. 20, pp. 10166-10172, 2016.
10. [Meral ME, Dinc¸ er F. “A review of the factors affecting operation and efficiency of photovoltaic based electricity generation systems”. Renewable and Sustainable Energy Reviews 2011; 15(5):2176–84. 11. Qusay Abduljabar Jawad, Ayad Mahmood Salman,
Roshen Tariq Ahmed, “Study of using Solar Energy for Purpose Heating Building in Baghdad City”, 1st Scientific Conference Of Energy and Renewable Energy Applications, Pages: 350-364, University of Technology, 2011.
12. Mani M, Pillai R., “Impact of dust on solar photovoltaic (PV) performance research status, challenges and recommendations”. Renewable and Sustainable Energy Reviews 2010; 14(9):3124–31. 13. Roshen T. A Hamdi, “Dust impact on the photovoltaic
outcomes”, Journal of Computation and Applied Sciences IJOCAAS, Vol. 5, Issue 2, ISSN: 2399-4509, PP: 385-390, October 2018.
14. Hassan A, Rahoma U, Elminir H, Fathy A., “Effect of airborne dust concentration on the performance of PV modules”. Journal of the Astronomical Society of Egypt 2005; 13(1):24–38.
15. Alonso Garca M, Balenzategui J., “Estimation of
photovoltaic module yearly temperature and
performance based on Nominal Operation Cell
Temperature calculations”. Renewable Energy
2004;29(12):1997–2010.
16. Hudhaifa Mazin, Kazem H A, Fadhil H A, Aljunid S A, Abdulmajeed Q M, Chaichan M T, "Linear and Nonlinear Modeling for Solar Energy Prediction for Zone, Region and Global Areas", Chapter in Renewable Energy in the Service of Mankind, Vol. II, Springer, pp. 21-34, 2015.
17. Incropera FP, DeWitt DP. “Fundamentals of heat and mass transfer”. New York, NY: John Wiley & Sons Inc.; 2002.
18. Dr. Ali H. Al-Hamdani, Majed Hassan, Roshen Tariq Ahmad, “Optimal Sizing of Photovoltaic Irrigation
Water Pumping System in Samara”, Eng.
&Tech.Journal, Vol.31, Part (A), No.16, Page: 3067-3077, University of Technology, Baghdad-Iraq, 2013. 19. Al-Waeli A H A, Sopian K, Kazem H A, Yousif J H,
Chaichan M T, Ibrahim A, Mat S and Ruslan M H, "Comparison of prediction methods of PV/T nanofluid and nano-PCM system using a measured dataset and Artificial Neural Network", Solar Energy, vol. 162, pp. 378-396, 2018.
20. Uzma Qureshi, Prashant Baredar and Anil Kumar, “Effect Of Operating Parameters On The Performance Of The Hybrid Solar PVT Collector Under Different Weather Condition”, Energy Centre, Department of Mechanical Engineering Maulana Azad National Institute of Technology, Bhopal, India.
21. Al Jubori A, Al-Dadah RK, Mahmoud S, Khalil KM, Ennil AB, "Development of efficient small scale axial turbine for solar driven organic Rankine cycle", In
ASME Turbo Expo 2016: Turbomachinery Technical Conference and Exposition 2016.
22. Al-Hasan AY. “A new correlation for direct beam solar radiation received by photovoltaic panel with sand dust accumulated on its surface”. Solar Energy 1998; 63(5):323–33.
23. A.S. Golder, “Photovoltaic Generator Modeling for Large Scale Distribution System Studies”, Master Thesis, Drexel University, 2006.
24. A. Rostami, K. Abbasian, N. Gorji, “Efficiency Optimization in a Rainbow Quantum Dot Solar Cell”, International Journal on Technical and Physical Problems of Engineering (IJTPE), Issue 7, Vol. 3, No. 2, pp. 106-109, June 2011, School of Engineering Emerging Technologies, University of Tabriz, Tabriz, Iran.
25. C. M. Ong, "Dynamic Simulation of Electric Machinery using Matlab/Simulink", Prentice-Hall PTR, Upper Saddle River, New Jersey, 1998.
26. [Moafaq K.S. Al-Ghezi, "Calculate the Reflected Hourly Solar Radiation
by Mirror Surfaces of Solar Concentrators Parabolic Trough," International Journal of Computation and Applied Sciences IJOCAAS, vol. 3, No. 3, pp. 256- 260, 2017.
27. R. T. Ahmed, “Obtaining and analyzing the