International Journal of Pharmaceutical Sciences and Drug Research 2009; 1(2): 85-90
85
Research Article
ISSN 0975-248X
Formulation Development, Optimization and Evaluation of Famotidine
Floating Matrix Tablets
Patel Manish P.
1*, Patel Madhabhai. M.
2,
Patel Dipti H.
3, Patel Krishnakumar. N.
11
Arihant School of Pharmacy and BRI, S. G. Highway, Adalaj-382421, Gandhinagar, Gujarat, India
2
Kalol Institute of Pharmacy, Kalol, Gujarat, India
3
Baroda College of Pharmacy, Limda, Vadodara, Gujarat, India
ABSTRACT
The purpose of this research work was to prepare a gastroretentive drug delivery system of Famotidine. This study investigated utility of a 3-factor, 3-level Box-Behnken design and optimization process for floating tablet of famotidine with 5 replicates of center points. Amount of HPMC K4 (Hydroxy Propyl Methyl cellulose), amount of NaHCO3 and amount of citric acid were selected as the independent variables whereas total floating time (TFT), half life, % cumulative drug release at 10 hrs, and diffusion coefficients (n) were selected as dependent variables. The prepared tablets of famotidine were evaluated for dissolution study and found to follow zero order release kinetic. The responses were analyzed using ANOVA and the individual response parameters were evaluated using F test and polynomial equation was generated for each response using MLRA. The amount of HPMC K4 and amount of citric acid were found to significantly influence all response parameters selected whereas the amount of NaHCO3 has significant effect on TFT. Optimum amount of HPMC K4, NaHCO3, and citric acid is important in achieving good floating time and minimum floating lag time. It was clear from dissolution profiles that the tablets of batch F3, F7, and F12 exhibits initial burst phase during the first hour of dissolution. The burst phase was followed by a limited drug release for the rest of the period. The produced tablets exhibited good floating time and controlled drug release over a period of 12 h. The resultant data were critically analyzed to locate the composition of optimum formulations. All predicted values of response variables of optimized formulation demonstrated close agreement with the experimental data during optimization procedure.
Keywords: Famotidine, Gastroretentive floating tablet, Box-Behnken Design, Controlled release, Hydroxy Propyl Methyl Cellulose.
INTRODUCTION
The objective of the present study was to develop single unit gastroretentive drug delivery system of Famotidine. Famotidine is a histamine H2-receptor antagonist. It is prescribed widely in Active Duodenal ulcers, Gastric ulcers, Zollinger-Ellison syndrome, Gastro Esophageal Reflux Disease (GERD) and Erosive Esophagitis. It has a low biological half-life of 2.5-4.0 h. The current recommended adult oral dosage of famotidine is 20 mg twice daily or 40 mg once daily. [1] The low bioavailability (40-45 %) and short biological half-life (2.5-4.0 hrs) of Famotidine following oral administration favors development of a sustained release formulation. The gastroretentive drug delivery system can be retained in the stomach and assist in improving the oral
*Corresponding author: Mr. Manish P. Patel,
Arihant School of Pharmacy and BRI, Adalaj-382421, S. G. Highway, Gandhinagar, Gujarat, India
Tel: +919924746640 E-mail: [email protected]
sustained delivery of drugs. The aim of research work is to formulate and evaluate controlled release floating tablet of Famotidine in view to enhance bioavailability and therapeutic action. The specific objective of research includes: Formulation of GRDDS containing Famotidine, which would remain in stomach and/or upper part of GIT for prolonged period of time in view to maximize the drug release in the upper part of GIT. Employment of Box-Behnken design for formulation of GRDDS. Evaluation of the formulation for their hardness, friability, drug content, floating lag time, total floating time, in vitro dissolution
study, in vitro buoyancy study, in vivo buoyancy study and
stability study. Mathematical optimization of the variable of formulation using response surface methodology and their evaluation to obtained reliable and reproducible product. Comparison of observed values of optimized formulation with predicted values.
delivery of drugs that have an absorption window in a particular region of the gastrointestinal tract. These systems help in continuously releasing the drug before it reaches the absorption window, thus ensuring optimal bioavailability. [2] It has been reported that the oral treatment of gastric disorders with an H2 receptor antagonist like Famotidine or Ranitidine used in combination with antacids promotes local delivery of these drugs to the receptor of parietal cell wall. Local delivery also increases the stomach wall receptor site bioavailability and increases efficacy of drugs to reduce acid secretion. Hence this principle may be applied for improving systemic as well as local delivery of Famotidine, which would efficiently reduced gastric acid secretion. [3]
MATERIALS AND METHODS
Famotidine was obtained as gift sample from Intas Pharmaceuticals Ltd., Ahmedabad, Gujarat. HPMC K4 was obtained as gift sample from Zydus-Cadila Healthcare Ltd, Ahmedabad, Gujarat. Sodium bicarbonate, citric acid and Magnesium stearate were received from S. D. Fine-Chem. Limited, India. All other chemicals used were of analytical reagent grade, available commercially and used as such without further processing.
Preparation of Famotidine floating tablets:
The ingredients were weighed accurately and mixed thoroughly as per Table 3. The granules were dried in conventional hot air oven at 45°C. Drying of the granules was stopped when the sample taken from the oven reached a loss on drying (LOD) value of 1 to 3 %, as measured by a moisture balance at 105°C. The dried granules were sized through 20 meshes. The mixture was blended with magnesium stearate for 2-3 min to improve flow property. The powder was compressed into tablet weighing 250 mg using 8.75 mm shallow biconcave punches in a single punch tablet machine to a hardness of 2-4 kg/cm2.
Formulation Design (BOX-BEHNKEN DESIGN) [4]
A 3-factor 3-level Box-Behnken design was used for the formulation of tablets. This design is suitable for exploring quadratic response surface and constructing second order polynomial models. The design consists of replicated center points and the set of points lying at the midpoint of the multidimensional cube that defines the region of interest. The non linear quadratic model generated by the design in the form:
Y = X0 + X1A + X2B + X3C + X4A2 + X5B2 + X6C2 + X7AB + X8BC + X9AC + E
Where, Y is the measure response associated with each factor level combination: X0 is an intercept: X1 - X9 are the regression coefficient: A, B, C are the factor studied and E is the associated error term. The independent factors used in the design are listed in Table 1.
Table 1: Independent factors
Levels Independent variable
Low Middle High
A = Amount of HPMC K4 (mg) 50 70 90
B = Amount of NaHCO3 (mg) 20 35 50
C = Amount of Citric Acid (mg) 0 5 10
Box-Behnken designs are response surface designs, specially made to require only 3 levels, coded as -1, 0, and +1. Behnken designs are available for 3 to 10 factors. Box-Behnken design is formed by combining two-level factorial
designs with incomplete block designs. This procedure creates designs with desirable statistical properties but, most importantly, with only a fraction of the experimental trials required for a three-level factorial. Because there are only three levels, the quadratic model was found to be appropriate.
Table 2: Constraints for Optimized formulation
Name Goal Lower Limit Upper Limit
Amt of HPMC K4 minimize 50 90
Amt of NaHCO3 minimize 20 50
Amt of CA maximize 0 10
TFT maximize 3.17 12
%CR 10 hr Maximize 57.35 80
T 50 % Is target = 6.00 0.6 8.6
Diffusion
coefficient (n) Is target = 1.00 0.066 1.558
Drug content and physical evaluation
Compressed tablets were evaluated for assay, weight variation and friability according USP 24. The drug content in each formulation was determined by triturating 20 tablets and powder equivalent to average weight was added in 100 ml of 0.1 N hydrochloric acid, followed by stirring for 30 min. The solution was filtered through a 0.45 μ membrane filter, diluted suitably and the absorbance of resultant solution was measured spectrophotometrically at 265 nm using 0.1 N hydrochloric acid as blank. Amount of drug present in one tablet is calculated. The results are shown in Table 4.
Swelling Index [12]
The swelling of the polymers can be measured by their ability to absorb water and swell. The swelling property of the formulation was determined by various techniques. The water uptake study of the tablet was done using USP dissolution apparatus II. The medium used was distilled water, 900 ml rotated at 50 rpm. The medium was maintained at 37 ± 0.5°C throughout the study. After a selected time intervals, the tablets were withdrawn, blotted to remove excess water and weighed. Swelling characteristics of the tablets were expressed in terms of water uptake (WU) as
W U (%) the tablet= Weight of the swollen tablet −Initial weight of / Initial weight of the tablet × 100
In vitro buoyancy study [5]
The time taken for tablet to emerge on surface of medium is called the floating lag time (FLT) and duration of time the dosage form constantly remain on surface of medium is called the total floating time (TFT).The in vitro buoyancy
was determined by floating lag time, as per the method described by Rosa et al. The tablets were placed in a 200 ml
beaker containing 0.1 N hydrochloric acid. The time required for the tablet to rise to the surface and float was determined as floating lag time. The duration of time the dosage form constantly remained on the surface of medium was determined as the total floating time. The results are shown in Table 4.
In vitro drug release study
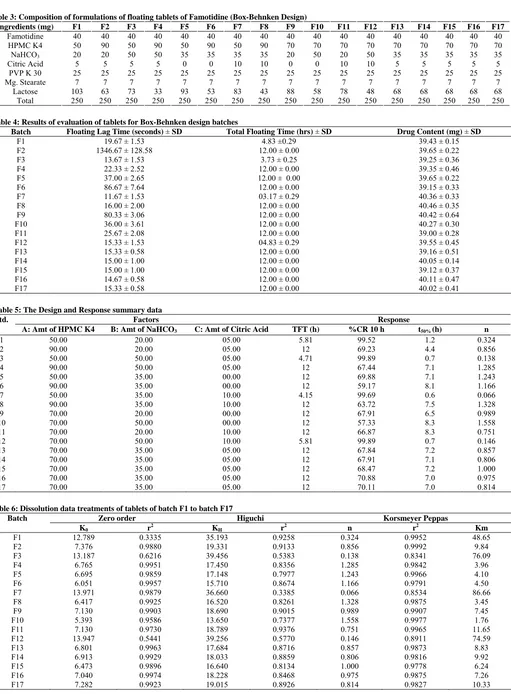
Table 3: Composition of formulations of floating tablets of Famotidine (Box-Behnken Design)
Ingredients (mg) F1 F2 F3 F4 F5 F6 F7 F8 F9 F10 F11 F12 F13 F14 F15 F16 F17
Famotidine 40 40 40 40 40 40 40 40 40 40 40 40 40 40 40 40 40
HPMC K4 50 90 50 90 50 90 50 90 70 70 70 70 70 70 70 70 70
NaHCO3 20 20 50 50 35 35 35 35 20 50 20 50 35 35 35 35 35
Citric Acid 5 5 5 5 0 0 10 10 0 0 10 10 5 5 5 5 5
PVP K 30 25 25 25 25 25 25 25 25 25 25 25 25 25 25 25 25 25
Mg. Stearate 7 7 7 7 7 7 7 7 7 7 7 7 7 7 7 7 7
Lactose 103 63 73 33 93 53 83 43 88 58 78 48 68 68 68 68 68
Total 250 250 250 250 250 250 250 250 250 250 250 250 250 250 250 250 250
Table 6: Dissolution data treatments of tablets of batch F1 to batch F17
Batch Zero order Higuchi Korsmeyer Peppas
K0 r2 KH r2 n r2 Km
F1 F2 F3 F4 F5 F6 F7 F8 F9 F10 F11 F12 F13 F14 F15 F16 F17 12.789 7.376 13.187 6.765 6.695 6.051 13.971 6.417 7.130 5.393 7.130 13.947 6.801 6.913 6.473 7.040 7.282 0.3335 0.9880 0.6216 0.9951 0.9859 0.9957 0.9879 0.9925 0.9903 0.9586 0.9730 0.5441 0.9963 0.9929 0.9896 0.9974 0.9923 35.193 19.331 39.456 17.450 17.148 15.710 36.660 16.520 18.690 13.650 18.789 39.256 17.684 18.033 16.640 18.228 19.015 0.9258 0.9133 0.5383 0.8356 0.7977 0.8674 0.3385 0.8261 0.9015 0.7377 0.9376 0.5770 0.8716 0.8859 0.8134 0.8468 0.8926 0.324 0.856 0.138 1.285 1.243 1.166 0.066 1.328 0.989 1.558 0.751 0.146 0.857 0.806 1.000 0.975 0.814 0.9952 0.9992 0.8341 0.9842 0.9966 0.9791 0.8534 0.9875 0.9907 0.9977 0.9965 0.8911 0.9873 0.9816 0.9778 0.9875 0.9827 48.65 9.84 76.09 3.96 4.10 4.50 86.66 3.45 7.45 1.76 11.65 74.59 8.83 9.92 6.24 7.26 10.33
every time. The samples were filtered through a 0.45 μ
membrane filter and diluted to a suitable concentration with 0.1 N hydrochloric acid. The samples were analyzed for drug
release against 0.1 N HCl as a blank at wavelength of 265 nm using double beam UV visible spectrophotometer. The drug release was calculated using the equation generated from Table 4: Results of evaluation of tablets for Box-Behnken design batches
Batch Floating Lag Time (seconds) ± SD Total Floating Time (hrs) ± SD Drug Content (mg) ± SD F1 F2 F3 F4 F5 F6 F7 F8 F9 F10 F11 F12 F13 F14 F15 F16 F17
19.67 ± 1.53 1346.67 ± 128.58
13.67 ± 1.53 22.33 ± 2.52 37.00 ± 2.65 86.67 ± 7.64 11.67 ± 1.53 16.00 ± 2.00 80.33 ± 3.06 36.00 ± 3.61 25.67 ± 2.08 15.33 ± 1.53 15.33 ± 0.58 15.00 ± 1.00 15.00 ± 1.00 14.67 ± 0.58 15.33 ± 0.58
4.83 ±0.29 12.00 ± 0.00
3.73 ± 0.25 12.00 ± 0.00 12.00 ± 0.00 12.00 ± 0.00 03.17 ± 0.29 12.00 ± 0.00 12.00 ± 0.00 12.00 ± 0.00 12.00 ± 0.00 04.83 ± 0.29 12.00 ± 0.00 12.00 ± 0.00 12.00 ± 0.00 12.00 ± 0.00 12.00 ± 0.00
39.43 ± 0.15 39.65 ± 0.22 39.25 ± 0.36 39.35 ± 0.46 39.65 ± 0.22 39.15 ± 0.33 40.36 ± 0.33 40.46 ± 0.35 40.42 ± 0.64 40.27 ± 0.30 39.00 ± 0.28 39.55 ± 0.45 39.16 ± 0.51 40.05 ± 0.14 39.12 ± 0.37 40.11 ± 0.47 40.02 ± 0.41
Table 5: The Design and Response summary data
Factors Response
Std.
A: Amt of HPMC K4 B: Amt of NaHCO3 C: Amt of Citric Acid TFT (h) %CR 10 h t50% (h) n
1 50.00 20.00 05.00 5.81 99.52 1.2 0.324
2 90.00 20.00 05.00 12 69.23 4.4 0.856
3 50.00 50.00 05.00 4.71 99.89 0.7 0.138
4 90.00 50.00 05.00 12 67.44 7.1 1.285
5 50.00 35.00 00.00 12 69.88 7.1 1.243
6 90.00 35.00 00.00 12 59.17 8.1 1.166
7 50.00 35.00 10.00 4.15 99.69 0.6 0.066
8 90.00 35.00 10.00 12 63.72 7.5 1.328
9 70.00 20.00 00.00 12 67.91 6.5 0.989
10 70.00 50.00 00.00 12 57.33 8.3 1.558
11 70.00 20.00 10.00 12 66.87 8.3 0.751
12 70.00 50.00 10.00 5.81 99.89 0.7 0.146
13 70.00 35.00 05.00 12 67.84 7.2 0.857
14 70.00 35.00 05.00 12 67.91 7.1 0.806
15 70.00 35.00 05.00 12 68.47 7.2 1.000
16 70.00 35.00 05.00 12 70.88 7.0 0.975
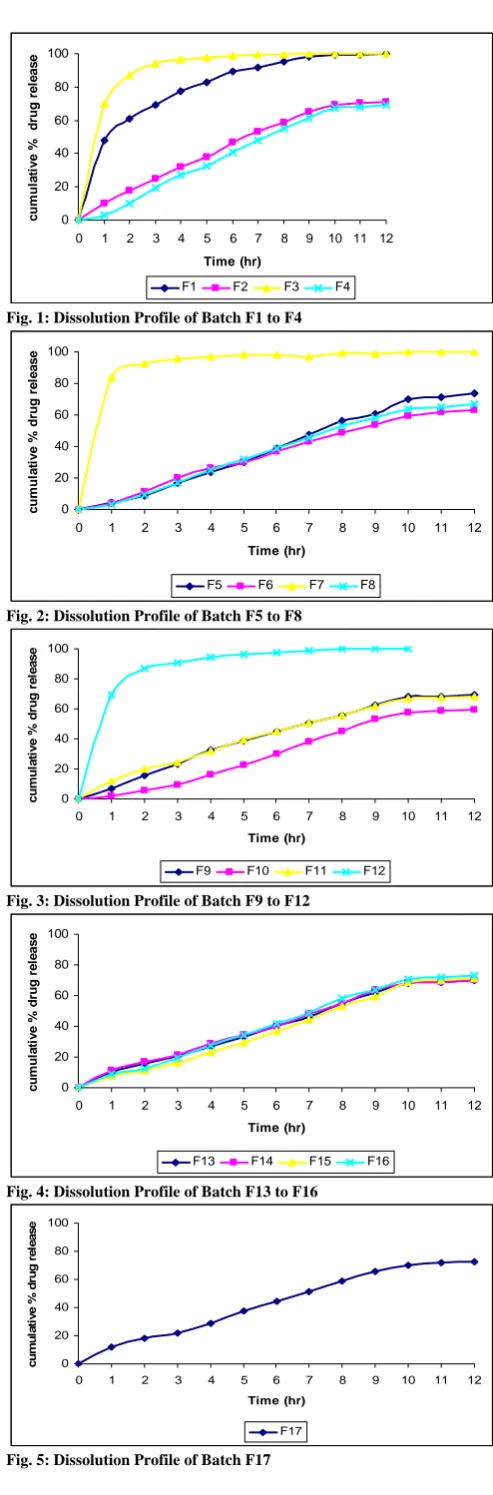
standard curve. The % cumulative drug release was calculated. The plot of cumulative percentage drug release Vs time is shown in figure 1-5.
Statistical analysis
The response surface methodology is a collection of mathematical and statistical techniques used for modeling and analysis of problems in which a response of interest is influenced by several variable and the objectives is to optimize this response. The run or formulation, which are designed based on Box-Behnken design are evaluated for the response. The response values are subjected to multiple regression analysis to find out the relationship between the factor used and the response value obtained. The response values subjected for this analysis are Total floating time, T50%, % CR10 hrs and Diffusion coefficient (n). The Diffusion coefficient (n) obtained after fitting the release rate to Korsmeyer and Peppas model. The curve fitting results of the release rate profiles of the formulation are given in Table 6. The multiple regression analysis was done using DESIGN EXPERT 6.0.11 (STAT-EASE) demo version software, which specially meant for this optimization process. Analysis of data was carried out using ANOVA and the individual parameter was evaluated with F-test. Using the regression coefficient of factor, the polynomial equation for the each response is generated. [8]
Drug-Polymer interaction studies
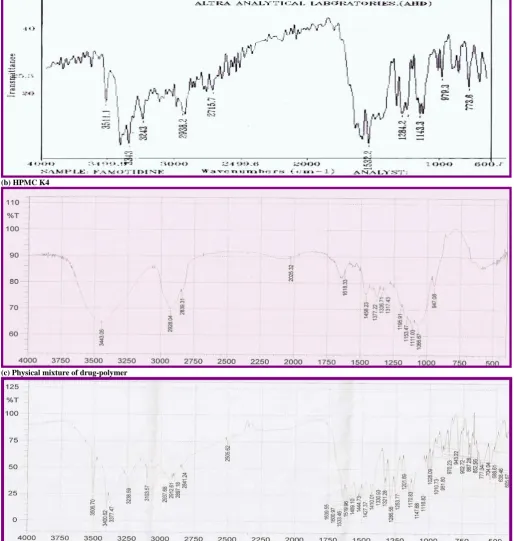
The IR analysis of the sample was carried out for qualitative compound identification. The pellet of approximately 1 mm diameter of the drug was prepared grinding 3-5 mg of sample with 100-150 mg of Potassium Bromide in pressure compression machine. The sample pellet was mounted in IR compartment and scanned at wavelength 4000 cm-1 – 600 cm -1. The IR spectrum is depicted in figure 6.
Kinetic treatment of dissolution profiles
The in vitro release data of all formulations were also
subjected to model fitting analysis to know the mechanism of drug release from the formulations by treating the data according to zero order,[9] Higuchi[10] and Korsemeyer-Peppas equation.
Optimization [4], [11]
The optimized formulation was obtained by applying constraints (goals) on dependent (response) and independent variables (factors). Constraints for responses and factors are shown in Table 2. By utilizing DESIGN EXPERT 6.0.11 (STAT-EASE) demo version software, we got one solution for optimized formulation. The optimized formulation is prepared and evaluated for total floating time, T50%, % CR 10 hrs, diffusion coefficient (n). Observe response value of the optimized formulation is compared with predicted value. RESULTS AND DISCUSSION
On the basis of preliminary identification test it was concluded that the drug complied the preliminary identification. There was no drug polymer interaction, which was confirmed by the IR spectra of drug and physical mixture. The IR spectrum is depicted in figure 6. The physical parameters of tablets showed that the tablets of all batches had desirable physical characteristics. All the batches of tablet produced (except batch F2) were found to exhibit short floating lag times (maximum floating lag time recorded was 87.67 ± 6 second). The short floating lag time can be due to presence of sodium bicarbonate and citric acid. Sodium bicarbonate and citric acid were used in combine to minimize
0 20 40 60 80 100
0 1 2 3 4 5 6 7 8 9 10 11 12
Time (hr)
c
u
mu
la
ti
v
e
% d
ru
g
r
e
le
a
s
e
F1 F2 F3 F4
Fig. 1: Dissolution Profile of Batch F1 to F4
0 20 40 60 80 100
0 1 2 3 4 5 6 7 8 9 10 11 12
Time (hr)
c
um
ul
a
ti
v
e
%
dr
ug
re
le
a
s
e
F5 F6 F7 F8
Fig. 2: Dissolution Profile of Batch F5 to F8
0 20 40 60 80 100
0 1 2 3 4 5 6 7 8 9 10 11 12
Time (hr)
cu
m
u
la
ti
ve %
d
ru
g
r
e
le
a
s
e
F9 F10 F11 F12
Fig. 3: Dissolution Profile of Batch F9 to F12
0 20 40 60 80 100
0 1 2 3 4 5 6 7 8 9 10 11 12
Time (hr)
cu
m
u
la
ti
ve %
d
ru
g
r
e
le
a
s
e
F13 F14 F15 F16
Fig. 4: Dissolution Profile of Batch F13 to F16
0 20 40 60 80 100
0 1 2 3 4 5 6 7 8 9 10 11 12
Time (hr)
c
um
u
la
ti
v
e
%
dr
ug r
e
le
a
s
e
F17
Figure 6: FT-IR spectra of (a) Drug (b) HPMC K4 and (c) Physical mixture (a) Drug
(b) HPMC K4
(c) Physical mixture of drug-polymer
the lag time in fabrication of GRDDS. The tablet of batch F2 exhibited a longer floating lag time of 22 min. This can be due to the presence of NaHCO3 at low level and HPMC K4 at high level. The high level of HPMC K4 would possibly prevents the entry of media into the tablet matrix and prolong the floating lag time. All batches of tablet were found to exhibit maximum floating time i.e. 12 hrs. Tablets of batch F1, F3, F7 and F12 exhibited short floating time i.e. 3-5 hrs because they eroded faster in media due to high amount of NaHCO3 and citric acid in coupled with less amount of HPMC K4. Value of “Prob > F” less than 0.05 indicate factor A, B, C, AC, BC had significant effect on total floating time.
e above results it can be
These might be due to at low level of HPMC K4 (50
lease in these cases was known to
d formulation was considerably reduced thereby ubstantially cutting down the expenditure on time and
Intas
samples of
amotidine, to Zydus-Cadila Healthcare Limited,
rat for providing HPMC K4.
REF
12. d
release, swellable and bioadhesive gastroretentive drug delivery system for ofloxacin. Int J Pharmaceutics 2006; 304: 178–184. dosage form. Thus, the viscosity of the polymer had major
influence on swelling process, matrix integrity, as well as floating capability, hence from th
concluded that linear relationship exists between swelling process and viscosity of polymer.
So the presence of optimum amount of HPMC K4, NaHCO3, and citric acid is important in achieving good floating time and minimum floating lag time. Incorporation of sodium bicarbonate helps to produce carbon dioxide gas which entrapped inside the hydrophilic matrices leads to increase in volume of dosage form resulting in lowering of density and dosage form starts to float. The relationship between the dependent and independent variables was further elucidated using contour and response surface plots. Contour plot shows that at a fixed level of NaHCO3 (35 mg), TFT decrease at low level of A (amount of HPMC K4) and high level of C (citric acid). However at high level of A (amount of HPMC K4) TFT remains unaffected with change in amount of citric acid.
mg), matrix unable to remain intact with increase in citric acid.
It was clear from dissolution profiles that the tablets of batch F3, F7, and F12 exhibits initial burst phase during the first hour of dissolution. The burst phase was followed by a limited drug release for the rest of the period. The initial burst release can be attributed to low levels of HPMC K4 combined with high levels of NaHCO3 and citric acid. It was observed during the dissolution studies that tablets of all three batches eroded quickly with increased effervescence. Other formulation showed a linear pattern of Famotidine release from floating tablet. However simultaneous increasing amount of HPMC K4 and amount of citric acid had no significant effect on % CR10 hrs and T 50 %. The interaction effect of B and C at a fixed levels of A indicated that % CR10 hrs increases whereas T 0.5 decrease at high levels of both B and C. This can be attributed to formation of compact matrix with increasing level of HPMC K4 and porous matrix with increasing level of NaHCO3 and citric acid. The dissolution data of most of formulation fitted well into zero order release kinetics. The data fitment of the dissolution profiles done according to Korsmeyer-Peppas model (Table 1) indicating the values of diffusion coefficients obtained range from 0.06 to 1.55. The formulation F1, F3, F7 and F12 which exhibited an initial burst phase showed a low value of diffusion coefficients ranging from 0.06 to 0.32. Low level of HPMC K4 coupled with high amount of NaHCO3 and citric acid for these formulations was responsible for the incompatibility of the system to control the release of Famotidine from the GRDDS. Other tablet formulations gave relatively higher n value for diffusion coefficient ranging from 0.75 to 1.55. The mechanism of drug re
follow case II transport mechanism i.e. characterized by both erosion and diffusion.
For the optimization of floating tablets of Famotidine constraints was fixed for all factors and response. Constraints were set according to formulation of floating tablets using minimum amount of excipients, which will give desired response values. In the present study the aim was zero order drug release from the tablets and so that the diffusion coefficient was targeted to 1. The dissolution data of optimized formulation fitted well into zero order release kinetics (r2 = 0.9942). The diffusion coefficient (n) value
0.93 i.e. nearest to 1 indicated that floating tablets follow zero order kinetics of drug release. The mechanism of drug release in these cases was known to follow case II transport mechanism i.e. characterized by both erosion and diffusion. Stability studies were performed for optimized formulation and it was found that formulation was stable for 3 months at 40 ° C/ 75 % RH. The formulation was found to be stable in terms of morphology, drug content and drug release. Gastric retention time of Famotidine can be increased by formulating it in a floating dosage form using optimum amount of HPMC K4, NaHCO3 and citric acid. The produced tablets exhibited good floating time and controlled drug release over a period of 12 hrs. It was concluded that the floating tablets released drug in stomach in view to enhance bioavailability of Famotidine. It can be concluded that by the application of experimental design (Box-Behnken design) and optimization technique, optimized formulation can be obtained with minimum expenditure time and money. Floating tablets of Famotidine were formulated according to Box-Behnken design. It can be concluded that a floating tablet with good floating and controlled release property can be obtained by optimizing amount of HPMC K4, NaHCO3 and citric acid. The number of experimental trials carried out to produce the optimize
s money.
ACKNOWLEDGMENTS
Authors are thankful to Pharmaceuticals Ltd.,
Ahmedabad, Gujarat, India, for providing gift F
Ahmedabad, Guja
ERENCES
1. Reynolds JEF. Martindale the Extra Pharmacopoeia, The Royal
Pharmaceutical Society: London, 1996, 1218-20.
2. Singh B, Kim K. formulation and evaluation of famotidine
floating tablets. J Control Release 2000, 63: 235-59.
3. Coffin M, Parr A, inventors. Glaxo Inc. Ranitidine solid dosage
form. US patent 5 407 687. April 18, 1995.
4. Nazzal S, Khan MA. Response surface methodology for the
optimization of ubiquinone self-nanoemulsified drug delivery system. Pharm Sci Tech 2002; 3: 1-9.
5. Rosa M, Zia H, Rhodes T. Dosing and testing in-vitro of a
bioadhesive and floating drug delivery system for oral application. Int J Pharm 1994; 105: 65-70.
6. The United State Pharmacopoeia 24, Asian edition, Rockville
MD: United state pharmacopoeia convention Inc, 2000.
7. Pillay V, Fassihi R. Evaluation and comparison of dissolution
data derived from different dosage forms: An alternative method. J Control Release 1998; 55:45-55.
8. Prakobvaitayaki M, Vimmannit V. Optimisation of
polylactic-co-glycolic acid nanoparicles containing Itraconazole using 23 factorial designs. AAPS Pharm Sci Tech 2003; 4: 1-9.
9. Costa P, Lobo MS. Modeling and comparison of dissolution
profiles. Eur J Pharm Sci 2001; 13: 123–33.
10. Colombo P, Bettini R, Santi P, Peppas NA. Swellable matrices
for controlled drug delivery: Gel layer behavior, mechanisms and optimal performance. Pharm Sci Tech 2000; 3: 1-12.
11. Chuch HR. Optimization of sotalol floating and bioadhesive
extended release tablet formulations. Drug Dev Ind Pharm 1995; 21(15): 1725-47.