Micro-Simulation Study on Pedestrian Flow at
Railway Station
Prafulla Patange Vinay Bhakhtyapuri
M. Tech Scholar Assistant Professor Department of Civil Engineering Department of Civil Engineering G. H. Raisoni College of Engineering, Nagpur G. H. Raisoni College of Engineering, Nagpur
Abstract
An enormous growth has been observed in number of passengers using railway transportation due to day to day urbanization. It results into increase in number of passenger using railway station platform; usually this users are defined as pedestrian flo w at platform. During arrivals and departure of trains at urban travel station, there is very high congestion due to pedestrian flo w. Pedestrian flow goes to peak level with quick variation and brings about movement of pedestrian streams and may prompt to risky pedestrian facility. The analysis of this pedestrian flow in some circumstances in point of the gravity of situation turning unfavorable, subsequently for the proficiency layout and also compelling operations, modeling of pedestrian flow for such condition is important to increase pedestrian level of service. Simulation model of pedestrian network at Nagpur railway station was developed with the help of PTV Vissim 9 and analysis was carried out. The results show that difference between field study and simulation study is 15% and 10% on passageway and ramp respectively.
Keywords: Pedestrian Flow, Pedestrian Facility, Arrival of Trains, Simulation Model, Railway Station
________________________________________________________________________________________________________
I. INTRODUCTION
In India, transportation web consists of four major modes of transportations such as roadway, railways, waterways and airways, out of those Airways and Waterways are developed mode and Roadways and Railways are in developing conditions. Considering environmental aspect; use of non-motorized mode transport i.e. walking, cycling & public transport plays important role in transportation system to reduce traffic congestion and accidents occurrences on road. Walking indirectly helps to reduce gas emission (pollution) which depends on changing of climate, global warming & poor air quality. Pedestrian flow generally interactive with pedestrian and other facilities, so, it required well-planned/systematically should be done. It can be accomplished by executing system of pedestrian flow. The research can performed by solving different problems comes in under pedestrian behaviour and pedestrian accumulation. Now-a-days simulation study is extremely fundamental of pedestrian movement investigation in purpose of planning and outlines of open transport and also in private zone. Simulation tools beneficially at shows vantage in conditions like heterogeneous traffic such as public transport (railway stations or bus stand), sports stadium, entertainment cinemas halls, market places and different areas. Simulation model can be designed by three steps like basic information of model for layouts drawing plans and O-D matrices of pedestrian trips, dynamic modeling for data standardization and determination, and analysis phase simulation run show in 2D and 3D views and output gives in form of graphs, diagrams or charts etc.
The microscopic software considers all characteristics as we depends and provides appropriate results in designing/planning of new facility. Open transportation frameworks, generally passengers/pedestrian walks in horizontally, vertically or inclined direction on different infrastructure such as platform, ramps, escalators, elevators, stairways and passageways useful for to reach pedestrian on departure point. If we focus on vertical or inclined infrastructures, many conjunction or queue formed due to heavy pedestrian traffic. So, it required to give sufficient infrastructure like perfect location of starting inclination, proper layouts or plans for planning or designing phases. The research work we will be done in two phases. In the first phase, we study on walking behavior of pedestrian with refers to different speeds and densities by using video-graphic camera which helps to plotting graphs for analysis of real-time pedestrian traffics in public transportation infrastructures. In second phase, by creating smaller scale reproduction display by utilizing smaller scales recreation programming i.e. PTV VISSIM. To get appropriate result we will observe on field study are analysis using simulation model. There are many simulation tools software’s are developed for making models namely as Viswalk, Simwalk, Vissim, PedFlow, Simwalk Pro, NOMAD Model, LEGION, STEPS etc.
II. LITERATURE SERVEY
higher than as compared to LR station. It was also showed that in MTR station pedestrian walk quicker than KCR station. Hermant el, at.(2010) Derived classification of stations organized by utilizing pedestrian travel simulation model. Now a day pedestrian convenience property, pedestrian position on moving times impact of walker on railway station arrangements can be done by recreation show. This research work site is selected at several railway stations in South Africa country. Author mainly focused on two parameters of pedestrian such as Age and gender. Method is adopted by vissim software for analyzing micro-simulation outputs of velocity, flow rate of pedestrian and thickness in given time interim for that chose zones. Author shows that microscopic simulation gives helpful for modeling fundamental interactions between inconsistent of pedestrian flow pattern. Shaha et, al. (2013) Examined on conduct of walker stream on stairways of various measurements. Creators mostly centered on pedestrian streams, baggage and entries of prepare. Study is carried out at Vadodara railway station, India. On that railway station facility is selected on four different stairways with connected to their respective platforms. Analysis of data is done for different parameters such as movement of arrivals of train & pedestrian flow with respect to arrivals of trains. Presenting distinctive relations, for example, Speed-stream, speed-thickness and stream thickness and concluded that; at afternoon time pedestrian walks faster than evening time and pedestrian walking with luggage is normal speed of walkers. Brahmbhatt et, al. (2015) Examine on estimation of walker stream with chose parameters. Think about zone is chosen at Dakor, situated in dist. Kheda, Gujarat. For this study firstly indentifying peak hour for pedestrian flow then secondly analyzing the pedestrian space, speed, low & density in peak period after lastly they was check benefit level for person on foot gathering as direction by roadway limit manual 2000. For information gathering period essential information is taken from video recording position during 8.10am to 12.16pm & after secondary data collected as general details & AutoCAD drawing map of Dakor town form Dakor Nagarpalika. Result was compared with both national & international standards of level of service & found that Level of service is “E”. Shah el, al. (2015) Understand the commuter flow behavior on stairways. Authors mainly focused on movement of pedestrian traffic on stairways during peak time. This review is investigation utilizing key relations of speed, stream and thickness. Amid this exploration, is directed at Dadar railway station, Mumbai as a review range. Study area is fully busy during morning & evening time. Video-graphical strategy is embraced for information accumulation for development of pedestrian volume similarly; geometric dimension is also note down. Authors conclude that, 0.45 ped/m2 is free walking speed, 0.45 ped/m2 to 4.0 ped/m2 is speed decrease with increase density & 4.0 ped/m2 to 4.5 ped/m2 is speed becomes constant of pedestrians.
III. THEORETICAL CONSIDERATION
Site Selection
Nagpur is the one of the largest city and second capital of Maharashtra state in India. It is located center of country, so all trains travelling from four directions crosses Nagpur railway station. It has almost 244 passenger trains arrivals and departure in one day and over 106000 pedestrian’s arrivals or boarding on that station. So we can say that this railway stations is biggest and busiest one of the railway station in India. Mainly data collection is done by primary method such as manual dimension and video-graphic technique.
Table – 1
Manual Dimensions for Selected Facility Facility Description Nagpur Station Passageway
Length (m) 25
Width (m) 2.5
Ramp
Total Length (m) 16 Inclined Trap length (m) 22
Width(m) 2.25
Slope (Degree) 30
Data was extracted to get the pedestrian flow rate, density and walking speed values. Firstly Pedestrian flow calculated by number of pedestrian crossing selected line of sight over the width of pedestrian passageway in 6o second interval was counted. Now to compute of pedestrian density, the number of passengers counted by five instants during 60 seconds recorded and that arithmetic mean of five numbers gives value of pedestrian presented in observed area. Finally speed is calculated by space mean speed type, all the types of pedestrian crosses the lines must be counted. Pedestrian speed was calculated watched length of the facility partitioned by the normal travel time, communicated as meter per second (m/s) or meter per min.
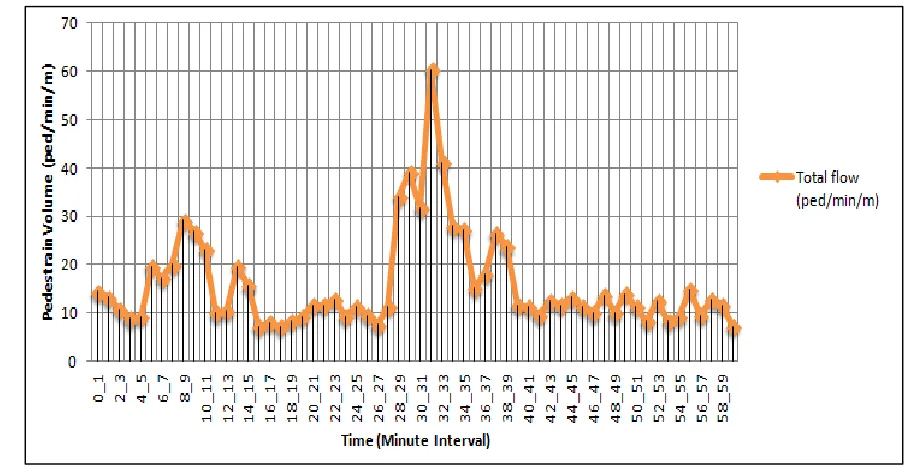
Arrival Rate of Pedestrians
Fig. 2: Pedestrian Flow during Peak Hour
Normally, all reaching passengers are in hurry to leave the station. Be that as it may, pedestrians carry with luggage and different in age are directly affected to walking speed. In the present review, flow was observed in peak hour timing for consequent to arrivals of train. Flow counted by one minute interval divided by width of facility gets pedestrian volume in Ped/min/m as shown in fig. 2. The network model of pedestrian facility like passageway and ramp requires pedestrian flow for analysis, following table shows the data input done in the software.
Table – 2
Data Required for Micro-Simulation Facility Flow (ped/hr) Speed (km/hr)
Passageway 2379 1.05
Fig. 3: Relative Flow of Pedestrians
There are three different types of pedestrian consider for research work such as male, female and child. Majority of male pedestrian are more as compare to other pedestrians, the above chart provides information about the same.
Pedestrian Simulation Software
Planung Transport Verkehr is germane company organized different software’s, for examples Vissim, Visum, Viswalk etc. Ptv Vissim software gift us to done micro-simulation and of all the pedestrian and vehicles as individually. Vissim has many outcomes gives us like Area optimization, pedestrian behaviour, extraction and analysis, outline and optimize mass event, routing path etc can be easily done.
Fig. 4: Network Model in Vissim Software
IV. RESULT AND DISCUSSION
Table – 3
Comparison of field study with simulation study of passageway Parameter Speed (km/hr) Density (ped/m2)
Field Study 1.05 0.81 Simulation Study 1.33 0.58 Ramp No. 1
Fig. 5: Evaluation Graph of Passageway
The passageway of the study area is analysed by five different simulation run of same input in PTV Vissim with random seed 42,43,44,45 and 46 respectively this is represented on X-axis and the evaluated speed and density are shown on Y-axis in Comparison with different simulation run. The graph represent that when density decreases; speed increases.
Table – 4
Comparison of Field study with Simulation Study of Ramp Parameter Speed Density
Field Study 2.92 0.86 Simulation Study 2.56 1.2
Fig. 6: Evaluation Graph of Ramp 1 and Ramp 2
The ramp is analyzed as that of passageway y with five different simulations run and there results are presented in graphical format as Fig. 6.
V. CONCLUSION
REFERENCES
[1] Lam W.H.K., and Cheung C.Y. (2000), “Pedestrian speed/flow relationship for walking facilities in Hong Kong”. Journal of Transportation Engineering.126:343-349.
[2] Hermant L.F.L., Gersigny M.R., Hermann R., and Ahuja R. (2010), “Applying Microscopic Pedestrian Simulation to the Design Assignment of various Railway Stations in South Africa.” Southern African Transport Conference, 978-1-920017-47-7.
[3] Shaha, J., Joshib, G. J. and Paridac, P. (2013), “Behavioral Characteristics of Pedestrian Flow on Stairway at Railway Station.” Procedia - Social and Behavioral Sciences, 104 (2013) 688 – 697.
[4] Brahmbhatt C., Zala L.B., and Advani M. (2015), “Measurement of Pedestrian Flow Parameters – Case study of Dakor, Gujarat.” International Research Journal of Engineering and Technology, p-ISSN: 2395-0072.