INTERNATIONAL JOURNAL OF PHARMACEUTICS & DRUG ANALYSIS VOL. 4 ISSUE 1, 2016; 1 –11; http://ijpda.com; ISSN: 2348-8948
1
RESEARCH ARTICLE
DESIGN, DEVELOPMENT
AND VALIDATION OF
ANALYTICAL METHOD
FOR
AMLODIPINE-COPPER COMPLEX
USING UV –VIS
SPECTRO-PHOTOMETRY
PRASHANT L PINGALE, GARIMA KUMAR
Assistant Professor, Department of Pharmaceutics, GES’s Sir Dr. M.S. Gosavi College of Pharmaceutical
Education & Research, Nashik, Maharashtra, India 422005.
Date Received: 26th December 2015; Date Accepted: 4th January
2016 Date published: 15th January 2016
Email: [email protected]
Abstract: To develop spectrophotometric method for the determination of amlodipine besylate by forming com-plex with copper ion.Secondly, to develop a method that would be an easy, economical and accurate method as compared to other processes. The materials used were of laboratory grade and the method used was complexation with the potent API (Amlodipine besylate). The results showed that the complex was developed by using acetate buffer pH4.7 in a fixed ratio (1:1.25) with copper sulphate. Thus, it was concluded that the complex formation with copper reduced the photolytic degradation as observed in the bulk analysis of amlodipine by using UV Vis spectro-photometry. The developed method was found to be sim-ple, accurate and economical for routine analysis.
Key words: Amlodipine, UV Vis- spectrophotometry, Photodegradation, Complexation
INTRODUCTION:
The objective was to develop a method that would reduce Photodegradation and thus, reduce the development of photo degraded products of amlodipine which do not have any pharmacological activity. Amlodipine besylate is
a calcium channel blocker used for treatment of hyperten-sion and angina pectoris; it is a very potent drug and is marketed as the benzene sulfonic acid salt commonly known as besylate. It is a 1, 4-Dihydropyridine calcium channel antagonist; thus it has a high tendency to get de-graded when exposed to light. It gets dede-graded by oxida-tive aromatization of dihydropyridine fragment to the pyridine moiety. It is one of the main degradation path-ways of molecules belonging to 1, 4- dihydropyridine family. They get degraded both in solution and in solid state. Drugs of this family are known to absorb intensive-ly in the UV-A region and are also known to be photo-labile.
As the API is photo-labile it becomes difficult to carry out routine analysis. It is also observed that the photo-degraded products of amlodipine do not have any phar-macological activity; thus it becomes necessary to reduce the photo-degradation of the API for pharmaceutical do-sage form analysis. For this purpose the API needs to be protected by using protective agents. The complex forma-tion is also a method which helps to reduce this photo-labile property of the API.[8]
Literature survey showed that various attempts are made to form complexes with different methods and complex-ing agent which could reduce the photo-degradation of amlodipine. These could be explained as follows:
• Amlodipine inclusion complexes: The inclusion complexes were formed with β-cyclodextrin by using cyclic voltammetry and square wave voltammetry which studies the electrochemical activity of the complex formed. It was reported that photo-degradation was reduced by this method. This me-thod is tedious, expensive and time consuming; thus could not be applied for routine analysis.
• Amlodipine charge transfer complex: The charge transfer complexes were formed by using p-chloranilic acid in 1, 4 dioxan dissolved in chloro-form. It was not concluded that the method reduced photo-degradation. The method was applied to pharmaceutical dosage form and it was found that simple excipients did not interfered when analysed using Uv- spectrophotometry.
Prashant LP et al, Int J. Pharm. Drug. Anal, Vol: 4, Issue: 1, 2016; 1-11
Available online at http://ijpda.com
2
From these literature surveys, it was concluded that the photo-degradation of amlodipine can be avoided by complex formation but these methods cannot be em-ployed for routine analysis as they require special equip-ment or chemicals or a special condition.In the present study, an attempt is made to overcome photolytic degra-dation of the API alongwith keeping the method simple, less time consuming and also economical. Amlodipine – copper complex is formed by using acetate buffer pH 4.7 instead of organic solvent such as methanol. [8,10,12]
MATERIALS AND METHOD:
Spectral runs were made carried on Perkin Elmer UV/Vis spectrophotometer Lambda 25 was employed. Glasswares used for each procedure were soaked overnight in a mix-ture of chromic acid and sulphuric acid then were rinsed thoroughly with double distilled water. These were then dried in hot air oven at a suitable temperature. This was basically done to avoid any kind of impurities which could lead to problems while developing of the method. Amlodipine besylatereference standard for the bulk anal-ysis were provided as a gift sample from industry. The complexing agent copper sulphate and sodium trihydrate acetate were of analytical grade and were procured from Ranekem. Other reagents like Methanol were of HPLC grade, Distilled water, 0.1N Hydrochloric acid from ana-lytical reagents, 0.1N NaOH Ranekem, 3% H2O2 from ana-lytical reagents were all of anaana-lytical grade. All the solu-tions prepared were protected from light by keeping them in dark and wereanalysed on the day of preparations.
EXPERIMENTAL WORK
Preliminary solubility studies: A small quantity of Am-lodipine drug was dissolved in various solvents such as Methanol, Distilled water, various buffers, 0.1N HCl, 0.1N NaOH. By the solubility studies it was determined that amlodipine was freely soluble in Methanol, Slightly so-luble in Distilled water and Acetate buffer pH 4.7 and also other solvents.[7]
Preparation of Standard stock solution: The stock solu-tion was prepared by weighing 10 mg of Amlodipine; this formed a solution of 1000µg/ml. From the stock solution 1 ml was withdrawn in a 10 ml volumetric flask which was made up with the mixture reagent solution (Acetate buf-fer pH4.7 and copper sulphate) to obtain a concentration of 100µg/ml solution. Different aliquots of the solution was taken in the range 1-2ml in 10 ml volumetric flask and the volume was made up withthe mixture reagent solution (Acetate buffer pH4.7 and copper sulphate) to obtain the concentrations 10-20µg/ml; scanning ranges were finalized and it was scanned in the ranges 500-300 nm, to determine the complex formation of the API.
Determination of λmax: From the stock solution a work-ing standard was prepared. The absorption spectrum for amlodipine-copper complex was recorded by using 10µg/ml and the maximum absorbance was found to be at 365 nm. The calibration curve for amlodipine–copper complex was prepared in concentration range of 10-20 µg/ml at the selected wavelength by diluting the stock solution of the API. The plots of beer’s law were plotted in figure 1 and the absorbance values are given in table I
Table 1: Absorbance values of calibration curve Concentration (µg/ml) Absorbance (A)
0 0
10 0.159
12 0.177
14 0.202
16 0.226
18 0.256
20 0.272
Preparation of Amlodipine-Copper complex
For preparation of Amlodipine copper complex a study of suitable solvent in which the complex could be formed the solvents were selected on the basis of their solubility of the API and the complex was formed in liquid form and was determined by the chromic shifts observed in the UV Spectrum.[1]
Procedure For this purpose the complex formation was performed with methanol and distilled water first, no results were found the complex was not formed in these solvents. After this the third trial was performed using a mixture of the complexing agents (Copper sulphate and Acetate buffer pH 4.7) in a specific ratio of 1:1.25. For the purpose of the study the complex was formed in all the three solvents using following procedure:[5]
1 ml of stock solution was added to a 10 ml volumetric flask
To this the complexing agents were added in the se-quence copper sulphate (2 ml) and then acetate buf-fer pH 4.7 (2.5 ml)
This was then made up to the required volume using the solvents methanol, distilled water and mixture for each trial respectively
Method Validation:
The method was validated with reference to linearity, range, accuracy and precision, and Robustness
Linearity
Prashant LP
complex was found to be in the range of 10 libration curve is as shown in figure 1.
Accuracy
The accuracy of the proposed method was tested by r covery studies at 80%, 100%, and 120%. This was pe formed by addition of a known amount of complex co centration of 10µg/ml. The recovery studies were pe formed to determine the accuracy of the proposed m thod. The results are shown in table 2.
Precision
The precision is measure of either the degree of reprod cibility orrepeatability of analytical method which is e pressed as the standard deviation, relative sta
ation or coefficient of variance of a series of measur ments. It is used as an indication of random error in an lytical method development. For this reason inter and intra-day precision is done using six replicates to check repeatability (precision) of the proposed method.
Robustness
The robustness of the method was carried out by chan ing the ratio of the solvent system of the proposed m thod of copper sulphate and acetate buffer pH4.7 as 1:1 and 1.25:1.[26]
SIAM (Stability indicating analytical method)
A stock solution containing 10 mg amlodipine in 10 ml of mixture of copper sulphate and acetate buffer pH 4.7 was prepared; which was diluted to prepare a stock of conce tration 100µg/ml. The stock prepared was used for dete mination of forced degradation of complex under diffe ent conditions to provide an indication of the stability indicating propertyand specificity of the proposed m thod. In all degradation studies, the absorbance of the complex was measured and the amount ofdegraded co plex was calculated.[17]The procedures for various d gradation studies are as follows:
Acidic degradation:
For this type of degradation studies 0.1 N HCl was used. 1 ml of the stock solution was taken in a 10 ml volumetric flask and was then made upto 10 ml with 0.1 N HCl and was kept for heating at 60oC for 4 hrs. The samples were withdrawn at 0,1,2,4 hrs and absorbance was determined to analyse the extent of degradation of the complex.
Alkali degradation:
For this type of degradation 0.1N NaOH was used.1 ml stock solution was taken in a 10 ml volumetric flask and was then made upto 10 ml with 0.1 N NaOH and was kept for heating at 60oC for 4 hrs. The samples were wit drawn at 0,1,2,4 hrs and absorbance was determined to analyse the extent of degradation of the complex.
Oxidative Degradation:
For this type of degradation 3% H2O2 was used.1 ml of stock solution was taken in a 10 ml volumetric flask and was then made upto 10 ml with 3% H2O2 and was kept for heating at 60oC for 4 hrs. The samples were withdrawn
rashant LP et al, Int J. Pharm. Drug. Anal, Vol: 4, Issue: 1, 2016; 1-11
Available online at http://ijpda.com
complex was found to be in the range of 10-20µg/ml.
Ca-The accuracy of the proposed method was tested by re-covery studies at 80%, 100%, and 120%. This was per-formed by addition of a known amount of complex con-centration of 10µg/ml. The recovery studies were per-d to per-determine the accuracy of the proposeper-d
me-The precision is measure of either the degree of reprodu-cibility orrepeatability of analytical method which is ex-pressed as the standard deviation, relative standard devi-ation or coefficient of variance of a series of measure-ments. It is used as an indication of random error in ana-lytical method development. For this reason inter and
day precision is done using six replicates to check on) of the proposed method.
The robustness of the method was carried out by chang-ing the ratio of the solvent system of the proposed me-thod of copper sulphate and acetate buffer pH4.7 as 1:1
method)
A stock solution containing 10 mg amlodipine in 10 ml of mixture of copper sulphate and acetate buffer pH 4.7 was prepared; which was diluted to prepare a stock of concen-tration 100µg/ml. The stock prepared was used for deter-degradation of complex under differ-ent conditions to provide an indication of the stability-indicating propertyand specificity of the proposed me-thod. In all degradation studies, the absorbance of the complex was measured and the amount ofdegraded
com-The procedures for various
de-For this type of degradation studies 0.1 N HCl was used. 1 ml of the stock solution was taken in a 10 ml volumetric th 0.1 N HCl and C for 4 hrs. The samples were withdrawn at 0,1,2,4 hrs and absorbance was determined to analyse the extent of degradation of the complex.
For this type of degradation 0.1N NaOH was used.1 ml of stock solution was taken in a 10 ml volumetric flask and was then made upto 10 ml with 0.1 N NaOH and was C for 4 hrs. The samples were with-drawn at 0,1,2,4 hrs and absorbance was determined to
the complex.
was used.1 ml of stock solution was taken in a 10 ml volumetric flask and and was kept for C for 4 hrs. The samples were withdrawn at
0,1,2,4 hrs and absorbance was determined to analyse the extent of degradation of the complex.
Neutral degradation:
For this type of degradation methanol was used.1 ml of stock solution was taken in a 10 ml volumetric flask and was then made upto 10 ml with methanol and was kept for heating at 60oC for 4 hrs. The samples were withdrawn at 0,1,2,4 hrs and absorbance was determined to analyse the extent of degradation of the complex.
Photolytic degradation:
For photolytic degradation, the samples of compl exposed to sunlight for 48 hrs. The samples were wit drawn at intervals 0, 12, 24, 36, 48.The blank was taken as the mixture of complexing agent in ratio 1:1.25.The sa ples were analysed using UV at the λmax.
RESULTS
Selection of suitable solvent system and Method deve opment: Selection of the best solvent system was based on the solubility of the complex and also absorbance which was determined by taking UV scan. The solvents which were choosen for study showed following results.
Methanol :
Methanol was used as the solvent for complex formation. For determination of the complex formation three types of UV scan were taken; First, drug in the reagent; Second, only the reagent; Third, the final scan of the complex which is formed in the reagent
The results of UV scan were found as follows:
Fig 1: UV Scan of drug in methanol
From the Fig 1 it was observed that the drug (Amlodipine besylate) has two ʎmax at 237.10nm and 360.25 nm. So, the further scans should differ from these peaks to confirm the formation of complex; as the complexing agent copper sulphate is a coloured substance a red or blue shift would be observed which would confirm the formation of co plex.
3
0,1,2,4 hrs and absorbance was determined to analyse the extent of degradation of the complex.
For this type of degradation methanol was used.1 ml of stock solution was taken in a 10 ml volumetric flask and with methanol and was kept C for 4 hrs. The samples were withdrawn at 0,1,2,4 hrs and absorbance was determined to analyse the extent of degradation of the complex.
For photolytic degradation, the samples of complex were exposed to sunlight for 48 hrs. The samples were with-drawn at intervals 0, 12, 24, 36, 48.The blank was taken as the mixture of complexing agent in ratio 1:1.25.The sam-ples were analysed using UV at the λmax.[4]
vent system and Method
devel-Selection of the best solvent system was based on the solubility of the complex and also absorbance which was determined by taking UV scan. The solvents which were choosen for study showed following results.
Methanol was used as the solvent for complex formation. For determination of the complex formation three types of UV scan were taken; First, drug in the reagent; Second, only the reagent; Third, the final scan of the complex which is formed in the reagent or the diluting solvent. The results of UV scan were found as follows:
Fig 1: UV Scan of drug in methanol
Prashant LP
Fig 2: UV Scan of complex in methanol
From Fig 2 it was observed that the scan was wavy and also that it has two ʎmax at 232.28 nm and 240.93 nm. The peaks observed were nearby that of drug alone and also the reagent. Thus, it was inferred that no complex was formed as there was no shift observed and the peaks were inferred to be of the drug and reagent alone. No change was observed which clearly determines that no complex is formed.
Distilled water:
In the case of distilled water again the UV scans were ta en to determine whether the complex is formed in the distilled water; which could turn out to be economical. For this purpose again three type of scan were carried out; First, only drug in distilled water; Second, only reagent (Distilled water); Third, the complex formed in distilled water.
From Fig 3, it was observed that the complex formed showed a peak at 232.06 nm which was almost close t that of the reagent alone. Thus, it could be concluded that no differentiated peak was observed from the reagent peak; the observed peak could not be of the complex formed. Hence no complex is formed using distilled w ter.
Mixture of copper sulphate and acetate buffer pH 4.7 (1:1.25)
In the case of mixture again the UV scans were taken to determine whether the complex is formed in the mixture; which could turn out to be economical. For this purpose again three type of scan were carried out; First, only drug in mixture; Second, only reagent (mixture of copper su phate and acetate buffer pH 4.7 in ratio 1:1.25); Third, the complex formed in mixture.
From Fig 4, it was observed that the UV scan showed a shift to the right side. The drug in reagent showed a peak at 232.92 nm and the reagent alone showed at 231.06 nm. The UV scan showed a peak at 365 nm; this confirmed the shift towards right and thus, the formation of amlodipine
rashant LP et al, Int J. Pharm. Drug. Anal, Vol: 4, Issue: 1, 2016; 1-11
Available online at http://ijpda.com
Fig 2: UV Scan of complex in methanol
From Fig 2 it was observed that the scan was wavy and at 232.28 nm and 240.93 nm. The peaks observed were nearby that of drug alone and also the reagent. Thus, it was inferred that no complex was erved and the peaks were inferred to be of the drug and reagent alone. No change was observed which clearly determines that no complex is
In the case of distilled water again the UV scans were tak-x is formed in the distilled water; which could turn out to be economical. For this purpose again three type of scan were carried out; First, only drug in distilled water; Second, only reagent (Distilled water); Third, the complex formed in distilled
From Fig 3, it was observed that the complex formed 06 nm which was almost close to-that of the reagent alone. Thus, it could be concluded to-that no differentiated peak was observed from the reagent of the complex formed. Hence no complex is formed using distilled
wa-Mixture of copper sulphate and acetate buffer pH 4.7
In the case of mixture again the UV scans were taken to determine whether the complex is formed in the mixture; ould turn out to be economical. For this purpose again three type of scan were carried out; First, only drug in mixture; Second, only reagent (mixture of copper sul-phate and acetate buffer pH 4.7 in ratio 1:1.25); Third, the
m Fig 4, it was observed that the UV scan showed a shift to the right side. The drug in reagent showed a peak at 232.92 nm and the reagent alone showed at 231.06 nm. The UV scan showed a peak at 365 nm; this confirmed the formation of
amlodipine-copper complex was confirmed in the mixture of amlodipine-copper sulphate and acetate buffer pH 4.7 ( in a specific ratio 1:1.25).For further confirmation of whether the complex formed is stable the concentration of stock solution were varied from 10-20 µg/ml.
From Fig. 5, it can be inferred that the complex formed is stable as varying the concentration of stock solution does not shift the ʎmax from 365 nm. Also the peaks observed at 365 nm were observed to be flat at all concentrations. Thus, it was confirmed that the complex is formed. Thus, the complex formation is confirmed and the method was further validated and also the stress degradation studies were done to infer the stability of the proposed method for routine analysis.
Validation of method:
The method was validated with reference to linearity, range, accuracy and precision and Robustness
Range: The range of the developed method was found to be 10 -20µg/ml as inferred from linearity graph.
Linearity: From the Fig 6, it can be
linearity was found to be R2 = 0.9922; with the regression equation to be y=0.0137x+ 0.0088 in the concentration range 10 -20µg/ml.
Accuracy: The accuracy of proposed method was val dated and the results were tabulated in table 2 and th figure 6 graphically represents the same.
From Table 2, it was observed that the proposed method was accurate and the % Recovery values were within the limits range which showed that the proposed method was accurate and the graphical representation in Fi
firms the results obtained.
Precision: The precision was carried out as intra inter-day precision. The results are tabulated in Table 3 From Table 3, it was can be concluded that all the % RSD values were less than 2 % which was found to be limits and thus the proposed method was having good precision.
Robustness: The method was validated for robustness; to study whether a slight change in concentration of reagent affects the developed method or not. The concentration of the agent was changed for three ratio’s 1:1.25, 1:1, 1.25:1 respectively for determining the robustness of method. The results are tabulated in Table 4.
From Table 4, it was observed that all the values of % RSD were within limits i.e. less than 2%; thus it can be co cluded that the proposed method was robust. Thus, the results showed that the proposed method was well linear, accurate, and robust and had precision. The other concern was the stability of the formed complex for routine bulk analysis of amlodipine.
4
copper complex was confirmed in the mixture of copper sulphate and acetate buffer pH 4.7 ( in a specific ratio 1:1.25).For further confirmation of whether the complex formed is stable the concentration of stock solution were
From Fig. 5, it can be inferred that the complex formed is stable as varying the concentration of stock solution does from 365 nm. Also the peaks observed at 365 nm were observed to be flat at all concentrations. it was confirmed that the complex is formed. Thus, the complex formation is confirmed and the method was further validated and also the stress degradation studies were done to infer the stability of the proposed method
The method was validated with reference to linearity, range, accuracy and precision and Robustness
The range of the developed method was found to 20µg/ml as inferred from linearity graph.
From the Fig 6, it can be concluded that the = 0.9922; with the regression equation to be y=0.0137x+ 0.0088 in the concentration
The accuracy of proposed method was vali-dated and the results were tabulated in table 2 and the figure 6 graphically represents the same.
From Table 2, it was observed that the proposed method was accurate and the % Recovery values were within the limits range which showed that the proposed method was accurate and the graphical representation in Fig 7
con-The precision was carried out as intra-day and day precision. The results are tabulated in Table 3 From Table 3, it was can be concluded that all the % RSD values were less than 2 % which was found to be within limits and thus the proposed method was having good
The method was validated for robustness; to study whether a slight change in concentration of reagent affects the developed method or not. The concentration of changed for three ratio’s 1:1.25, 1:1, 1.25:1 respectively for determining the robustness of method. The results are tabulated in Table 4.
From Table 4, it was observed that all the values of % RSD were within limits i.e. less than 2%; thus it can be
INTERNATIONAL JOURNAL OF PHARMACEUTICS & DRUG VOL. 4 ISSUE 1, 2016; 1 –11; http://ijpda.com; ISSN: 2348
Fig 3: UV Scan of complex in distilled water
Fig 4: UV Scan of complex in the reagent mixture
Fig 5: UV Scan at different concentration of stock solution of API
PHARMACEUTICS & DRUG ANALYSIS ISSN: 2348-8948
Fig 3: UV Scan of complex in distilled water
Fig 4: UV Scan of complex in the reagent mixture
Fig 5: UV Scan at different concentration of stock solution of API
Prashant LP
Fig 6: Linearity graph for proposed method
Level Absorbance Amount recovered (mg)
80%
0.222 15.56
0.225 15.78
0.229
100%
0.275 19.43
0.272 19.21
0.278 19.64
120%
0.333 23.66
0.329 23.37
0.331
rashant LP et al, Int J. Pharm. Drug. Anal, Vol: 4, Issue: 1, 2016; 1-11
Available online at http://ijpda.com
Fig 6: Linearity graph for proposed method
Table 2: Results of accuracy (n=3)
Amount recovered (mg) % Recovered Mean
15.56
15.78 101.56 0.22
16.0 19.43
19.21 97.15 0.27
19.64 23.66
23.37 97.99 0.33
23.5
Fig 7: Accuracy recovery graph
6
SD %RSD
0.003 0.015
0.003 0.01
Prashant LP
Table 3: Results of Intra
Concentration (ppm)
Mean
10 0.11
12 0.13
14 0.14
16 0.18
18 0.19
20 0.22
Concentration (ppm)
10 12 14 16 18 20
Fig 8: UV Scan of photolytic degradation of drug
Fig 9: UV Scan of photolytic degradation of Complex
rashant LP et al, Int J. Pharm. Drug. Anal, Vol: 4, Issue: 1, 2016; 1-11
Available online at http://ijpda.com
Table 3: Results of Intra-day and Inter-day precision (n=3)
Intra-day precision Inter
Mean SD %RSD Mean
0.11 0.002 0.021 0.15
0.13 0.001 0.01 0.14
0.14 0.003 0.02 0.19
0.18 0.0025 0.013 0.21
0.19 0.002 0.01 0.24
0.22 0.0015 0.006 0.26
Table 4: Results of Robustness (n=3)
Mean SD
0.08 0.002
0.10 0.0015
0.11 0.004
0.14 0.003
0.15 0.0035
0.17 0.0025
Fig 8: UV Scan of photolytic degradation of drug
Fig 9: UV Scan of photolytic degradation of Complex
7 Inter-day precision
SD %RSD
0.002 0.012 0.0025 0.017
0.002 0.013 0.002 0.011 0.002 0.008 0.003 0.011
%RSD
Prashant LP
SIAM Results :( Forced degradation studies) Photolytic degradation:
The UV Scan were taken at 0 hrs and then after 48 hrs and then were overlay in one graph and compared as the amount of drug degraded after completion of study.
Fig 8: UV Scan of photolytic degradation of drug
Fig 9: UV Scan of photolytic degradation of Complex
The observations of the degradation in Fig 8 and Fig 9 were tabulated at different time intervals in table 5. The % degraded at a particular time interval is
tables. This gives an idea of the maximum amount of drug and also the complex get degraded.
Table 5: Observations of drug and complex degradation by photolysis
Time (hrs.) %Degradation
Drug Complex
0 0
12 22.32
24 30.73
36 39.90
48 46.78
The results observed in table 5 were compared graphica ly and from this it could be concluded that the drug d gradation was found to be greater than the complex d
rashant LP et al, Int J. Pharm. Drug. Anal, Vol: 4, Issue: 1, 2016; 1-11
Available online at http://ijpda.com
Results :( Forced degradation studies)
The UV Scan were taken at 0 hrs and then after 48 hrs and then were overlay in one graph and compared as the amount of drug degraded after completion of study.
degradation of drug
Fig 9: UV Scan of photolytic degradation of Complex
The observations of the degradation in Fig 8 and Fig 9 were tabulated at different time intervals in table 5. The % degraded at a particular time interval is shown in the tables. This gives an idea of the maximum amount of
Table 5: Observations of drug and complex degradation
%Degradation Complex
0
15.18 21.02 27.59 34.16 The results observed in table 5 were compared graphical-ly and from this it could be concluded that the drug gradation was found to be greater than the complex
de-gradation.
Thus, from these observations it can be concluded
photolytic degradation of the API was reduced by the formation of complex.
Acid Degradation:
Fig 10: UV Scan of drug degradation in 0.1N HCl
Fig 11: UV Scan of complex degradation in 0.1N HCl
The observations of the degradation in
were tabulated at different time intervals in table 5. The % degraded at a particular time interval is shown in the tables. This gives an idea of the maximum amount of drug and also the complex get degraded.
The results observed in table 6, were compared graphica ly and from this it could be concluded that the drug d gradation was found to be greater than the complex d gradation. Thus, from these observations it can be co cluded that the acid degradation of the API was reduced by the formation of complex to some extent.
Alkali degradation:
The observations of the degradation in Fig 12 and Fig 13 were tabulated at different time intervals in table 6. The % degraded at a particular time interval is shown in the tables. This gives an idea of the maximum amount of drug and also the complex get degraded.
The results observed in table 6 were compared graphica ly and from this it could be concluded that the drug d
8
Thus, from these observations it can be concluded that the photolytic degradation of the API was reduced by the
Fig 10: UV Scan of drug degradation in 0.1N HCl
Fig 11: UV Scan of complex degradation in 0.1N HCl
The observations of the degradation in Fig 10 and Fig 11 were tabulated at different time intervals in table 5. The % degraded at a particular time interval is shown in the tables. This gives an idea of the maximum amount of drug and also the complex get degraded.
6, were compared graphical-ly and from this it could be concluded that the drug gradation was found to be greater than the complex de-gradation. Thus, from these observations it can be con-cluded that the acid degradation of the API was reduced
ation of complex to some extent.
The observations of the degradation in Fig 12 and Fig 13 were tabulated at different time intervals in table 6. The % degraded at a particular time interval is shown in the the maximum amount of drug and also the complex get degraded.
Prashant LP
gradation was found to be greater than the complex d gradation. Out of the total time of degradation up till 2 hrs the % degradation of both drug and complex was a most same and after that the drug. Thus, from these o servations it can be concluded that the alkali degradation of the API was reduced by the formation of complex to some extent.
Fig 12: UV Scan of drug degradation in 0.1N NaOH
Fig 13: UV Scan of complex degradation in 0.1N NaOH
Fig 14: UV Scan of drug degradation in 3% H
Fig 15: UV Scan of complex degradation in 3% H
Oxidative Degradation:
rashant LP et al, Int J. Pharm. Drug. Anal, Vol: 4, Issue: 1, 2016; 1-11
Available online at http://ijpda.com
gradation was found to be greater than the complex de-e of dde-egradation up till 2 hrs the % degradation of both drug and complex was al-most same and after that the drug. Thus, from these ob-servations it can be concluded that the alkali degradation of the API was reduced by the formation of complex to
Fig 12: UV Scan of drug degradation in 0.1N NaOH
Fig 13: UV Scan of complex degradation in 0.1N NaOH
Fig 14: UV Scan of drug degradation in 3% H2O
Fig 15: UV Scan of complex degradation in 3% H2O2
The observations of the degradation in Fig 14 and Fig 15 were tabulated at different time intervals in table 6. The % degraded at a particular time interval is shown in the tables. This gives an idea of the maximum amount of drug and also the complex get degraded.
The results observed in table 6 were compared graphica ly and from this it could be concluded that the drug d gradation was found to be greater than the complex d gradation. Thus, from these observations it can be co cluded that the oxidative degradation of the AP duced by the formation of complex to some extent.
Neutral degradation:
The observations of the degradation were tabulated at different time intervals in table 6. The % degraded at a particular time interval is shown in the tables. This gives an idea of the maximum amount of drug and also the complex get degraded.
The results observed in table 6 were compared graphica ly and from this it could be concluded that the drug d gradation was found to be greater than the complex d gradation. It can be inferred that the drug degradation is very high compared to complex formed degradation. Thus, from these observations it can be concluded that the neutral degradation of the API was reduced by the form tion of complex to some extent.
DISCUSSION:
The results above interpreted that there is a possibility of forming complex with copper
besylate. This method is easy and economical could be used to develop on a more accurate scale i.e. HPLC. The results obtained are discussed or interprete
tral degradation of the complex was more than any other form of degradation and photolytic degradation was co trolled to certain extent it needs to be further improved. The detail interpretation is done along the results r vealed. The proposed method was for the development of an analytical method by complex formation with copper ion; the analysis of amlodipine was studied for bulk. From the results obtained of the bulk analysis of amlod pine by complex formation with copper ion, it was o served that the photolytic degradation reduced as co pared to without complex formation. The validation r sults revealed that the proposed method is accurate and reproducible and also the proposed method was also o served not to be affected by slight variation i
posed method; which means the method is robust. All the % RSD were found to be less than 2% which showed that the proposed method could be employed for routine analysis. The SIAM studies were performed to check the stability of the complex formed
uid state; this makes it extremely important to check for stability as the chances of getting degraded increases u
9
of the degradation in Fig 14 and Fig 15 were tabulated at different time intervals in table 6. The % degraded at a particular time interval is shown in the tables. This gives an idea of the maximum amount of drug and also the complex get degraded.
lts observed in table 6 were compared graphical-ly and from this it could be concluded that the drug gradation was found to be greater than the complex de-gradation. Thus, from these observations it can be con-cluded that the oxidative degradation of the API was re-duced by the formation of complex to some extent.
The observations of the degradation were tabulated at different time intervals in table 6. The % degraded at a particular time interval is shown in the tables. This gives idea of the maximum amount of drug and also the
The results observed in table 6 were compared graphical-ly and from this it could be concluded that the drug gradation was found to be greater than the complex de-nferred that the drug degradation is very high compared to complex formed degradation. Thus, from these observations it can be concluded that the neutral degradation of the API was reduced by the
forma-s above interpreted that there iforma-s a poforma-sforma-sibility of forming complex with copper-sulphate of amlodipine besylate. This method is easy and economical could be used to develop on a more accurate scale i.e. HPLC. The results obtained are discussed or interpreted as the neu-tral degradation of the complex was more than any other form of degradation and photolytic degradation was con-trolled to certain extent it needs to be further improved. The detail interpretation is done along the results
Prashant LP et al, Int J. Pharm. Drug. Anal, Vol: 4, Issue: 1, 2016; 1-11
Available online at http://ijpda.com
10
der such circumstances The SIAM results that are the study indicating the stability of analytical method re-vealed that the formed complex of amlodipine with
cop-per ion (C+2) was stable and does not degrade to a great extent under various stress conditions.
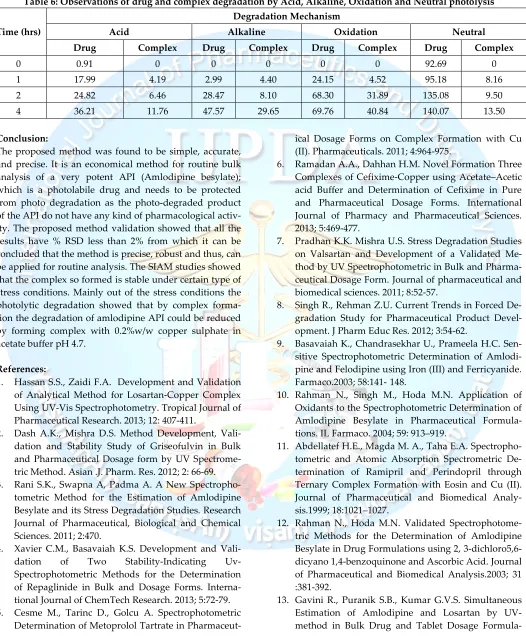
Table 6: Observations of drug and complex degradation by Acid, Alkaline, Oxidation and Neutral photolysis
Time (hrs)
Degradation Mechanism
Acid Alkaline Oxidation Neutral
Drug Complex Drug Complex Drug Complex Drug Complex
0 0.91 0 0 0 0 0 92.69 0
1 17.99 4.19 2.99 4.40 24.15 4.52 95.18 8.16
2 24.82 6.46 28.47 8.10 68.30 31.89 135.08 9.50
4 36.21 11.76 47.57 29.65 69.76 40.84 140.07 13.50
Conclusion:
The proposed method was found to be simple, accurate, and precise. It is an economical method for routine bulk analysis of a very potent API (Amlodipine besylate); which is a photolabile drug and needs to be protected from photo degradation as the photo-degraded product of the API do not have any kind of pharmacological activ-ity. The proposed method validation showed that all the results have % RSD less than 2% from which it can be concluded that the method is precise, robust and thus, can be applied for routine analysis. The SIAM studies showed that the complex so formed is stable under certain type of stress conditions. Mainly out of the stress conditions the photolytic degradation showed that by complex forma-tion the degradaforma-tion of amlodipine API could be reduced by forming complex with 0.2%w/w copper sulphate in acetate buffer pH 4.7.
References:
1. Hassan S.S., Zaidi F.A. Development and Validation of Analytical Method for Losartan-Copper Complex Using UV-Vis Spectrophotometry. Tropical Journal of Pharmaceutical Research. 2013; 12: 407-411.
2. Dash A.K., Mishra D.S. Method Development, Vali-dation and Stability Study of Griseofulvin in Bulk and Pharmaceutical Dosage form by UV Spectrome-tric Method. Asian .J. Pharm. Res. 2012; 2: 66-69. 3. Rani S.K., Swapna A, Padma A. A New
Spectropho-tometric Method for the Estimation of Amlodipine Besylate and its Stress Degradation Studies. Research Journal of Pharmaceutical, Biological and Chemical Sciences. 2011; 2:470.
4. Xavier C.M., Basavaiah K.S. Development and Vali-dation of Two Stability-Indicating Uv-Spectrophotometric Methods for the Determination of Repaglinide in Bulk and Dosage Forms. Interna-tional Journal of ChemTech Research. 2013; 5:72-79. 5. Cesme M., Tarinc D., Golcu A. Spectrophotometric
Determination of Metoprolol Tartrate in
Pharmaceut-ical Dosage Forms on Complex Formation with Cu (II). Pharmaceuticals. 2011; 4:964-975.
6. Ramadan A.A., Dahhan H.M. Novel Formation Three Complexes of Cefixime-Copper using Acetate–Acetic acid Buffer and Determination of Cefixime in Pure and Pharmaceutical Dosage Forms. International Journal of Pharmacy and Pharmaceutical Sciences. 2013; 5:469-477.
7. Pradhan K.K. Mishra U.S. Stress Degradation Studies on Valsartan and Development of a Validated Me-thod by UV Spectrophotometric in Bulk and Pharma-ceutical Dosage Form. Journal of pharmaPharma-ceutical and biomedical sciences. 2011; 8:52-57.
8. Singh R., Rehman Z.U. Current Trends in Forced De-gradation Study for Pharmaceutical Product Devel-opment. J Pharm Educ Res. 2012; 3:54-62.
9. Basavaiah K., Chandrasekhar U., Prameela H.C. Sen-sitive Spectrophotometric Determination of Amlodi-pine and FelodiAmlodi-pine using Iron (III) and Ferricyanide. Farmaco.2003; 58:141-/148.
10. Rahman N., Singh M., Hoda M.N. Application of Oxidants to the Spectrophotometric Determination of Amlodipine Besylate in Pharmaceutical Formula-tions. IL Farmaco. 2004; 59: 913–919.
11. Abdellatef H.E., Magda M. A., Taha E.A. Spectropho-tometric and Atomic Absorption Spectrometric De-termination of Ramipril and Perindopril through Ternary Complex Formation with Eosin and Cu (II). Journal of Pharmaceutical and Biomedical Analy-sis.1999; 18:1021–1027.
12. Rahman N., Hoda M.N. Validated Spectrophotome-tric Methods for the Determination of Amlodipine Besylate in Drug Formulations using 2, 3-dichloro5,6-dicyano 1,4-benzoquinone and Ascorbic Acid. Journal of Pharmaceutical and Biomedical Analysis.2003; 31 :381-392.
Prashant LP et al, Int J. Pharm. Drug. Anal, Vol: 4, Issue: 1, 2016; 1-11
Available online at http://ijpda.com
11
tion. Archives of Applied Science Research. 2012; 4:2206-2212.
14. Jadhav K.V., Dhamecha D.L. Stability Indicating Stress Degradation Studies of Lafutidine using UV Spectrophotometric Method. Pharmaceutical Me-thods. 2013; 4: 21-25.
15. Manthena V.S., Varma A.M., Garg S. Rapid and Selec-tive UV Spectrophotometric and RP-HPLC Methods for Dissolution Studies of Oxybutynin Immediate Re-lease and Controlled ReRe-lease Formulations. Journal of Pharmaceutical and Biomedical Analysis.2004; 36:669–674.
16. Kalyanaramu B., Raghubabu K. Development of New Analytical Method for Determination of Raloxifene Hydrochloride in Formulations Based on Charge-Transfer Complex Formation. International Journal of Analytical and Bioanalytical Chemistry. 2011; 1:29-33. 17. Bakshi M., Singh S. Development of Validated Stabili-ty Indicating Assay Methods: Critical Review. Journal of Pharmaceutical and Biomedical Analysis. 2002; 28:1011-1040.
18. Walash M.I., Metwally M.E., Eid M., Shaheny R.N. Spectrophotometric Determination of Risedronate in Pharmaceutical Formulations via Complex Formation with Cu (II) Ions: Application to Content Uniformity Testing. International journal of Biomedical Science.2008; 4:303-308.
19. Kumar D. P., Samy K., Madhu Kumar C. Colorimetric Determination and Validation of Amlodipine Besy-late in Pure and Tablet Dosage Form. International Journal of Research Pharmaceutical and Nano Sciences. 2013; 2:245-250.
20. Rahman N., Syed N. H. Spectrophotometric Method for the Determination of Amlodipine Besylate with Ninhydrin in Drug Formulations. IL Farmaco.2001; 56:731-735.
21. Stoiljkovic Z.Z., Jovanovic V.M. The Electrochemical Investigation of Inclusion Complexes of Nifedipine and Amlodipine with β-Cyclodextrin and (2-Hydroxypropyl)-β-Cyclodextrin. Int. J. Electrochem. Sci. 2001; 8:9543-9557.
22. Bhargavi P., Chandana B. Visible Spectrophotometric Method for the Estimation of Amlodipine Besylate in Tablet Dosage Forms. Journal of Pharmacy Re-search.2011; 4:4001-4002.
23. Derayea S.M., Spectrophotometric Determination of Amlodipine and Nicardipine in Pharmaceutical For-mulations via Binary Complex Formation with Eosin Y. Journal of Applied Pharmaceutical Science. 2012; 2:84-89.
24. Patil V.P. New Eco-friendly Validated Spectrophoto-metric Method for the Estimation of Amlodipine Be-sylate in Bulk Drug Using Ninhydrin. Asian Journal
of Biomedical and Pharmaceutical Sciences.2012; 3:14-19.
25. Jampana P.K. Visible Spectroscopic Method for Esti-mation of Amlodipine Besylate in Tablets. Interna-tional Journal of Pharmaceutical, Chemical and Bio-logical Sciences. 2014; 4:173-177.
26. Jadhav S.B. Difference Spectroscopic Method for the Estimation of Amlodipine Besylate in Bulk and in Formulation. International Journal of Pharmaceutical and Chemical Sciences.2013; 2:1213-1217.
27. Kirtansinh G.N. Application of Analytical Techniques in Preformulation Study: A Review. International Journal of Pharmaceutical & Biological Archives. 2011; 2:1319-1326.
28. Validation of Analytical Procedure: Text and Metho-dology, ICH Harmonized Tripartite Guideline, Q2 (R1), 2005:1-3.
29. Joshi H.S. Development and Validation of Stability Indicating HPLC Assay Method for Simultaneous De-termination of Amlodipine Besylate, Olmesartan Me-doxomil and Hydrochlorothiazide in Tablet Formula-tion. Der Pharmacia Sinica. 2013; 4:145-152.