e- ISSN: 2278-067X, p-ISSN: 2278-800X, www.ijerd.com
Volume 14, Issue 7 (July Ver. II 2018), PP.13-20
Correction of Missing Traffic Data with the Circulation
Distribution Model and Reliability Analysis
Gyeong-Seok Byun
1, Hyun-Suk Kim,
2 1Korea Institute of Civil Engineering and Building Technology (KICT)
2Korea Institute of Civil Engineering and Building Technology (KICT)
Corresponding Author Gyeong-Seok Byun
ABSTRACT:- : Missing traffic data will unfortunately yet inevitably occur. The seriousness of this problem has been recognized, and new response measures have been sought. The circulation distribution model (CDM) was applied to the existing circulation model using the mean absolute percent error (MAPE) and the Traffic Monitoring Guide published by the Federal Highway Administration (FHAW), the proposed overall mean absolute percent error (oMAPE) was assessed, and the model’s suitability for use in evaluating the traffic volume was verified after the analysis of its statistical suitability
KEYWORDS:- Traffic volume∣ correction of missing data∣ circulation distribution model∣ ITS
---
Date of Submission: 09-07-2018 Date of acceptance: 23-07-2018
--- ---
I. INTRODUCTION
The occurrence of missing traffic data is unfortunate but inevitable because it is not easy to survey a massive range of roads. Traffic volume data, resulting from a survey of the major representative road sections across the country, are utilized to analyze the country’s traffic flow, to conduct road construction / maintenance / expansion, to improve the signal systems, to install facilities, and to inform the general public of the traffic situations, among other diverse purposes. To analyze the flow of traffic on a road, a survey of the adjoining roads should also be conducted. This task is too huge for humans to conduct in terms of the range of work and time required. Thus, the survey is generally and efficiently conducted by operating related devices for 24 hours a day. Such a survey using devices, however, is not perfect and flawless. The devices may become dilapidated, the roads may get destroyed, and budget, time, manpower, and other problems concerning speedy maintenance may occur. Thus, missing data will occur even if the survey is conducted using devices.
Thus, this study focused on the most common yet essential data that should always be available and should never be missing, recognizing the seriousness of the situation where they are unavailable. In particular, in the case of 24-hour-a-day unmanned surveys through the operation of installed devices, there are bound to be missing data, for various reasons. Thus, studies on the compensation for all types of missing data have long been conducted, and new correction models have been developed and the old ones improved. Further, models used mainly in other areas have been applied to the traffic area to derive correction values and to verify the reliability and accuracy of such correction.
This study examined the correction models used in the traffic area, and identified their limitations. Actually, however, all the models have limitations, and correction is not perfect and will likely never be. This is why new correction models continue to be developed, and the old ones improved. This study was yet another of such efforts, aiming to use the circulation distribution model (CDM) newly adopted from the existing regression model developed by Batschelet (1981) to correct missing data, to derive reliability and consistency, and to present a new correction model.
II. DISCUSSIONOFPREVIOUSSTUDIES 1. Discussion of Previous Studies
Sharma et al. (2003) analyzed the permanent traffic counts (PTC) being conducted in Alberta, Canada and found a usual 10-44% missing data ratio among the devices being used, and up to 70-90% for certain years.
Chandra and Al-Deek (2004) analyzed the traffic-volume-data-gathering devices installed on highways and found a 15% missing data ratio. A study by Georgia Institute of Technology in the U.S. revealed that the traffic-volume-data-gathering devices being operated in Georgia had a 4-14% missing data ratio.
In 2001, Oh Ju-sam (2003) classified the traffic survey devices installed on general national roads through factor and cluster analyses of permanent survey points, using diverse traffic indices. In particular, using traffic-specific variables, he derived a total of three factors for analysis: the long-term traffic-specific factor, the short-term traffic-specific factor, and the heavy-vehicle-specific factor. He used the resulting load value by factor as a reference to conduct cluster analysis, classifying general national roads into four types: urban-area road, urban- and local-area road, local-area road, and tourist-area road.
Jones and James (1972) presented a method of estimating the parameters of bimodal orientation data using the steepest-descent method. Mardia and Sutton (1975) also presented a of estimating the parameters of the bimodal mixed von Mises distribution using the Newton algorithm.
Ravindran (2002) examined statistical approaches such as the embedding, intrinsic, and wrapping approaches to model circulation data, and used the DA algorithm to estimate the parameter of circulation probability distribution.
Jander (1957) developed the wrapped normal, wrapped cauchy, and wrapped double-exponential CDM using the ant movement direction data and the wind direction and ozone concentration data gathered by Milwaukee Weather Station in Wisconsin, USA every 4 days from April 18 to June 29, 1975.
Oh Yeong-nam (2006) developed a CDM using data on the phase difference between signals and the direction data of the slope plane of porcelain kilns, a major cultural heritage.
III. METHODOLOGY
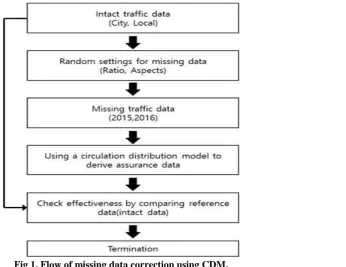
This study aimed to use CDM to prepare correction measures against missing traffic data due to traffic errors that frequently occur in permanent traffic volume devices, and to analyze the validity of the model by comparing the results of its use with flawless traffic volume data. Flawless data appear according to the traffic patterns in the urban and local areas; as such, they were grouped into two patterns, and the points where representative patterns appeared were selected, as shown in Table 1
Table 1. Overview of analysis points
Category Point no. Address AADT
Urban area 335 Wangsan, Mohyeon, Yongin in Gyenggi-do 28,297
Local area 101 Ingwang, Hyeondeok, Pyeongtaek in Gyeonggi-do 11,537
The one-year traffic data for the selected points were analyzed. It was deemed that the traffic patterns would not be significantly influenced by special holidays such as Lunar New Year, Chuseok, and general national holidays, and by the vacation seasons, when the traffic patterns could somewhat change; as such, the traffic data for these holidays and vacation seasons were not separately sorted out. Further, the traffic characteristics by day of the week in each point are different, and as such, an analysis by day of the week was carried out.
Regarding the hourly traffic volume for the selected points, the data defects were corrected using the mixed single-peaked asymmetrical circulation probability distribution and von Mises distribution model. The analysis was expressed in terms of expression (1).
, (1)
where = single-peaked distribution,
, ,
,
distribution with = parameter
the repetitive algorithm. The EM algorithm expression is shown in expression (2), and the parameter is repeatedly calculated until the result of this expression converges to , , , , ....
(2)
The derived parameter is the function expression shown in expression (3), and can be expressed in terms of a rose diagram.
(3)
The missing data was corrected through the proposed CDM, and the reliability of the corrected data was evaluated to verify that the model is a usable practical model. The usual mean absolute percent error (MAPE) model was used to evaluate the reliability. It is good to express the accuracy of reflecting the corrected value error as the maximum value. Further, the overall mean absolute percent error (oMAPE) proposed by the Traffic Monitoring Guide published by the Federal Highway Administration (FHAW) was also selected as an evaluation method to evaluate the reliability by considering the characteristics of traffic statistics.
, (4)
, (5)
where = reference value; = corrected value; = total number of data; and = number of missing data .
Thus, this study conducted a comparative evaluation by scenario, and verified the cost effectiveness. The analysis based on scenarios analyzed the reliability of CDM involving major factors like month, day of the week, and hour. The verification by scenario set the missing data ratio to 10-90% (∆=10) and set random data defects according to the missing data ratios, and with the assumption that missing data regularly occur, the continuous data defects were verified. Continuous-data-defect verification was carried out by setting data defects according to certain patterns, as follows: the first 10% were set as random data defects; at 20% and higher, continuous two data were set as defects; and at 30%, three data were set as defects. In addition, the missing data was corrected, and the reliability of the existing flawless data was verified using MAPE and oMAPE.
In addition, the suitability of CDM was verified. Thus, CDM’s statistical suitability was verified, and in one sample, it was determined if there is a statistical difference between the expectation frequency and the observation frequency according to a range of a variable. This study verified the suitability of CDM through the χ2 test, and expression (6) is the χ2 test expression.
, (6)
where = observation frequency and = expectation frequency.
Thus, the verification including the χ2 test is deemed to check the practicality of the missing data corrected by CDM.
IV. MISSINGDATACORRECTIONTHROUGHTHECIRCULATIONDISTRIBUTIONMODEL ANDRELIABILITYANALYSIS
1. Correction of Missing Data with CDM
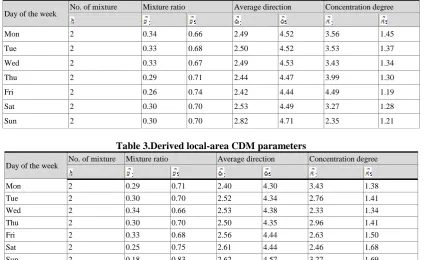
In this study, data correction was carried out by day of the week for urban and local areas with different traffic patterns, using CDM. The urban area showed similar hourly traffic patterns on the different days of the week, except Sunday. The urban area was characterized by distinctive traffic concentration during rush hours. The CDM parameters for the urban area are shown in Table 5. Figure 2 can be expressed in the form of a function expression via expression (3). To apply CDM to the data, one year’s worth of traffic data of urban and local areas were substituted into equation (1) to calculate the parameters. As explained in the section on the study methodology, the traffic patterns vary by day of the week, and as such, the parameters were calculated in this study by day of the week. The derived parameters are shown in Table 2, 3.
Table 2. Derived urban-area CDM parameters
Day of the week No. of mixture Mixture ratio Average direction Concentration degree
Mon 2 0.34 0.66 2.49 4.52 3.56 1.45
Tue 2 0.33 0.68 2.50 4.52 3.53 1.37
Wed 2 0.33 0.67 2.49 4.53 3.43 1.34
Thu 2 0.29 0.71 2.44 4.47 3.99 1.30
Fri 2 0.26 0.74 2.42 4.44 4.49 1.19
Sat 2 0.30 0.70 2.53 4.49 3.27 1.28
Sun 2 0.30 0.70 2.82 4.71 2.35 1.21
Table 3.Derived local-area CDM parameters
Day of the week No. of mixture Mixture ratio Average direction Concentration degree
Mon 2 0.29 0.71 2.40 4.30 3.43 1.38
Tue 2 0.30 0.70 2.52 4.34 2.76 1.41
Wed 2 0.34 0.66 2.53 4.38 2.33 1.34
Thu 2 0.30 0.70 2.50 4.35 2.96 1.41
Fri 2 0.33 0.68 2.56 4.44 2.63 1.50
Sat 2 0.25 0.75 2.61 4.44 2.46 1.68
Sun 2 0.18 0.83 2.62 4.57 3.27 1.69
Fig 2. Hourly traffic rose diagram by day of the week.
In the rose diagram, the width of the fan sector for each category determines the radius proportional to the square root of the frequency of the data. In the figure, the diagonal line shows the mode direction and the solid line shows the mean direction.
The derived values in the urban area showed similar patterns except for Fridays, and those in the local area showed similar patterns except for Wednesdays. Further, there was a need to determine if the derived values were reliable.
2. Verification according to the Missing Data Rates
Table 4. CDM verification of single missing data by missing data ratio
Missing data ratio (%) Urban-area data Local-area data
MAPE (%) oMAPE (%) MAPE (%) oMAPE (%)
10 16.90 1.70 26.82 2.70
20 17.66 3.51 25.89 5.15
30 17.56 5.17 26.43 7.78
40 17.68 7.08 26.37 10.56
50 17.77 8.85 26.13 13.01
60 17.62 10.56 25.63 15.37
70 17.68 12.48 25.71 18.15
80 17.64 14.13 25.93 20.78
90 17.73 15.94 25.82 23.22
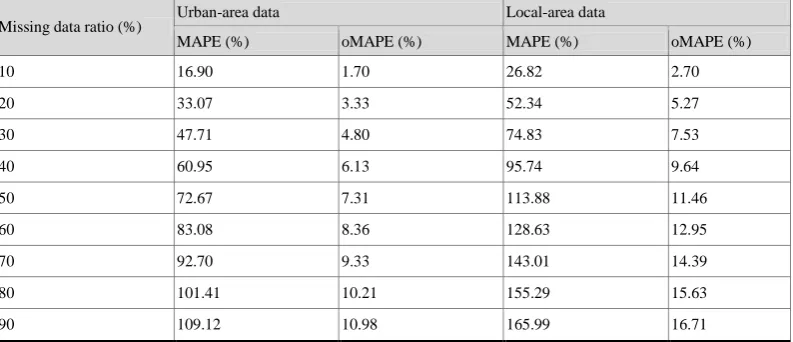
Table 5. CDM verification of continuous missing data by missing data ratio
Missing data ratio (%) Urban-area data Local-area data
MAPE (%) oMAPE (%) MAPE (%) oMAPE (%)
10 16.90 1.70 26.82 2.70
20 33.07 3.33 52.34 5.27
30 47.71 4.80 74.83 7.53
40 60.95 6.13 95.74 9.64
50 72.67 7.31 113.88 11.46
60 83.08 8.36 128.63 12.95
70 92.70 9.33 143.01 14.39
80 101.41 10.21 155.29 15.63
90 109.12 10.98 165.99 16.71
MAPE and oMAPE show an error rate. If the rate is closer to 0, the error is less, and conversely, if the rate is closer to 100, the error is great. When the single missing data were corrected even at the missing data ratio of up to 90%, their MAPE and oMAPE values were both evaluated as about 25%. MAPE showed no big difference for the missing data ratios of 10 and 90%, suggesting that the MAPE method could not properly evaluate the defect correction.
The MAPE evaluation of continuous data defects showed an error rate of 165% or more, upwards above 100%, suggesting that the MAPE evaluation method for traffic data is not suitable. Conversely, the oMAPE evaluation showed that the error gradually increased according to the missing data ratios of 10-90%, suggesting that the MAPE evaluation derives the average error for the quantity (n) of missing data while the oMAPE evaluation derives the average error of the total data quantity (N). This offers implications given that the reliability of the traffic data proposed by FAWA is 90%. Thus, the oMAPE method is more suitable only for traffic statistics. The proposed CDM confirmed that the oMAPE evaluation of the missing data correction derived a significant reliable value of up to 60% for the urban area, and a significant reliable value of up to 40% for the local area.
Lastly, an analysis was carried out to determine if CDM is statistically suitable. The suitability was determined according to the day of the week. The results of the determination of CDM’s correction suitability are shown in Table 6.
Table 6. Results of CDM’s missing data correction suitability determination
Day of the week Urban area Local area
p-value p-value
Mon 0.766 0.999 0.715 0.999
Tue 0.547 0.999 0.362 0.999
Thu 0.519 0.999 0.201 0.999
Fri 0.659 0.999 0.297 0.999
Sat 0.547 0.999 0.120 0.999
Sun 0.201 0.999 0.538 0.999
The derived analysis result is that the p-values (0 ≤ p-value ≤ 1) are all close to 1, with the p-value showing the significance probability of the test statistics for the suitability of the probability distribution of both urban and local areas. Thus, this suggests that CDM properly reflected the characteristics of the corrected traffic data based on the hourly traffic volume data by day of the week for each road.
V. CONCLUSION
In this study, traffic data defects were corrected using the circulation distribution model (CDM), and the reliability of the corrected data was analyzed. The corrected data were also examined to determine if they were statistically significant. As a result, the overall mean absolute percent error (oMAPE) value for the continuous missing data was found to be lower than that for the single missing data. This suggests that traffic data patterns are by nature strongly repetitive and circulatory.
In this study, using the continuous probability distribution model (CPDM), the correction value for traffic volume data was estimated, and the data defects were corrected using the circulation probability distribution. Compared to the regression model frequently used as a correction model, however, the model for correcting the traffic data defects is somewhat complicated, making it difficult to apply the model to actual situations. Further, the traffic volume surges during the rush hours, and then declines slowly, showing an asymmetrical pattern. Considering this pattern of various CDMs, a mixture-type circulation probability distribution — von Mises distribution — was used to correct the data defects, thus retaining the limitations in the accurate determination of the asymmetrical flow of hourly traffic volume.
This study presented a model for correcting data defects, but further studies are required to improve the proposed model so that it could be applied to actual situations. In particular, the data on the traffic volume created and led by ITS is an essential data for traffic control. The measures to be implemented to resolve device failures, communication errors, and the like, however, have lower priority compared to the measures to be implemented for security facilities. Thus, to ensure real-time correction, the remaining problems need to be resolved, such as the connection to the current ITS, the design of an optimal analysis process for lowering the handling load, and algorithms. In addition, a comparative analysis of the regression model, the seasonal ARIMA model, and the models used for correcting the traffic volume data was not carried out. Thus, there is a need to further carry out a comparative analysis of CDM and the regression and ARIMA models for a highly reliable analysis.
ACKNOWLEDGMENT
This Research was supported by Korea Institute of Civil Engineering and Building Technology's (KICT) task Non-buried vehicle detail specification extraction device
REFERENCES
[1]. Little, R.A., Rubin, D.B.(1987), Statistical Analysis with Missing Data, John Wiley & Sons, New York.
[2]. America Society for Testing and Materials(1991), ASTM Standard Practice E1442, Highway Traffic Monitoring Standards. Philadelphia, PA
[3]. America Association of State Highway and Transportation Officials(1992), AASHTO Guidelines for Traffic Data Programs. Washington, D.C.
[4]. Clark, S.D.(1992), Application of Outlier Detection and Missing Value Replacement Techniques to Various Forms of Traffic Count Data, ITS Working Paper 384, Univ. of Leeds, UK.
[5]. Sharma, S.C., Kilburn, P., Wu, Y.Q, The Precision of AADT Volumes Estimates from Seasonal Traffic Counts : Alberta Example, Canadian Journal of Civil Engineering, vol.23 No.1,1996.
[6]. Yuan, Y.C.(2000), Multiple Imputation for Missing Data : Concepts and New Development, SAS ver 1.0 Manuscript, SAS Institute Inc., Rockville, Maryland in USA.
[7]. Pigott, T.D.(2001), A Review of Methods for Missing Data, Educational Research and Evaluation vol.4 pp.353~383.
[8]. King, G., et al.(2001), Analyzing Incomplete Political Science Data : An Alternative Algorithm for Multiple Imputation, American Political Science Review, vol.95, No.1 pp.49~69.
[9]. Gold, D.L., Turner, S.M., Gajewski, B.J., Spiegelman, C.(2001), Imputing Missing Values in ITS Data Archives for Intervals under 5 Minutes, Proc., 80th Transportation Research Board(TRB) Annual Meeting, TRB National Research Council, Washington, D.C. [10]. Conklin, J.H., Smith, B.L.(2002), The Use of Local Lane Distribution Patterns for the Estimation of Missing Data in Transportation
Management Systems, TRR 1811 pp.50~56., TRB, Washington, D.C.
[11]. Zhong, M., Lingras, P., Sharma, S.C.(2002), Updating Missing Values of Traffic Counts : Factor Approaches, Time Series Analysis versus Genetically Designed Regression and Neural Network Models, submitted to the Journal of Transportation Engineering, ASCE.
[13]. Smith, B.L., Scherer, W.T., Conklin, J.H.(2003), Exploring Imputation Techniques for Missing Data in Transportation Management Systems, Proc., 82nd Transportation Research Board(TRB) Annual Meeting, TRB National Research Council, Washington, D.C. [14]. Conklin, J.H., Scherer, W.T, Data Imputation Strategies for Transportation Management Systems, Research Project Report, Center
for Transportation Studies, Univ. of Virginia, 2003.
[15]. Conklin, J.H., Scherer, W.T, Data Imputation Strategies for Transportation Management Systems, Research Project Report, Center for Transportation Studies, Univ. of Virginia, 2003.
[16]. Chen, C., Kwon, Jai.M., Rice, J., Skabardonis, A., Varaiya, P.(2003), Detecting Errors and Imputing Missing Data for Single Loop Surveillance Systems, Proc., 82nd TRB Annual Meeting, TRB National Research Council, Washington, D.C.
[17]. Chandra, C. and Al-Deek, H, New Algorithms for Filtering and Imputation of Real Time and Archived Dual-Loop Detector Data in the I-4 Data Warehouse, Proc., 83rd TRB Annual Meeting, TRB National Research Council, Washington, D.C, 2004.
[18]. Chandra, C. and Al-Deek, H.(2004), New Algorithms for Filtering and Imputation of Real Time and Archived Dual-Loop Detector Data in the I-4 Data Warehouse, Proc., 83rd TRB Annual Meeting, TRB National Research Council, Washington, D.C [19]. Kwon, Taek.M.(2004), TMC Traffic Data Automation for MNDOT's Traffic Monitoring Program, Final Report, Department of
Electrical and Computer Engineering, Univ. of Minnesota Duluth, USA.
[20]. Kwon, Taek.M.(2004), Transportation Data Research Laboratory, Annual Report, Northland Advanced Transportation Research Laboratories.
[21]. Smith, B.L., Babiceanu, S.(2004), An Investigation of Extraction Transformation and Loading(ETL) Techniques for Traffic Data Warehouses, Proc., 83rd TRB Annual Meeting, TRB National Research Council, Washington, D.C.
[22]. Steimetz, S.S.C., Brownstone, D.(2004), Estimating Commuters' Value of Time with Noisy Data : a Multiple Imputation Approach, Working Paper, Department of Economics, Univ. of California at Urvine, USA.
[23]. Wen, Y.H., Lee, T.T., Cho, H.J.(2005), Missing Data Treatment and Data Fusion toward Travel Time Estimation for ATIS, Journal of the Eastern Asia Society for Transportation Studies, vol.6, pp.2546~2560.
[24]. Ju-sam Oh, A Study on Highway Classification and Traffic Characteristics by Highway Type, KSCE Journal of Civil Engineering, 24, 4D, 2005, 555-563