Multilevel Thresholding Approach Using
Modified Bacterial Foraging Optimization
Kezong Tang
a, Zuoyong Li
b, Jun Wu
a, Tong Zhang
a aInformation Engineering Institute, Jingdezhen Ceramic Institute, Jingdezhen 333000, China Email:[email protected], [email protected], [email protected]
bDepartment of Computer Science, Minjiang University, Fujian 350108, China
Email: [email protected]
Abstract—In this work, a multilevel thresholding approach that uses modified bacterial foraging optimization (MBFO) is presented for enhancing the applicability and practicality of optimal thresholding techniques. First, the diversity of solutions is considered during the reproduction step. Each weak bacterium randomly selects a strong bacterium from the healthiest bacteria, attempts to reach a location near the chosen strong bacterium, and maintains the same direction. Particle swarm optimization is subsequently incorporated into each chemotactic step to strengthen the global searching capability and quicken the convergence rate of the bacterial foraging algorithm. Finally, the optimal thresholds are obtained by maximizing the Tsallis thresholding functions using the proposed MBFO algorithm. The performance of the proposed algorithm in solving complex stochastic optimization problems is compared with other popular approaches such as a bacterial foraging algorithm, particle swarm optimization algorithm, and genetic algorithm. Experimental results show that the optimal thresholds produced using MBFO require less computation time. In addition, MBFO method can achieve significantly better segmentation results; the devised algorithm generates more stable results, and the proposed method performs better than the other algorithms in terms of multilevel thresholding.
Index Terms—image segmentation, thresholding, tsallis
entropy, bacterial foraging, particle swarm optimization
I. INTRODUCTION
Image segmentation is usually considered one of the mandatory preprocessing procedures in quantitative image analysis. However, image segmentation remains a considerable challenge in digital image processing owing to its complexity and diversity. During this stage, the task is to divide an image into several disjoint regions, each of which is homogeneous with respect to certain specific properties such as the gray value, edge information, and texture structure. More importantly, through accurately segmenting these objects or regions, this basic preprocess helps in analyzing and interpreting a certain region in an image of interest. Many segmentation methods have been demonstrated over the past years for specific classes of
segmentation problems[1-8], including region-and threshold- based methods; however, no general scheme is applicable for every image type. Region-based methods employ either region growing, or region splitting and merging algorithms to segment an image. These region-based methods have several advantages over gradient-based techniques for segmentation, including better robustness to noise. Further, a threshold-based method is one of simplest approaches to image segmentation, where an image is segmented by comparing the image features with a particular threshold. When an image histogram has two obviously separated peaks, a threshold-based method is preferred because it consumes fewer calculations and has higher efficiency.
In general, threshold-based methods can be divided into two categories. The first category contains approaches for determining the optimal thresholds by analyzing the profile characteristics of an image histogram. The second category of thresholding techniques determines the optimal thresholds by optimizing certain objective functions. The main subject of a thresholding technique is to obtain an optimal thresholding in order to achieve certain desirable characteristics. On the other hand, many such methods attempt to achieve optimization of an objective function by maximizing or minimizing certain criteria, such as maximizing the posterior entropy indicating the homogeneity of the segmented classes [9,10], minimizing the Shannon entropy[11], maximizing the measure of separability on the basis of between-class variance[12], or minimizing Bayesian errors[13].
Among these approaches, Tsallis entropy, a generalization of the standard Boltzmann-Gibbs entropy, has attracted significant attention from the scientific community[14]. For discrete optimization problems, the recent application of Tsallis’ theory shows a tendency to provide a picture of many kinds of situations where the new formalism is useful. However, this method has an obvious drawback in that the computational complexity increases exponentially with an increase in the number of required thresholds. To a certain extent, this limits its application in multilevel thresholding.
Numerous approaches and corresponding improvements have been proposed to eliminate the abovementioned drawbacks. Among these approaches, Manuscript received May 16, 2014; revised August 6, 2014;
accepted August 1, 2014.
intelligent approaches such as neural networks (NN) [15], genetic algorithms (GA) [16], ant colony optimization[17], and particle swarm optimization(PSO)[18] have been successfully developed and applied to solve numerous optimization problems present in various fields such as image processing[19], pattern recognition[20], and biomedical Science[21]. These biologically inspired heuristics have shown better performances than classical optimization approaches for complex optimization problems owing to their domain-independent nature and capability of finding an optimal or approximately optimal solution within a large search space. Inspired by these successful applications, we further investigate the use of image segmentation using a modified bacterial foraging optimization (MBFO) algorithm.
Based on the foraging behavior of bacteria, a new optimization algorithm known as bacterial foraging optimization algorithm (BFOA) was introduced by Passino[22]; this is a relatively new addition to the family of nature-inspired optimization algorithms. Till date, BFOA has been successfully applied for solving numerous optimization problems[23-29].
In this paper, an MBFO-based multilevel thresholding technique that can enhance the feasibility and practicality of optimal thresholding techniques is proposed. Our proposed method utilizes the following steps. First, image segmentation is treated as a discrete optimization problem. Second, considering the diversity of solutions during the reproduction step, each weak bacterium randomly selects a strong bacterium beginning with the healthiest bacteria, attempts to move to a location near the selected strong bacterium, and maintains the same direction. Third, to improve the convergence rate and enhance the quality of the final solution, a PSO operator (velocity-displacement) is incorporated into each chemotactic step. Finally, maximizing the Tsallis thresholding function, the optimal thresholds are obtained using the MBFO algorithm. The proposed algorithm was tested on several benchmark images and was compared with the conventional BF, PSO, and GA and HCOCLPSO methods. The experimental results show that the application of our method on real images is efficient and feasible.
The remainder of this paper is organized as follows. In section 2, a mathematical model describing the concept of Tsallis entropy is introduced. In section 3, an overview of the BF algorithm is provided. The MBFO algorithm is described in section 4. In section 5, the MBFO algorithm is applied to the image thresholding problem. Finally, in the last section, we briefly present our conclusions.
II. THRESHOLDING METHOD USING TSALLIS ENTROPY Tsallis entropy is a new entropy measure generalizing the traditional Boltzmann/Gibbs entropy for non-extensive physical systems[27]. Tsallis entropy uses a thresholding approach to tackle the presence of non-additive information in an image. It is similar to the maximum entropy method of Kapur et al., 9 Tsallis entropy is the preferable method for a variety of image processing applications such as biomedical analysis and automatic target recognition. An image thresholding
method using Tsallis entropy (i.e., non-extensive entropy) was first presented by Albuquerque [14]. It was developed into bi-level thresholding and later generalized into multiple levels. Let L be the gray levels in a given image, and pi= p1, p2, …, pL be their probability distribution; pi
can then be defined as pi = h(i) / N (1 ≤ i ≤ L), where h(i)
denotes the number of pixels with gray-level i, and N denotes the total number of pixels in an image. The optimal thresholding problem can then be investigated as an n-dimensional optimization problem. The formulation of n optimal thresholds can be described as follows. A. Bi-level Thresholding
In the case of bi-level thresholding, the pixels are divided into two classes, one for the object region (class A), and the other for the background region (class B). The gray level probability distributions for the object and background regions (A and B) can then be given by
(1)
(2)
where , and
.
According to the definition of Tsallis entropy[3,33], the a priori Tsallis entropy for each distribution (A and B) can be defined as
(3)
(4)
where q is an entropic index associated with the nonextensitivity of the system, and is system dependent. Using the pseudo-additivity rule, the corresponding Tsallis entropy Sq(t) can be formulated as
(5) when Sq(t) is maximized, the luminance level t is
considered the optimum threshold value. The optimal thresholds can then be obtained by maximizing Sq(t), i.e.,
(6)
B. Multilevel Thresholding
The thresholding method using Tsallis entropy has been extended to multilevel thresholding, and it can be described as follows:
(7)
(8)
1 2
: , ,..., t
A A A A
p p p p
p p p
1 2
: t , t ,..., L
B B B B
p p p
p
p p p
1
t A
i i
p
p1
L B
i i t
p
p1
A B
p
p
1
1 ( )
( )
1
t i q
A i A
q
p p S t
q
1
1 ( )
( )
1
L i q
B i t B
q
p p S t
q
( ) A( ) B( ) (1 ) A( ) B( )
q q q q q
S t S t S t q S t S t
arg max[ ( ) ( ) (1 ) ( ) ( )]
Tsallis A B A B
opt q q q q
t S t S t q S t S t
1
1 2 1: 1, 1,..., 1
t
t t t t
p
p p
p
p p p
1 1 1 2
: tn , tn ,..., tn
tn tn tn tn
p p p
p
p p p
(9)
where , ,
and =1. Similar to the bi-level
thresholding problem, the relevant Tsallis entropy Sq(t)
can be formulated as
(10)
Thus, n optimal thresholds can be obtained by maximizing Sq(t), i.e.,
1 2 ( 1) 1 2 ( 1)
arg max[ ( ) ( ) ( ) ( )
(1 ) ( ) ( ) ( ) ( )]
Tsallis t t tn t n
opt q q q q
t t tn t n
q q q q
t S t S t S t S t
q S t S t S t S t
(11)
III. BACTERIA FORAGING ALGORITHM
As prokaryotic unicellular organisms, Echerichia coli (E.coli) bacteria exhibit excellent organization and construction capabilities through their colony behaviors[34]. One such important and fascinating behavior is their food-searching behavior, in particular, the process through which they find nutrients, avoid noxious substances, while simultaneously moving towards other cells without being extremely close to them. Inspired by this food-searching behavior of E.coli bacteria, and based on their foraging behavior, a new optimization algorithm, known as the bacterial foraging (BF) algorithm, was introduced by Passino[22]. This new algorithm considers not only chemotactical strategy but also other stages of bacterial foraging behavior, such as swarming, reproduction, and elimination and dispersal. In the following, we briefly describe these four important components.
A. Chemotaxis
Chemotaxis is cell movement in response to gradients of chemical concentrations in the environment. As a survival strategy, this movement is achieved by swimming and tumbling using flagella, where each flagellum is driven as a biological motor. An E.coli bacterium moves by alternately swimming and tumbling. It can either swim for a while in the same direction, or it will probably tumble. Throughout the life cycle, it is always conducted these two external activities. In order to describe a tumble, we set a unit length (j) in a random direction. Meanwhile, it also indicates the direction of movement after a tumble. The chemotactic movement of the bacterium can thus be described as
i(j+1, k, l)=i(j, k, l)+C(i)(j) (12)
where i(j, k, l) represents the ith bacterium at the jth
chemotaxis, the kth reproduction, and the lth elimination-dispersal step, and C(i) is the specified step value after a tumble.
B. Swarming
While a bacterium moves to the optimal area for food, it is always eager for the bacterium to find the best
position as well as to produce strong signals of attraction to other bacteria. It will allow them to gather to reach their desired zone. During this process, E.coli cells release an attractant aspertate to help them cluster together. Then, they move as concentrated mode of population with high density. The internal signal mechanism in an E.coli swarm can be expressed as
(13)
where is the objective function value to be added to the original objective function that is optimized to present a time-varying objective function, s is the total number of bacteria, n is the number of variables present in each bacterium to be optimized, and θ=[θ1, θ2,…,θn]T is a point in an n-dimensional search space. In addition, dattract and wattract are the depth of an
attractant released by a cell, and the width of the attractant signal, respectively. On the contrary, hrepellant is
the height of the repellant effect magnitude, and wrepellant
is the width of the repellant. The values for these parameters should be properly selected during the swarming process.
C. Reproduction
Let Nc be the lifetime of a bacterium, as measured by
the number of chemotactic steps that they execute during their life. When all the Nc chemotactic steps have been
completed, a reproduction will appear in the bacteria. The health value of bacterium i can be represented by
(14)
Further, all bacteria will be sorted according to the corresponding health value in the descending order. This means that the least healthy bacteria eventually die whereas each of the healthier bacteria (those located in a search domain with a high nutrient concentration) split asexually into two bacteria, which are then placed in the same location, thereby maintaining a constant swarm size. D. Elimination and Dispersal
In the local environment of the bacteria, some gradual or unexpected changes (such as a suddenly rise of local temperature) might lead to a mass mortality of a group of bacteria located at a high nutrient concentration area, or may disperse these bacteria into a new location within the environment. These changes will have an impact on the possibility of destroying or assisting in the chemotaxis progress to a certain extent since a dispersal action likely places the bacteria near a good food source.
IV. THE PROPOSED ALGORITHM
Dasgupta et al. investigated the potential of implementing bacterial chemotaxis as a distributed optimization process, and concluded that a mechanism of
1 2
( 1): ( 1), ( 1),..., ( 1)
n n
t t L
t n t n t n t n
p p p
p
p p p
1
1 1
t t
i i
p
p1 1 n
n t tn
i i t
p p
( 1)1
n L t n
i i t
p
p1 ( 1)
t tn t n
p p p
1 2 ( 1) 1 2 ( 1)
( ) ( ) ( ) ( ) ( )
(1 ) ( ) ( ) ( ) ( )
t t tn t n
q q q q q
t t tn t n
q q q q
S t S t S t S t S t
q S t S t S t S t
1
2 ,
1 1
2 ,
1 1
( , ( , , )) ( , ( , , ))
[ exp( ( ) )]
[ exp( ( ) )]
s
cc i cc i
s n
attract attract m i m
i m
s n
repellant repellant m i m
i m
J P j k l J j k l
d w
h w
( , ( , , ))
cc
J P j k l
, 1 ( , , , )
C
N
i health i sw
individual iteration and collective communication in the bacterial colonies exists[25]. This mechanism imparts the BFOA procedure certain advantages in the discrete optimization problem. When utilizing the BFOA in image segmentation, the image segmentation can be seen as a discrete optimization process. Thus, in our research, we improve the convergence rate and the global searching ability further to enhance the quality of the final solution. The implementation details are described in the following section.
A. Modification during the Reproduction Process In the original BF algorithm, the weakest Sr bacteria
die, and among the Sr healthiest bacteria, each bacterium
splits into two bacteria that are placed in the same location. Although this ensures that the population of bacteria remains constant, it causes a loss of solution diversity. In an actual bacterial colony, some weak bacteria know that if they move towards a stronger bacterium, they will find a better nutrient area, where we assume that each weak bacterium randomly choose a strong bacterium from the Sr healthiest bacteria and
moves to a position near the strong bacterium selected, and maintain the same direction with the bacterium selected. Therefore,
Fc(j,k,l)=(CSmax-j)/CSmax
weak,d(j,k,l)=weak,d(j,k,l)+(strong,d(j,k,l)-… weak,d(j,k,l))Fc(j,k,l) (15)
where CSmax is the maximum number of chemotactic steps, j is the index for each chemotactic step, strong(j,k,l)
denotes the location of a strong bacterium from Sr
healthiest bacteria, and weak(j,k,l) denotes the current
location of the weak bacterium.
B. PSO Operator in the Chemotactic Step
To quicken the convergence rate and improve the quality of the final solution, a PSO operator (velocity-displacement) is incorporated into each chemotactic step. During this process, the ith bacterium is stochastically attracted to both the locally and globally best position. The former is the best previously visited position of the ith bacterium, and the latter is the best global position of the swarm located thus far. At each dimension d, the ith bacterium’s velocity and new position can be updated as follows:
(16)
(17)
where is the environment-dependent inertia weight that controls the impact of the previous velocity of the bacterium on its current iteration, = ( ) is the best previous position discovered by the ith
bacterium, and = indicates the
global best position discovered by the entire swarm. In addition, c1 and c2 are two constants known as cognitive and social coefficients that determine the weight of
and , respectively. In addition, r1 and r2 are independently and uniformly distributed random variables with the range (0, 1). The velocity of each bacterium for each dimension is clamped to a maximum magnitude specified by the user. If exceeds a positive constant value, , the velocity of the dimension is then assigned to .
C. Description of the MBFO Algorithm
The pseudo code of the MBFO algorithm can be described as follows:
1) Initialize the number of bacteria (s), number of variables to be optimized (n), number of chemotactic steps (Nc), maximum swimming length (Ns), number of reproduction steps (Nre),
number of elimination- dispersal events (Ned),
probability of elimination and dispersal (Ped),
maximum number of chemotactic steps Nc, inertia
weight (w), acceleration constant (c), position of each bacterium ( ), and velocity of the ith bacterium (Vi). In addition, initialize all counter
values to zero.
2) Update the following parameters:
Ji(j, k, l): The cost or value of the objective function
for the ith bacterium in the jth chemotaxis, the kth reproduction, and the lth elimination-dispersal loop.
: The best previously visited position of the ith bacterium.
: The global best position of the swarm discovered thus far.
: Fitness of the best position found thus far by the bacterium.
It should be mentioned here that the new position of each bacterium corresponds to a potential threshold in the course of bacterial movement. Image segmentation is treated as a discrete optimization problem. Therefore, the optimal thresholds are obtained by maximizing the Tsallis thresholding functions.
3) Elimination-dispersal loop: l = l + 1.
4) Reproduction loop: k = k + 1.
5) Chemotaxis loop: j = j + 1.
5.1) For i = 1, 2, …, s, execute a chemotactic step for bacterium i as follows:
5.2) Compute the value of objective function Ji(j, k, l) using Eq. (10).
5.3) Jlast= Ji(j, k, l) is saved for a comparison with
other J values because we may arrive at a better cost through a run.
5.4) Tumble: Generate a random vector with each element , m = 1, 2, …, n, which is a random number within [-1, 1].
5.5) Move:Let
. ,
new i d
V ,
new i d
, , 1 1 , ,
2 2 , ,
( ( 1, , ))
( ( 1, , ))
p
new old old
i d d i d i d i d
old g d i d
V w V c r j k l
c r j k l
, ( 1, , ) , ( 1, , ) ,
new old new
i d j k l i d j k l Vi d
d
w
p
i
,1, ,2,..., ,1
p p p
i i i
g
(
g,1, g,2,...,
g D, )p
i
g
max
V
|
V
i d,|
max,d
V
, max,
(|
i d|)
dsign V
V
( , , )
i j k l
p
i
g
( , , )
best
J j k l
( )i ( )
m i
( )
(
1, , )
( , , )
( )
( ) ( )
i i
T
i
j
k l
j k l
C i
i
i
This results in a step of size of C(i) in the direction of the tumble for bacterium i.
5.6) Compute Ji(j + 1, k, l).
5.7)Swim:
5.7.1) Let t = 0 (counter for the swim length)
5.7.2) While t < Ns (if the bacteria have not climbed down for considerably long).
5.7.2.1) Let t = t + 1.
5.7.2.2)If Ji(j + 1, k, l) > Jlast, then Jlast = Ji(j + 1, k, l), and let
= +
, and use
to compute the new Ji(j + 1, k, l), similar to
step 5.6.
5.7.2.3) Else, let t = Ns.
5.7.3) Go to the next bacterium (i + 1) if i ≠ s (i.e., go to 5.2) to process the next bacterium.
5.8) End For
5.9) Adjust the position of the bacteria using a PSO operator.
For i = 1 To s (i = 1, 2, …, s)
5.9.1) Update , , and .
5.9.2) Update the position and velocity of the dth coordinate of the ith bacterium according to Eqs. (16) and (17).
6) If j < Nc, go to 5). In this case, continue the chemotaxis because the life of the bacteria has not yet terminated.
7) Reproduction:
7.1) For the given k and l, for each i = 1, 2, …, s, compute the Ji, health value using Eq. (14).
7.2) Sort the bacteria in order of descending Ji, health
values. A lower value generally means that the health of the bacterium is worse.
7.3) For the Sr bacteria with the lowest health
values, each bacterium moves its location approaching a strong bacterium and maintains the same direction, using Eq. (15).
8) If k < Nre, go to step 4 to start the next generation
in the chemotactic loop; else, go to step 9.
9) Elimination-dispersal: For i = 1, 2, …, s with probability ped and corresponding random number ri,
eliminate and disperse each bacterium i; this results in the number of bacteria in the population remaining constant. To do so, if ri ≤ Ped, then
bacterium i is dispersed to a random location within the optimization domain; else, bacterium i remains at its original location.
10) If l < Ned, then go to step 3; otherwise, output the
results and terminate.
TABLE I
PARAMETERS USED FOR MBFO,BF,PSO,GA,AND HCOCLPSO. Parameters MBFO BF PSO GA HCOCLPSO
Number of
bacteria (s) 20 20 — — — Number of chemo-
tactic steps (Nc) 10 5 — — — Swimming length
(Ns)
10 5 — — — Number of
reprodu- ction steps (Nre)
4 4 — — —
Number of elimina- tions of dispersal events (Ned)
2 2 — — —
Depth of attractant
(dattract) 0.1 0.1 — — — Width of attractant
(wattract) 0.2 0.2 — — — Height of repellent
(hrepellent)
0.15 0.2 — — — Width of repellent
(wrepellent) 0.1 0.1 — — — Probability of
elim- ination and disper- sal (Ped)
0.03 — — — —
The inertia weight (w)
[0.9, 0.3] —
[0.01
, 0.9] — [0.6, 1] The acceleration
constant (c1, c2) 2, 2 — 2, 2 — —
Particle velocity
(V) [0, 10] — [0,
10] — — Number of
particles (N) — — 20 — — Number of genera-
tions (NG) — — 100 — — Number of chrom-
osomes (N) — — — 50 — Number of gener-
ations (NG) — — — 200 — Crossover
probability (Pc) — — — 0.6 — Mutation
probability (Pm) — — — 0.1 — Number of
particles for each one-dimensional swarm (NP)
— — — — 20
Initialization range for the positions of the particles (Pp)
— — — — [0, 20]
Slope of inertia
weight (Miw) — — — — 2.5 × 10 -4
Selection
probability (Pc) — — — —
0.2
V. EXPERIMENTAL RESULTS AND PERFORMANCES COMPARISON
The performance of the proposed algorithm was evaluated by comparing its results with other popular algorithms, such as BF, PSO, GA, and HCOCLPSO[32]. These algorithms were implemented using Matlab 7.0 on an Intel Pentium CPU at 2.8 GHz, running Windows XP. Four benchmark images, namely Lena, Cameraman, Peppers, and Living room, with image sizes of 512 × 512, 512 × 512, 256 × 256, and 512 × 512 pixels, respectively, were used to conduct the experiments.
The actual implementation performance during our experiments was dependent upon many free parameters. It is well known that determining the best set of such parameters is considerably difficult and nearly impossible. ( 1, , )
i j k l
i( , , )j k l
( ) ( )
( ) ( )
T
i C i
i i
)
,
,
1
(
j
k
l
i
p
i
Therefore, the parameters of the proposed and other comparison algorithms were selected after the test. Many
(a)
(b)
(c)
(d)
Figure 1. Test images and their corresponding histograms: (a) Lena, (b) Cameraman, (c) Peppers, and (d) Living room.
different alternative values were tested, and we selected those values that provided the best computational results in terms of the optimal thresholds and corresponding computational times. The selected parameters are listed in TableⅠ.
To evaluate our method quantitatively, we simulated different histograms describing the object and background based on different peaks. The original images and their corresponding histograms are shown in Figure 1. We compared all results of MBFO with the four heuristic algorithms (BF, PSO, GA, and HCOCLPSO) in terms of their optimal threshold values, optimal objective values, CPU time, number of evaluations, and number of iterations. Tables II and III show the optimal thresholds obtained (with c = 2, 3, and 4) and their corresponding optimal objective values, respectively. It is worth
mentioning that the segmentation results for multilevel thresholding depend on the objective function to be optimized; higher values of the objective function ensures better segmentation results. From the visual values in Table III, we can see that the optimal objective values of our method in the four test images vary from 0.8918 to 1.66718 with a mean of 1.29231, which is higher than the objective values of the other four methods. This means that the optimal thresholds produced by MBFO are better than those of the other algorithms. Moreover, to compare the different algorithms, a fair time measure must be selected. Number of iterations cannot be used as a time measure because these algorithms conduct different amounts of work in their inner loops. Therefore, while the optimal objective values are found, or the maximum generation is reached, we adopt the average runtime (CPU time) of twenty runs as a time measure, as well as the number of evaluations of the objective function. After twenty trials of the algorithm, the simulation results were obtained and are shown in Table III. It can be seen that the computational time and number of evaluations of MBFO and the other four algorithms increases significantly with the number of thresholds (c). However, it is worth noting that our method has a shorter computation time and has fewer evaluations, suggesting a faster convergence rate to the optimal objective value owing to the incorporation of a PSO operator (velocity-displacement) into each chemotactic step. The results shown in Table III indicate that MBFO significantly outperforms BF, PSO, and GA,and HCOCLPSO in terms of optimal objective values, CPU time, and number of evaluations.
TABLE II
OPTIMAL THRESHOLD VALUES OBTAINED USING MBFO,BF,PSO,GA, AND HCOCLPSO.
Images c
Optimal threshold values
MBFO BF PSO GA HCOC
LPSO
Lena
2 120, 165 120,
165 120, 165 120, 165 120, 165
3 81, 123, 177
81, 124, 177
110, 148, 188
99, 159, 182
79, 125, 176
4 85, 124, 163, 194
85, 124, 161, 192
86, 117, 163, 201
86, 121, 150, 201
83, 120, 115, 202
Cameraman
2 120, 155 120,
155 120, 155 120, 155 120, 154
3 78, 127, 177
78, 128, 176
78, 121, 174
80, 144, 170
81, 149, 173
4 91, 125, 155, 210
91, 122, 157, 211
82, 122, 155, 200
75, 115, 147, 203
88, 115, 148, 202
Peppers
2 83, 154 83, 154 83, 154 83, 154 83, 154
3 86, 117, 190
86, 118, 176
93, 132, 177
75, 102, 184
64, 117, 164
4 70, 120, 161, 196
71, 120, 161, 199
73, 120, 140, 175
73, 108, 140, 192
73, 102, 143, 195
Living room
2 80, 144 80, 144 80, 144 80, 144 81, 145
3 88, 142, 197
89, 145, 199
90, 137, 199
88, 116, 177
88, 117, 189
4 67, 104, 146, 190
67, 105, 146, 188
88, 125, 166, 201
90, 126, 157, 198
TABLE III
COMPARISON OF OPTIMAL OBJECTIVE VALUES OBTAINED USING MBFO,BF,PSO,GA,AND HCOCLPSO.
Images c
Optimal objective values, CPU time (s), number of evaluations, number of iterations
MBFO BF PSO GA HCOCLP
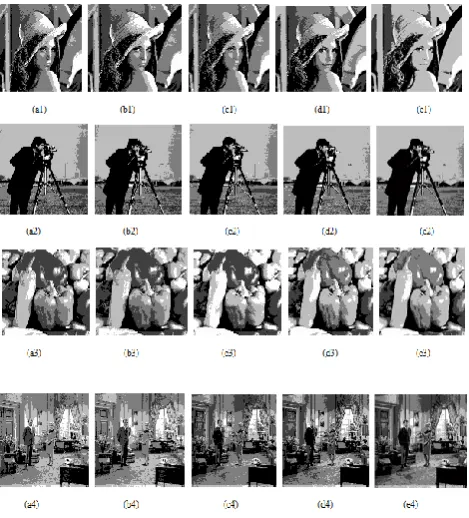
SO Lena 2 0.89180, 2.0503, 105 51 0.89180, 3.0903, 150 76 0.89180, 3.1305, 148 72 0.89180, 2.0506, 139 66 0.89170, 3.2012, 108 52 3 1.31026, 10.2322, 304 148 1.29629, 18.7923, 403 191 1.29627, 20.1276, 503 245 1.29625, 25.2312, 512 265 1.39023, 27.2127, 368 181 4 1.66718, 36.4212, 425 206 1.65427, 102.3218, 632 311 1.65425, 116.8915, 759 345 1.65421, 130.4532, 894 425 1.64378, 120.2386, 632 306 Cameraman 2 0.90168, 1.0564, 98 46 0.90168, 3.0341, 118 58 0.90168, 2.1902, 153 77 0.90168, 2.3561, 165 81 0.97563, 3.2013, 131 64 3 1.29987, 9.0231, 298 152 1.29591, 15.2318, 538 265 1.29532, 19.0216, 490 246 1.29624, 25.0189, 480 242 1.30231, 21.3212, 305 147 4 1.71453, 28.9071, 395 182 1.66012, 89.3207, 865 405 1.65419, 91.0275, 821 391 1.65428, 102.8935, 853 401 1.83213, 91.2351, 621 304 Pepper 2 0.90181, 3.0124, 112 57 0.90181, 4.1148, 156 78 0.90181, 4.7621, 160 80 0.90181, 3.1893, 132 61 0.98231, 4.3923, 150 74 3 1.30119, 11.1015, 305 156 1.29630, 17.0982, 487 249 1.29627, 21.8933, 498 254 1.29626, 30. 1908, 368 180 1.56389, 32.2562, 398 184 4 1.65928, 41.3219, 413 192 1.65426, 117.4902, 893 416 1.65425, 127.4378, 943 168 1.60237, 150.3212, 538 264 1.76402, 142.3128, 783 356 Living room 2 0.89818, 1.0983, 129 56 0.89818, 2.8931, 139 61 0.89818, 3.5789, 123 54 0.89818, 2.2319, 139 61 0.93102, 4.3219, 147 71 3 1.30178, 15.2189, 329 156 1.29627, 19.0156, 398 182 1.29628, 22.0183, 436 216 1.29626, 28.8912, 362 179 1.40253, 25.2313, 403 190 4 1.66014, 40.2327, 465 217 1.65319, 120.1231, 673 328 1.65372, 128.0912, 862 413 1.65424, 152.2198, 762 359 1.79327, 165.2397, 821 389 The segmentation results for MBFO, BF, PSO, GA, and HCOCLPSO are shown in Figures 2 and 3 (with c = 3, 4). From a visualization perspective, it is obvious that the results of MBFO are more accurate than those of the other four methods. For example, Cameraman is a gray-scale image, and Figure 2 (a2-e2) and Figure 3 (a2-e2) show thresholded images of three and four levels, respectively. The results show that using the proposed algorithm the cameraman and background buildings are divided into dark parts, whereas a majority of the smooth grassland and the sky is divided into gray parts. The main features of the image, such as the cameraman, the smooth grass, and the nearby buildings are well preserved. Figures 2(b2) and 3(b2), and Figures 2(c2) and 3(c2), show the results from the BF and PSO methods, respectively. Meanwhile, Figures 2(d2) and 3(d2) and Figures 2(e2) and 3(e2) are the segmentation results of GA and HCOCLPSO, respectively. These figures show that the quality of the segmented image results from applying the MBFO method is superior to that obtained through the other methods. Moreover, for all of the test images, increasing the number of thresholds increases the quality of the segmented images,i.e., the quality of segmentation improves on applying c = 3 from c = 4;it must be noted that the MBFO method demonstrates the most superior improvements in segmen- tation among all
methods compared. In Figures 2 and 3, we can observe a better intensity contrast between the objective and background on using the MBFO and other methods. However, the MBFO method is able to expose the contours of the different objectives. Thus, it is clear that the proposed MBFO method can achieve significantly better segmentation results, as demonstrated by the higher optimal objective values in each case, when compared to the other methods.
Figure 2. Three-level threshold images obtained using (a) MBFO, (b) BF, (c) PSO, (d) GA, and (e) HCOCLPSO
To analyze quantitatively the differences among the different methods used, we can evaluate the stability of the evolutionary algorithms; this approach has been broadly utilized in several researches[30,31]. This stability measure can be given as
(18)
Where std represents the standard deviation, k is the number of runs of each algorithm (k = 100), σi is the best
objective value obtained by the ith run of the algorithm, and u is equal to the mean value of σ. Note that the standard deviation of the solutions indicates the stability of the algorithms. A lower value of std indicates a better stability in the neighborhood of the optimal objective value, depicting a better quality of the corresponding thresholds, and thus a lower value for the standard deviation indicates a better stability of the method used. Conversely, a higher value of std means a worse quality of the thresholding procedure. Table Ⅳ shows a comparative study of the stability measures obtained using the five methods for the different images. It can be easily seen that the proposed MBFO obtains lower std values than other methods for each case. The results of std using MBFO vary from 0 to 3.5231e-6, while other methods fail to reach even an std value of 7.8345e-004. This implies that the results obtained using MBFO are more stable than the other methods for all test images.
TABLE IV.
STANDARD DEVIATIONS OBTAINED BY THE MBFO,BF,PSO,GA,AND HCOCLPSO METHODS.
Images c
Standard Deviation (std)
MBFO BF PSO GA HCOCLPSO
Lena 2
0.0001 0.0001 0.0001 0.0001 0.0001 3
1.66E-06 1.68E-06 2.65E-06 3.89E-06 3.12E-06 4
3.30E-06 3.51E-06 1.34E-05 1.98E-05 1.26E-05
Camer aman
2
1.00E-09 1.00E-09 1.00E-09 1.00E-09 1.00E-09 3
4.50E-06 4.94E-06 5.48E-06 8.89E-06 7.57E-05 4
3.52E-06 3.68E-06 6.3567E-05 0.000098
78 3.86E-06
Pepper 2
0 0 0 0 0
3
2.80E-06 3.56E-06 7.87E-06 3.87E-05 5.36E-06 4
1.65E-06 1.69E-06 8.0123E-05 1.76E-04 2.35E-05
Living room
2
0 0 0 0 0
3
1.57E-06 1.60E-06 7.0154E-05 0.000783
45 1.86E-06 4
4.76E-06 4.89E-06 8.54E-06 0.000023
129 4.32E-06
VI. CONCLUSIONS
In this paper, an improved bacterial foraging (MBFO) algorithm based on multilevel thresholding was presented. To solve the image segmentation problem, we used a hybrid approach involving PSO and the BF algorithm to improve the global searching ability and convergence rate of the original BF algorithm, and achieved a significant improvement in the process of bacteria reproduction. The results for various types of images show that the proposed
algorithm is considerably efficient and feasible for use in the segmentation process.
Our future work will focus on comparing the proposed algorithm with other segmentation methods. To improve the quality of the segmented images further, we will add other meta-heuristics to the proposed algorithm for testing its feasibility for use in other types of image processing applications.
ACKNOWLEDGMENT
This study was supported by the National Natural Science Foundation of China (Grant No. 61202313, 61202318), the Natural Science Foundation of Jiangxi Province of China (GJJ13637, 2013BAB211020), and the Natural Science Foundation of Fujian Province (2012D109).
REFERENCES
[1] W. X. Kang, Q. Q. Yang, R. P. Liang, “The comparative research on image segmentation algorithms, ”in: Proc. Of First International Workshop on Education Technology and Computer Science, IEEE Computer Society, Wuhan, China, 2009, pp. 703-707.
[2] Y. Zimmer, S. Akselrod, “Image segmentation in obstetrics and gynecology,” Ultrasound in Medicine and Biology, vol.26, pp. 39-40, 2000.
[3] T.Anil, B.Dutch,“Review of the basic image processing
and segmentation techniques for biological
images,”Journal of Imaging Science and Technology, vol.50, pp. 233-242,2006.
[4] M. Sezgin, B. Sankur,“Survey over image thresholding
techniques and quantitative performance
evaluation,”Journal of Electronic Imaging,vol. 13, pp.146-165,2004.
[5] M.L. Menendez, Shannon's entropy in exponential families: statistical applications,Applied Mathematics Letters 13 (1) (2000) 37-42.
[6] S.T. Wang, F.L. Chung, “Note on the equivalence relationship between Renyi-entropy based and Tsallis-entropy based image thresholding,” Pattern Recognition Letters,vol. 26, pp.2309-2312,2005.
[7] A. Nakib, H. Oulhadj, P. Siarry, “Image thresholding based on Pareto multiobjective optimization,” Engineering Applications of Artificial Intelligence,vol. 23, pp. 313-320,2010.
[8] L.S. Hibbard, “Region segmentation using information divergence measures,” Medical Image Analysis,vol. 8,pp. [9] J.N. Kapur, P.K. Sahoo, “A new method for gray-level
picture thresholding using the entropy of the histogray,” Computer Vision, Graphics and Image Processing ,vol.29,pp. 273-285, 1985.
[10] A.D. Brink, “Minimum spatial entropy threshold selection,” IEE Proceedings Vision Image & Signal Processing, vol. 142,pp. 128-132,1995.
[11] M. Maitra, A. Chatterjee, “A novel technique for multilevel optimal magnetic resonance brain image thresholding using bacterial foraging,” Measurement , vol.41, 1124-1134,2008.
[12] N. Otsu, “A threshold selection method from gray level histograms,” IEEE Transactions on Systems, Man and Cybernetics SMC-9, pp.62-66,1979.
[13] J. Kittler, J. Illingworth, “Minimum error thresholding, Pattern Recognition,”vol. 19, pp. 41-47, 1986.
[14] M.P. Albuquerque, I.A. Esquef, et al., “Image thresholding
2
1
( )
k i i
u std
k
using Tsallis entropy,”Pattern Recognition Letters,vol. 25,pp.1059-1065, 2004.
[15] S.W. Lu, Z.Q. Wang, J. Shen, “Neuro-fuzzy synergism to
the intelligent system for edge detection and
enhancement,” Pattern Recognition, vol. 36,pp. 2395-2409,2003.
[16] H. Zheng, L.X. Kong, S. Nahavandi, “Automatic inspection of metallic surface defects using genetic algorithms,” Journal of Materials Processing Technology, vol. 125-126, pp. 427-433, 2002.
[17] P. Huang, H.Z. Cao, S.Q. Luo, “An artificial ant colonies approach to medical image segmentation,” Computer Methods and Programs In Biomedicine, vol. 92, pp. 267-273, 2008.
[18] J.J. Liang, A.K. Qin, P.N. Suganthan, S. Baskar, “Comprehensive learning particle swarm optimizer for global optimization of multimodal functions,” IEEE Transactions on Evolutionary Computation, vol.10, [19] J.J. Lu, T.Z. Zhao, Y.F. Zhang, “Feature selection
based-on genetic algorithm for image annotatibased-on,” Knowledge- [20] M.E. Elalami, “A novel image retrieval model based on the
most relevant features,” Knowledge-Based Systems, vol. 24, pp.23-32, 2011.
[21] M.L. Wong, Y.Y. Guo, “Learning Bayesian networks from incomplete databases using a novel evolutionary algorithm,” Decision Support Systems, vol. 45, pp.368-383, 2008.
[22] K.M. Passino, “Biomimicry of bacterial foraging for distributed optimization and control,” IEEE Transactions on Control Systems Magazine, vol. 22,pp.52-67, 2002. [23] M.A. Guzmán, A. Delgado, J.D. Carvalho, “A novel
multiobjective optimization algorithm based on bacterial chemotaxis,” Engineering Application of Artificial Intelligence, vol. 23, pp. 292-301, 2010.
[24] S.D. Müller, J. Marchetto, S. Airaghi, P. Koumoutsakos, “Optimization Based on Bacterial Chemotaxis,” IEEE Transactions on Evolutionary Computation, vol. 6, pp. 16-29, 2002.
[25] S. Dasgupta, S. Das, A. Abraham, A. Biswas, “Adaptive
computational chemotaxis in bacterial foraging
optimization: an analysis,” IEEE Transactions on Evolutionary Computation, vol. 13, pp. 919-941, 2009. [26] P.D.Sathya, R.Kayalvizhi,“Modified bacterial foraging
algorithm based multilevel thresholding for image segmentation,”Engineering Applications of Artificial Intelligence, vol.24, no.2, pp.595-615,2011.
[27] L.Y. Wang, S.P. Yang,“Bacterial foraging optimization combined with relevance vector machine with an improved
kernel for pressure fluctuation of hydroelectric
units,”Journal of Computers, vol.8, no.5,pp.1273-1278,2013.
[28] X.J.Li, D.L.Yang, J.G.Wu, “SVM optimization based on BFA and its application in AE rotor crack fault diagnosis,” Journal of Computer, vol.6.no.10,pp.2084-2091, 2011. [29] S.Suarent, A.Ochoa, S.Jöns F.Montes, et al. , Evolving
optimization to improve diorama's representation using a mosaic image, Journal of Computers, vol.4, no.8, pp.734-737, 2009.
[30] P.D. Sathya, R. Kayalvizhi, “Modified bacterial foraging algorithm based multilevel thresholding for image segmentation,” Engineering Applications of Artificial Intelligence, vol. 24, pp. 595-615, 2011.
[31] P.D. Sathya, R.Kayalvizhi, “Optimum Multilevel Image Thresholding Based on Tsallis Entropy Method with Bacterial Foraging Algorithm,” International Journal of
[32] M.Maitra,A.Chatterjee, “A hybrid
cooperative-comprehensive learning based PSO algorithm for image
segmentation using multilevel thresholding,”Expert Systems with Applications, vol. 34, pp. 1341-1350, 2008. [33] J.L. Lebowitz, “Boltzmann’s entropy and time’s arrow,”
Physics Toady, vol. 46, pp. 32-38,1993.
[34] S.Das, A.Biswas, S. Dasgupta, A. Abraham, Bacterial
Foraging Optimization Algorithm: Theoretical
Foundations, Analysis, and Applications, Springer-Verlag, studies in computation intelligence vol. 203, 2009, 23-55.
Kezong Tang Kezong Tang was born in
1978. He received his M.S. degree in
pattern recognition and intelligent
systems from Jiangsu University of Science and Technology in 2007. Currently, he is a lecturer in School of Information Engineering, Jingdezhen Ceramic Institute. His research interests include image processing and artificial intelli-gence.
Zuoyong Li received the B.S. and M.S. degrees of Computer Science and Technology from Fuzhou University, Fuzhou, PR China, in 2002 and 2006. He received the Ph.D. degree from the School of Computer Science and Technology at Nanjing University of Science and Technology, Nanjing, PR China, in 2010. He is currently an associate professor in Department of Computer Science of Minjiang University, Fuzhou, China. He has published several papers in inter-national/national journals. His current research interest is image processing.
Jun Wu received the Ph.D. degree from the Shanghai Institute of Ceramincs, Chinese Academy of Sciences in 2005. He is currently an associate professor in Jingdezhen Ceramic Institute, China. He has published a number of papers in
inter-national/national journals. His
current research interest is image processing and analysis of ancient elements.