ISSN (Online): 2320-9364, ISSN (Print): 2320-9356
www.ijres.org Volume 5 Issue 12 ǁ December. 2017 ǁ PP. 08-13
Research on New Energy Bus Big Data Decision Support
Platform
*1
Xu Junming,
2Chen Lingshan
Shanghai University of Engineering Science, Shanghai, China) Corresponding Author:*Xu Junming
ABSTRACT
:
New energy vehicles have the advantages of high energy efficiency, small environmental pollution, many types of clean energy sources, low noise, convenient maintenance and high safety, and become the key direction for the development of public transport in the future. In order to achieve a higher degree of informatization, it facilitates the large-scale application of new energy buses in large cities in China, and the construction of relevant information system platforms is very important. Big data technology establishes the basis for data analysis and application for the new energy bus decision support platform, which can store and process multidimensional data from different data sources, use online analytical processing to achieve multi-dimensional data analysis, and use data mining Technology uses new energy bus information to provide new energy vehicle charging decision charging site construction decision-making, battery capacity and recession analysis and other functions.Keywords
: new energy bus; big data technology; decision support system; vehicle charging decision; battery
capacity analysis--- --- Date of Submission: 04-12-2017 Date of acceptance: 16-12-2017 ---
---I.
INTRODUCTION
With the gradual maturity of new energy vehicles technology, more and more cities will be bus priority and new energy vehicles to promote the development of urban transport direction, the proportion of new energy buses in the city to run a substantial increase in infrastructure built a large number of charging facilities, resulting a lot of charging data, operating data, traffic data. However, the related data-driven platforms are still missing, inefficient data utilization, unclear organizational structure, data storage chaos, massive data redundancy, and insufficient data analysis capabilities can not provide higher-level decision analysis capabilities. How to solve the data interoperability and obtain useful information from the massive data on the operation strategy of new energy vehicles is an important challenge nowadays.
The continuous development of decision support system effectively improves the efficiency of urban public transportation system in the decision-making process and reduces the resource consumption in decision-making. Decision support system is based on computer technology and simulation technology as a means to support semi-structured decision-making and decision-making activities. It can provide decision-makers with data and information, help to identify decision-making objectives and identify problems, and provide decision-making models as well as programs, and various programs for evaluation and screening. Decision support system requires the support of several related technologies: data warehouse technology, data warehouse organized by the theme of the data in the database; online analytical processing technology, online analysis is based on the data warehouse decision analysis system, the most common front-end analysis technology to support complex Analysis of the operation, provide decision support. On-line analysis and processing are presented to users in a multi-dimensional view; and data mining techniques, the hidden rules in massive data and the links between data need to be found through data mining. The main tasks include conceptual description, correlation analysis, classification and prediction, clustering analysis, evolutionary analysis and outlier analysis equivalent. Common methods include statistical analysis, association rules, clustering algorithms, neural networks, decision trees, genetic algorithms, rough sets.
with the characteristics of big data.
In this data warehouse, the data source contains a variety of structured and unstructured data, charging data for new energy vehicles from the Vehicle Internet of Things, charging pile SCADA system, all levels of electricity meters, tank changes and so on. The data includes: station contract capacity, station power factor, station peak electricity, station electricity, station electricity, 400V meter reading, box reading meter number, vehicle route, vehicle number, vehicle Driving mileage, charging time, charging time, charging degree and so on. Data obtained from the data source after classification, cleaning and conversion and other data stored in the data warehouse, as the basis for decision analysis system.
1.1 Based On Multi-Dimensional Data Storage
Charging data is a multi-dimensional data system for multi-typed data sources that divides all data into three categories according to the degree of structure:
(1) The data from the charging pile SCADA system belongs to the structured data, which saves the information of each charging site and the charging information of the vehicle and can be directly loaded into the data warehouse;
(2) Vehicle driving data belongs to semi-structured data and is usually collected by manual records and GPS positioning records to form texts or image data such as route, mileage, driving time and so on, which needs pre-processing and pre-screening. After the data is corrected, it is loaded into the data warehouse.
(3) Unstructured ancillary data, including data on electricity price curve, real-time satellite data (road traffic status), remote sensing data and other complicated formats.
Multidimensional data storage method is different from the traditional relational database storage method. Data cube is used to manage and store data. In the meantime, the multi-dimensional data is displayed and organized, and online OLAP data organization is adopted. OLAP provides data slicing, dicing, rotation and drilling and other operations to analyze the data as the goal, from multiple perspectives, multi-dimensional observation of multi-dimensional structure of the data.
1.2 Distributed Data Warehouse Model Design
Extracting related data from various data sources, establishing distributed data warehouse, and data mining with the support of data warehouse can find out the information that can not be found or even discovered by human statistics, so as to make data utilization rate rise better Support charging decision-making.Traditional data warehousing organizes data according to a star model, a snowflake model or a constellation model in stand-alone mode, which has problems with massive data conditions: high data transfer costs, high data migration costs, and high cost of performing connections; failure to respond quickly to new Demand, when the new demand or change the existing demand, the traditional data warehouse in the entire process from the data source to the previous show, you need to recalculate, this processing cycle is unbearable; data processing inefficient , The traditional data warehouse data operation in a single node to run, can not adapt to the speed of data capacity growth, become the limiting factor to deal with huge amounts of data.
Distributed storage can be easily scaled horizontally, to meet the rapid storage of massive data, computing requirements. Common commercial cloud platforms such as Hadoop, Spark began to be used to build a distributed big data platform. Hadoop open source cloud computing platform consists of HDFS distributed, MapReduce distributed parallel computing framework and HBase distributed database, has been widely used in big data management and analysis, which can simplify the developer's task.
1.3 MapReduce
MapReduce is a programming model introduced by Google that enables parallel processing on a large number of common computers. Combined with the data warehouse, the large data files are divided into small data files to achieve parallel processing of data, which can improve data processing efficiency. MapReduce framework mainly includes two kinds of servers: Independent main server and from the server. The main server is responsible for task scheduling, the task to the slave server, and to monitor.
Input
Slice 0
Slice 1
Slice 2
Slice 3
Slice 4
Map
Map
Map
Sort
Merger
Sort
Merger
Sort
Merger
Reduce
Reduce
Reduce
Output
Output Output
Figure 1 MapReduce basic framework
MapReduce framework has the following three characteristics:
(1) Reliability. Large-scale operations on the data set are distributed to all nodes on the network, and each node returns the result after the calculation is completed. If one node fails, the master node reassigns the node's work to other nodes.
(2) High efficiency. Using parallel distributed computing, work is effectively assigned to different nodes, reducing the dependence on node performance, while improving efficiency.
(3) Scalability. The system can increase resources and increase flexibility without affecting the existing business.
II.
SYSTEM ARCHITECTURE
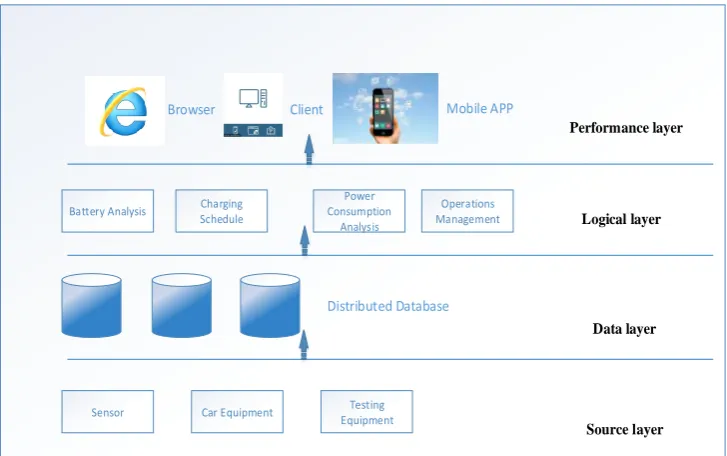
Based on big data, the new energy bus charging decision-making analysis platform is divided into four layers, namely source layer, data layer, logic layer and presentation layer. Hierarchy shown in Figure 2.
Battery Analysis Charging Schedule
Power Consumption
Analysis
Operations Management
Car Equipment
Sensor Testing
Equipment
Distributed Database
Browser Client Mobile APP
Performance layer
Logical layer
Data layer
Source layer
Figure 2 Big data decision analysis system architecture
2.2 Data layer
This layer uses the data warehouse data integration method, and the data obtained from the source layer goes through three steps: extracting data, converting data and loading data. These three steps determine what system to get from which data, to ensure the integrity and consistency of the data, the processed data is stored in the data warehouse, and to deal with the completion of the load after the assembly work to build higher-level multi-source oriented Data Mart.
2.3 Logical layer
Logic layer is the core of decision support system, according to the actual needs of the use of multi-dimensional data analysis, data mining and other algorithms. Support dynamic analysis of the report data rotation, slicing and stratification, to help users from all aspects of data analysis and comparison. Provide common analysis models to improve system versatility and flexibility. When faced with complex, new type of decision-making needs, specific data is extracted from the data layer to create a thematic data mart.
2.4 Performance layer
The lower the results of various business integration, processing, provided to the user. Allows users to access through the browser, client, mobile terminal and other terminals.
3.Decision support strategy
The core business of the new energy electric vehicle big data decision support platform is to provide new energy vehicle operation decision-making, involving fault analysis, charging pile utilization rate analysis, High and low peakanalysis, working weekend comparative analysis, annual contract load analysis, monthly quota usage analysis, Power consumption per hundred kilometers, etc., through the trend, status data analysis, time log, the use of operational control charts, range control charts, the formation of daily management of data guidance and industry technical decision support. The new energy bus big data decision-making platform mainly includes three aspects of decision analysis:
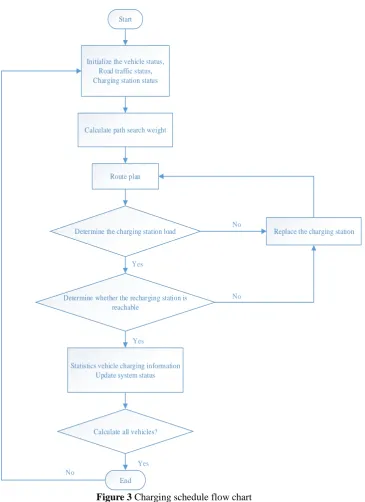
3.1 Intelligent charging schedule
The purpose of intelligent charging scheduling is to improve the overall efficiency of the power grid, increase the utilization of electric power in the field of traffic energy and maximize the cost savings. Intelligent charging scheduling based on grid system optimization and traffic-based optimization. When a large number of electric vehicles are connected to the grid at the same time for charging, the load of the grid will increase, resulting in grid voltage deviations and grid losses. Optimization based on traffic conditions reduces the transfer costs of electric vehicles and at the same time reduces traffic load on the road network. It is not enough alone to consider the optimization of the grid system or to consider the optimization of traffic conditions.
Considering the mileage of electric vehicles, the charging time, the location of charging facilities, the design of EV charging scheduling strategy is as follows:
(1) Initialize EV status and road traffic network status: Initialize the mileage, battery capacity, charging power, road congestion rate, charging station load and other information to establish the weight value in the route search process.
(2) Charging route planning: Calculate the weight of vehicle condition and traffic condition, and search for the set of charging routes with the least comprehensive weight.
(3) Query charging station load: Judge whether the target charging station voltage is overloaded, and whether it is beyond the maximum capacity of the vehicle. If the target charging station can not support more charging vehicles, exclude the charging station.
(4) To determine whether the electric car can successfully reach the charging station: to determine whether the charging station is within the range of remaining electric vehicles.
(5) Predict the EV charging time and forecast the network traffic: estimate the status change and update the system status.
No
Start
Initialize the vehicle status, Road traffic status, Charging station status
Calculate path search weight
Route plan
Determine the charging station load
Determine whether the recharging station is reachable
Statistics vehicle charging information Update system status
Calculate all vehicles?
End
Replace the charging station
Yes No
Yes Yes
No
Figure 3 Charging schedule flow chart
3.2 Parking plan
electrolytes and electrolytes. Under different charge and discharge conditions, battery life and capacity decay vary widely. Traditional battery life and capacity decay research methods is to study the lithium battery internal reaction mode, including the electrode and fluid, electrolyte, electrode and electrolyte interface between the reaction, can not detect internal changes in use. The battery life and capacity decay curve are different in different usage modes and operating states, but the battery capacity decay is the same in similar and similar modes. Using the big data decision analysis platform records each new energy bus charging and discharging process and battery usage records, life and capacity of different modes of use patterns of recession clustering can be targeted to predict the battery life and capacity attenuation.
According to the battery state clustering results, the battery charge and discharge process and the use of statistics, the establishment of a number of battery status categories, and then use the hidden Markov model to establish battery degradation model:
(1) Establish the battery downturn point, that is, when the battery into recession.
(2) Set the number of states, that is, the number of battery decline mode. Cluster analysis of various battery usage patterns, clustering battery usage patterns into recession mode.
(3) Set the state transition matrix. Based on the recorded charge and discharge patterns, the probability of state transition is calculated from the state transition matrix.
(4) Set the initial state, according to the specific state of the battery to set the initial state. Hidden Markov deduction formula can be calculated according to the system state parameters to predict the specified battery life and capacity attenuation process.
III.
CONCLUSION
With the advent of the new energy era and the development of big data technologies, this has brought revolutionary opportunities for urban development. New energy bus big data decision analysis platform is an important tool to achieve intelligent public transport management. The key of decision-making analysis platform for big data is distributed data storage strategy and data mining strategy for different tasks. Based on this, a decision analytic system model is formed. In this paper, a distributed big data decision analytic platform is implemented. According to the scenario of using new energy buses, this paper studies the intelligent charging strategy of electric vehicles, the method of setting parking lot stations and the prediction methods of battery capacity and recession, Decision-making platform provides technical support.
REFERENCES
[1]. Gong H,Wang M Q,Wang H.New energy vehicles in China:policies,demonstration,and
progress[J].Mitigatio and Adaptation Strategies for Global Change,2013,18(2):207-228.
[2]. Shvachko K,Kuang H,Radia S,et a1.The Hadoop distributed file system[C]//2010 IEEE 26th
symposium on mass storage systems and technologies(MSST).IEEE,2010:1-10.
[3]. Stonebraker M,Abadi D J,Madden S,et al.Map Reduce and parallel DBMSS:friends or foes
[J].Communications of the ACM,2010,53(1):64-71.
[4]. Wong P C,Shen H W,Chen C,et al.Top ten interaction challenges in extreme-scale visual analytics
[J].Computer Graphics and Applications,2012,32(4):63-67.
[5]. Simplified data processing on large clusters:Dean J,Ghemawat S.MapP,.educe:simplified data
processing onlarge clusters[J].Communications of the ACM,2008,51(1):107—113
[6]. Chang L, Jiu X, Mao M,et al. Voltage regulation of microgrids containing electric vehicles[C]// IEEE, International Power Electronics and Motion Control Conference. IEEE, 2016:3756-3763.