ISSN (e): 2250-3021, ISSN (p): 2278-8719 Vol. 04, Issue 05 (May. 2014), ||V1|| PP 01-06
Design, Fabrication and Performance Evaluation of a Hardness
Testing Machine
Awotunde W.O, Olatunde O. B, Ponle E. A, Fatukasi S. O
1. Mechanical Engineering Department, Faculty of Engineering, Osun State Polytechnic, Iree. PMB 301, Nigeria.
Abstract: -Hardness is one of the most important properties of engineering materials. It provides indication for material selection and also quality assurance tests for wear resistance. A Hardness Testing Machine was Designed, Fabricated and Tested. Four samples used for the machine evaluation were, mild steel, brass, Aluminum and copper. Standard Test procedure for Brinell Hardness Test was followed in testing for the fabricated Hardness Testing machine. Eight varying loads were applied at intervals of 30secs. The results recorded were represented graphically; results show that mild steel is the hardest of the samples followed by brass, Aluminum and copper in order of decreasing Hardness.
Keywords: - Hardness, Samples, Brinell Test, Machine
I. INTRODUCTION
Testing of material cannot be over emphasized. This is in order to predict and ascertain their performance in service. Testing; tensile, hardness, ductility, impart, bending are all integral part of engineering (Samuel, 2009). Hardness test involve pushing of the indenter to hit a material under test to determine its capacity to withstand indentation and its resistance to plastic defection, abrasion matching and scratching (Ryder, 1978). Hardness test is majorly used to express fundamental mechanical properties of a material under applied load. This eventually helps in design analysis and proper material specification.
Hardness of a material can be said to be its measure of resistance to various kinds of permanent shape change when a force is applied. Hardness of a material is dependent on ductility, elasticity, plasticity, strength, toughness, viscoelasticity and viscosity (Maalzbender, 2003). The mechanical properties of materials are the intrinsic properties that govern the material as they respond to subjected forces under various conditions. This study is on design, fabrication and performance evaluation of a hardness testing machine. The aim is to forestall scarcity of the machine in various institution of learning, reduce cost of production and also improve on existing hardness testing machines not compromising simplicity and ease of operation.
II. METHODOLOGY
The machine follows working principle of other hardness testing machines. The test was carried out on four specimen material namely, copper, Aluminum, Brass and Mild steel
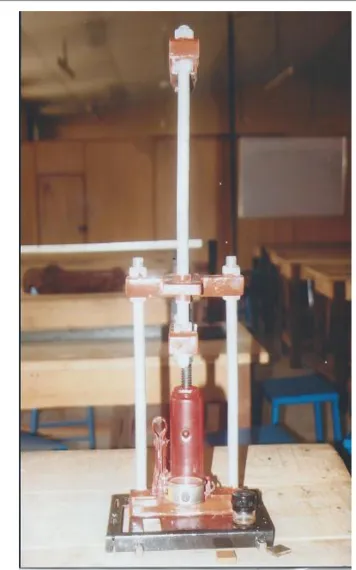
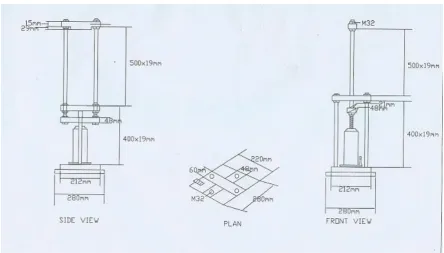
2.1 Description of Machine
The machine consist of a base support made of mild steel, this support was made rigid enough to accommodate the platform and the whole setup. A lower bar in which holes were drilled and tapered to house the cross bar links is fabricated making use of mild steel. The cross link bars are the circular rods linking the upper and lower cross heads. They are made up of stainless steel. The middle bar can be said to be another ‘lower bar’ that accommodates the other end of the cross link bar. Another bar similar to the middle bar, thus, different in shape. A selected hydraulic press incorporated to measure the pressure exerted during test.
2.2 Basic Design
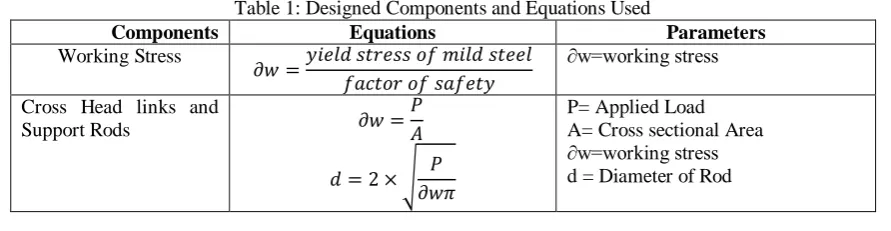
Table 1: Designed Components and Equations Used
Components Equations Parameters
Working Stress
𝜕𝑤 =𝑦𝑖𝑒𝑙𝑑 𝑠𝑡𝑟𝑒𝑠𝑠 𝑜𝑓 𝑚𝑖𝑙𝑑 𝑠𝑡𝑒𝑒𝑙 𝑓𝑎𝑐𝑡𝑜𝑟 𝑜𝑓 𝑠𝑎𝑓𝑒𝑡𝑦
∂w=working stress
Cross Head links and
Support Rods 𝜕𝑤 =
𝑃 𝐴
Upper bar and Base bar 𝐴 = 𝐿𝐵 𝑉 = 𝐴 𝑊 = 𝜌𝑉𝑔 = 𝜌𝐿𝐵𝑔
ρ = Density of material L = length of bar B = Breadth of bar h=height or thickness g=acceleration due to gravity
2.3 Testing of the Machine
The standard test procedure, ASTM E10-07a, specifically for Brinell Hardness test of metallic materials was followed in testing for the fabricated hardness testing machine. A ball of 10mm was used for all samples. Since different levels of material hardness result in impression of various diameter and depth, therefore, varying loads was applied to the samples for test.
Three sample materials were used for testing, namely, brass, copper, mild steel and aluminum. Eight (8) tests were carried out on each specimen between forces of 10kN to 80kN, each for duration of 30seconds. The specimen was removed from the test set-up and measurement to determine diameter of indentation was taken under magnifying lens.
The Brinell Hardness number was obtained by dividing the applied load by the surface area of the indentation (Tapany, 2007), according to the expression in equation 1.
𝐵𝐻 = 2𝐿
3.142𝐷(𝐷 − 𝐷2− 𝑑2 … 1
Where L is the load (N), D is the specimen diameter (mm) and d is the diameter of indentation (mm).
III. RESULTS AND DISCUSSION
Keeping the duration of each test constant at 30secs and varying the applied load at minimum of 10kN and maximum of 80kN. There were eight tests results for each sample. The samples were tested at standard diameter (D) of 10mm.
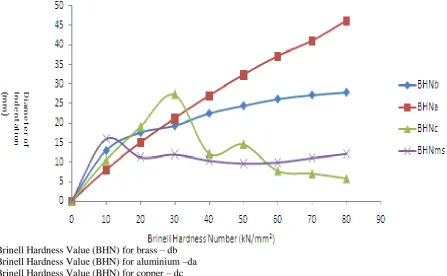
Result of each sample specimen is tabulated in Table 2-5. For mild steel, Table 2, the hardness value decreased and then increased at applied pressure of 70kN from hardness value of 9.91kN/mm2 at 60kN pressure to hardness value 11.06kN/mm2 at 70kN pressure and hardness value 12.13kN/mm2 at 80kN pressure. This may be due to non-uniformity in material distribution over an area of same material of mild steel. This observation is in accord with the work of (Hamad et al., 2011). There was incerase in the hardness value as pressure and diameter of indentation increased for brass, Table 3. This is in agreement with the work of (Tapany, 2007). Results for aluminum, Table 4, like brass, shows sharp rapid increase in hardness value as pressure and diameter of indentation increased. However, a contrary result was observed for copper with the hardness value decreasing all through the increase in pressure and diameter of indentation. This observation is in line with the inverse proportionality relationship between hardness value and diameter of indentation as shown in equation 1. Also it was graphically represented in Fig. 1 that the hardest of the samples is mild steel, brass, aluminum and copper in order of decreasing hardness. It can also be observed from Fig. 1 that the higher the pressure the higher the diameter of indentation with aluminum following a proper ductile curve.
IV. CONCLUSION
A hardness testing machine was designed, fabricated and tested. Four different materials (mild steel, brass, aluminum and copper) were tested at varying loads. The machine gave satisfactory results with mild steel confirmed the hardest followed by brass, aluminum and copper.
REFERENCES
[1] Hamah K Al Khalid, Ayman M. Alaskari and Samy E. Oraby (2011). Hardness Variation as Affected by Bar diameter of AISI 4140 Steel. World Academy of Science, Engineering and Technology. Vol. 51, Pp. 231-237
[2] Malzbender J(2003). Comment on Hardness Definition. Journal of the European Ceramic Society. Vol.23 , Pp. 1355-1359
[3] Mujad. M, Qureshi and Alli. M, (1999). Development of Microstructure during Heat Treatment of High Carbon Cromo Steel. Materials Science and Technology. Vol. 15, Pp. 391-396
[4] Samuel. J(2009). Introduction to Materials Science Course Manual. Madison Wisconsin University of Winconsin-Madison
Table 2: Result of Hardness Test for Mild Steel
S/N PRESSURE(KN) T(s) Diameter of Indentation
(d)(mm)
BHN (kN/mm2)
1 10 30 0.91 15.91
2 20 30 1.50 11.27
3 30 30 2.20 11.93
4 40 30 2.55 10.39
5 50 30 2.75 9.64
6 60 30 2.81 9.91
7 70 30 2.86 11.06
8 80 30 2.88 12.13
Table 3: Result of Hardness Test for Brass
S/N PRESSURE(KN) T(s) Diameter of Indentation
(d)(mm)
BHN
1 10 30 0.99 12.95
2 20 30 1.21 17.62
3 30 30 1.40 19.39
4 40 30 1.49 22.50
5 50 30 1.54 24.48
6 60 30 1.60 26.24
7 70 30 1.77 27.28
8 80 30 1.81 27.97
Table 4: Result of Hardness Test for Aluminum
S/N PRESSURE(KN) T(s) Diameter of Indentation
(d)(mm)
BHN
1 10 30 1.26 7.97
2 20 30 1.30 15.00
3 30 30 1.34 21.17
4 40 30 1.37 27.00
5 50 30 1.40 32.32
6 60 30 1.43 37.16
7 70 30 1.47 41.02
8 80 30 1.48 46.24
Table 5: Result of Hardness Test for Copper
S/N PRESSURE(KN) T(s) Diameter of Indentation
(d)(mm)
BHN
1 10 30 1.10 10.49
2 20 30 1.13 19.08
3 30 30 1.18 27.33
4 40 30 2.03 12.23
5 50 30 2.08 14.55
6 60 30 3.10 7.75
7 70 30 3.50 7.04
Diameter of indentation for brass – db Diameter of indentation for aluminium –da Diameter of indentation for copper – dc Diameter of indentation for mild steel – dms
Fig 1: Graph of Pressure against Diameter of indentation
Brinell Hardness Value (BHN) for brass – db Brinell Hardness Value (BHN) for aluminium –da Brinell Hardness Value (BHN) for copper – dc Brinell Hardness Value (BHN) for mild steel – dms