Parameters Affecting The Efficiency Of A Hydram
Pumping System
Dr Simbo J. Kimaro, Dr Moses H. Mkumbwa
Department of Mechanical and Industrial Engineering, College of Engineering and Technology (CoET), University of Dar es Sa-laam, P.O. Box 35131, Dar es SaSa-laam, Tanzania
Department of Mechanical and Industrial Engineering, College of Engineering and Technology (CoET), University of Dar es Sa-laam, P. O. Box 35131, Dar es SaSa-laam, Tanzania
Email: [email protected], [email protected]
ABSTRACT: In the recent studies done on the investigation of the parameters influencing the hydram’s pumping efficiency it was revealed that there were some other dimensionless parameters like (Po / Pz ) and (Vs / Vd ) which were also found to influence the hydram’s pumping efficiency apart from the previously known ones which are (h3 / H) and (q / Q). This work had also established the usefulness of the basic operational parameters of a hydram water pumping system for predicting its pumping performance than before.
Keywords:Hydram; air vessel; waterhammer; air chamber pressure; delivery flow ; efficiency
1
I
NTRODUCTIONIn a hydram water pumping system there are some energy losses which tend to reduce the useful energy component and this occur due to the pipe flow friction and also the flow accel-eration. A ratio of the useful energy to the input energy consti-tutes the efficiency of the system. For several decades, an air vessel has been used as one of the vital components believed to improve the pumping efficiency of a hydram water pumping system (Rajput 2009, Ojha et al. 2011), Krol, (1976) and Par-makian, (1963). Based on the above belief there had been no comprehensive information availed to reveal analytically the clear contribution of an air vessel in the improvement of the hydram’s pumping efficiency. In the past it was also believed that air vessel was an essential component in a hydram pump-ing system but at the recent invention, a Bamford ram (Bam-ford 2002) had disapproved that belief. However, still the as-pect of an improved efficiency in a hydram’s pumping system is of utmost importance and desirable because it has such advantages as making the system draw less driving water from a limited water supply resource and also making the re-duction in the sizes of the various hydram components includ-ing the drive pipes where the latter leads to the advantage of reducing the total cost of the system. In this study, the main objective was primarily focused on the identification of the cru-cial operational parameters in a hydram’s pumping system which could influence its pumping efficiency. The fulfillment of this objective was then tackled by conducting a detailed analy-sis of the operation of a conventional hydram pumping system by setting a model shown in Figure 1. Both theoretical and experimental analytical studies were critically conducted to explore at large, the effects of the various parameters sus-pected to influence the efficiency of the system and a sum-mary of analysis is presented in the forthcoming sections.
2
LITERATURE
REVIEW
AND
ANALYSIS
2.1 HYDRAM’S EFFICIENCY
The efficiency of a hydram’s pumping system has for many years been defined as the ratio of the output hydraulic energy to the input hydraulic energy and customarily determined by
the D’Aubuisson’s efficiency model where
QH
qh
3
(Tacke,1987). In the latter, q is the output delivery flow rate, Q is the input drive flow rate, h3 is the delivery head and H is the input
drive head. This expression which is commonly used to de-termine the hydram’s pumping efficiency has such quantities as q, and Q which are actually determined by the basic sys-tem’s operating variables like L, H, f and A1 where L is the
length of drive pipe, f is the hydram’s beat frequency and A1 is
the cross section area of the drive pipe. The above mentioned delivery head h3 is a total lifting head and this includes the total
flow losses. As can be configured, it may not be easy to esti-mate the total head losses without knowing the various ele-ments contained in the system which are causing such head losses. The later requires an exposure to a physical system. Hence before using the D’Aubuisson’s efficiency model, sev-eral issues needed to be resolved first in order to eliminate much of the guessed and erroneous data. In so doing, a con-ventional hydram pumping system model shown in Figure 1 was established where an air vessel was placed as an essen-tial part of the system’s components and this was then sub-jected to a critical analysis. In the model, the pressure Pz was
created at the air chamber of the air vessel and this measured the maximum pressure of the system which was then respon-sible for providing the maximum head for the delivery flow. This pressure was then studied by analyzing the momentum of the flow of the system in between the drive pipe and the air vessel. According to the Daugherty and Franzini (1977), such momentum was expressed by the relationship:
Fdt
d
mv
(1)The expansion of Equation (1) when based on the model
pa-rameters had resulted in the following expression :
P H h P Y
dt
m dm
v dv
mvL
H
D1 v
Flow in Pa
Z Y o q Pz Y z +ve
Fig.1: A setup model for a conventional hydram pumping sys-tem.
Where: A1 = cross section area of the drive pipe, H = drive
head, hf = frictional head losses in the drive pipe, Pz =
instan-taneous pressure at the air chamber, Yz = height of water
column in the air vessel, Pa = atmospheric pressure, m = mass
of water in the drive pipe, dm = small mass of water in the air vessel and v = velocity of flow in the drive pipe. By making further improvements on Equation (2) where the substitutions
like (H – Yz)= Z and hf =
2
v
were made, the results be-came: 2 1 v dt dz g v A A P P Z dt dv gL a z s
(3)From Equation (3), it could be noted that when the system is operating, there must be an equilibrium between the
accelera-tion head ( dt dv g L
) which occurs in a drive pipe and the net
head on the right hand side of the Equation (3) which is
de-noted as
21
v
dt
dz
g
v
A
A
P
P
Z
a z s
. Theterm
a PZ is expressing the available total drive head
of the system while the term
zP
is an air chamber pressure
head and the quantity (
dt
dz
g
v
A
A
s 1) is a head due to the water
column filling the air vessel. The component (
v
2) is the fric-tional head loss occurring in the flow path. Since the head
aP
Z
should remain constant for a particular installationset up because the drive head H is set to be constant, logically when the changes in the system equilibrium occur, they will mainly be caused by the variations of the other terms of the equation. A further re-arrangement of Equation (3) including a substitution of the flow rate q in place of the velocity v and also a replacement of the cross section area As of an air vessel with
the volume Vs of a cylindrical air vessel where As = Vs / hs when
hs is the vessel height, had resulted into the following
expres-sion: dt dz g q A h V dt dv g L A q P Z P s s a z 2 1 2 1 2
(4)
Thus from the above deduction, it could be revealed that the
pressure head (Pz/ γ) was one of the important parameters
which could be used to control or regulate both the
accelera-tion of the flow and delivery flow rates and these were the
quantities influencing the overall performance of the hydram’s
pumping system.
.
2.2 THE ALTERNATIVE STUDY OF EFFICIENCY IN A HYDRAM’S PUMPING SYSTEM BY USING THE DIMEN-SIONAL ANALYSIS METHOD
In this approach all elements suspected to influence the effi-ciency of the system including the exposed ones in Equation (4) were listed as the variables of the efficiency Ev as shown in
Equation (5).
(5)
In order to filter out the appropriate parameters influencing the
efficiency, a dimensional analysis methodology was applied
with the use of a Pie Theorem (Cengel et al. 2010). According
to this theorem, the total number of variables n involved in
Equation (5) is 9 and the number of basic dimensions m = 3
and these are M, L and T. Thus the expected number of
di-mensionless groups (πi ) = n – m = (9 – 3) = 6. In this
dimen-sional analysis, the selected repeating variables are Pz with
dimension (ML-1T-2), q with (L3T-1) and H with (L) dimensions.
Also Ev is a dimensionless parameter with the dimension
(M0L0T0). Thus π1 is expressed by the dimensions:
(M0L0T0) = (ML-1T-2)a (L3T-1)bLc.(M0L0 T0). Hence,
Analysis of dimensions:
M: a+0 = 0 and hence a = 0.
L: -a+3b+c+0 = 0 and hence 3b+c = 0.
T: -2a-b+0 = 0 whereby –b+0 = 0 and hence b = 0.
Substitution of b = 0 into (3b+c = 0) will result into c = 0.
z o s
v
P
q
h
f
L
H
P
V
E
,
,
3,
,
,
,
,
v c b a
z
q
H
E
P
1v zq H E P0 0 0 1
Solution: a = 0, b = 0 and c = 0. Thus:
And hence
Similarly,
where the dimension for h3 is (L) and,
(M0L0T0) = (ML-1T-2)a (L3T-1)bLc.(L).
Solution: a = 0, b = 0 and c = -1. Thus,
and hence, . .
Similarly,
Where the dimension for Vs is (L 3
) and
(M0L0T0) = (ML-1T-2)a (L3T-1)bLc.(L3) .
Solution: a = 0, b =0 and c = -3. Hence,
Also the πi groups could be modified by re-writing the πi asπi a
such that the index “a” could acquire a positive, negative or a
fraction number to suit the aspired application situation
(Cen-gel et al. 2010). Also the substitution of some relevant
applica-tion variables was allowed provided that their dimensions were
correctly matched. The following modifications were then
made:
1) Π3 was transformed from to :
and
whereby Qt represented the input drive flow rate and qthe
de-livery flow rate.
2)
3) Π6 was transformed from to
Where by Vd represented the pumped discharge volume per
cycle and Vs is the air vessel volume. Since π1 = ɸ (π2,
π3…π6), the efficiency Ev could thus be expressed as a
func-tion of several dimensionless parameters which are shown in
Equation (6) whereby :
(6)
3 RESEARCH METHODOLOGY
In this work, the dimensionless parameters obtained in Equa-tion (6) were subjected to the critical studies and followed by the experimental studies. In establishing the experimental data for the analysis presented in Equation (6), the guidelines set by Montgomery, (Montgomery, 2001) were applied. The next step was to design an appropriate experimental rig to study the characteristics of efficiency against the effects of the above mentioned dimensionless parameters. In this case a hydram testing rig capable of allowing the measurements of such data as Po, Pz, h3, H, L, f, Vd, Vs, q and Qt was designed and
fabri-cated as sketched in Figure 1.In the rig, the pressures were measured with the use of the pressure transducers and rec-orded by a computerized data logging system. The beat fre-quency f was acquired by taking the average time taken by a sample of operation cycles per time in seconds. The air vessel sizes Vs were made as unit specimens bearing the various
capacities like 0.12, 4.9, 9.8,14.6 and 19.6 litres. The calibra-tion of the pressure transducer was done by mounting one of the transducers onto a specially designed pressure tight piped system. This pressurized air of known pressure in bar units was filled into the calibration unit from the air compressor. The calibration results had shown that a reading of 0.0 bar corre-sponded to an electrical current of 4.0 mA. The intermediate readings were also taken. After plotting the data of the pres-sure against the generated electrical current, a correlation trend having a linear relationship was achieved. In general the calibrated data was found to agree well with the supplied manufacturer’s information and this gave us a go ahead for using the transducers in the further planned experiments. After the calibration process, the next step was to conduct trial runs of the system and making any necessary adjustments for its proper performance and measurements. Eventually a set of 9 experimental runs were then conducted on the rig and the data obtained was prepared in the form of a matrix data as listed below:
The summarized matrix data for Evf :
Parameters
1 Vs / Vd
2 Pz / Po
3 h3 / H
4 L / H
5 q / Qt
6 Y10 = Evf
v
E
13 2
P
q
H
h
c b a z
3 1 0 0
2
P
zq
H
h
H
h
3 2
s c b a z q H V
P
6
s z q H V
P0 0 3 6
.
3 6
H Vs
t
Q q
1
3
t
Q
q
3mod3 6
H Vs
d s
V V
6mod
t d s
z o v
Q q V
V H
L H h P P
E , 3 , , ,
4 RESULTS AND DISCUSSIONS
The outcome of the acquired experimental data has been pre-sented in a graphical form shown in Figures 2 to 5. In Figure 2, there was an emerging relationship between the efficiency Evf
and parameter h3/H whereby the trend presents a curve. The
value of h3/H which matches with the peak efficiency was 12.5.
Also in Figure 3 it could be seen that there was a relationship between the efficiency Evf and parameter Po/Pz which was
pre-sented by a curve. The graph attained its peak efficiency at the ratio Po /Pz = 0.4. Similarly in Figure 4, a plot of Evf versus Vs /
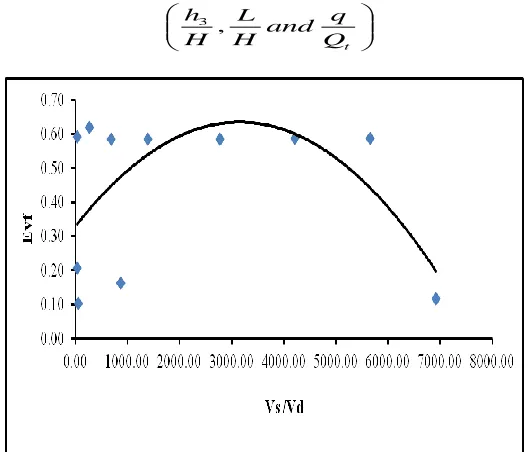
Vd had shown a relationship with a curve trend and whose
peak efficiency occurred at value of Vs / Vd = 3500. Figure 5
showed that the plotted data of Evf versus q/ Qt was also
hav-ing a curve trend whose peak efficiency occurred at the value of q/Qt = 0.045. Although the parameter L/H was mentioned
earlier to be a parameter affecting the efficiency Evf, its
behav-iour against Evf was not presented in this study because the
variable L was set to be a fixed value throughout the experi-ments done.
Figure 2: Behavior of Evf versus h3 /H when H = (1.5 – 6) m, f
= (30 – 120) beats /min, Vs = (2.45 – 19.6) litres, h3 = (20 –
120) m and L = 18.5 m
Figure 3: Behavior of Evf versus Po /Pz when H = (1.5 – 6 )m, f
= (30 – 120) beats /min, Vs = (2.45 – 19.6) litres, h3 = (20 –
120) m and L = 18.5 m
The achieved results in this study were also compared with the previous investigations done by the other researchers like Gupta et al. (1999) and Rajput (2009). These two researchers had previously found that the hydram’s efficiency was influ-enced by such dimensionless parameters as:
t Q
q and H
L H h
,
3
Figure 4: Behavior of Evf versus Vs / Vd when H = (1.5 – 6) m, f
= (30 – 120) beats /min, Vs = (2.45 – 19.6) litres, h3 = (20 –
120) m and L = 18.5 m
Figure 5: Behavior of Evf versus q/ Qt when H = (1.5 – 6) m, f
= (30 – 120) beats /min, Vs = (2.45 – 19.6) litres, h3 = (20 –
120) m and L = 18.5 m
Since the D’Aubuisson’s efficiency model was based on such parameters as h3 / H and q / Qt it implied that the parameter L
/ H was an additional one. Likewise in this recently done work five dimensionless parameters were identified to influence the hydram’s pumping efficiency whereby those above three men-tioned ones were also in the list. Hence the other two parame-ters which are (Po / Pz ) and (Vs / Vd) and which had clearly
pa-rameters it is clearly visible that some of these papa-rameters are directly related with the air vessel. For example Vs is the
vol-ume of an air vessel. Pz is the pressure at the air chamber of
an air vessel. Po is the initial pressure at the air chamber of air
vessel. Its only the volume Vd which is the volume of the
pumped water per cycle which is not related to the air vessel. It is from this perspective view we now see that the existence of an air vessel in a hydram water pumping system can con-tribute effectively in the improvement of the hydram’s pumping efficiency. In this study the smallest air vessel specimen used was having a volume of 0.12 litres. This was nearing a zero volume air vessel and was purposely placed in the list in order to seek the needed answers on the challenges now existing obout the hydrams operating without having the air vessels. From the experimental results, it was realized that this small-est air vessel had relatively presented the lower efficiencies and the major reason for its poor efficiency was due to having an insufficient air in its air chamber which was necessary for the proper performance of an air vessels. This deduction is also found to agree with the emphasize placed by Bamford, (Bamford, 2002) on his hydram which is not having an air ves-sel that, the air vesves-sel cells were still required whenever better efficiencies were required. This implied that such pumps had low efficiencies and that’s why the air vessel cells were re-quired.
5 CONCLUSION
In the study of the efficiency on the hydram’s pumping system whereby an air vessel is coupled to such system, there were several dimensionless parameters found to influence the ciency even beyond those attributed by the D’Aubuisson’s effi-ciency model. Two dimensionless parameters which were (Po /
Pz ) and (Vs / Vd) were added in the previously known list. The
study had therefore proved beyond no doubt that the air ves-sels were still required whenever improved efficiencies were required in any hydram water pumping system.
6 REFERENCES
[1] Bamford, J. (2002), Bamford ram pump, Available from: < http:// www.bamford.com.au / rampump > [Accessed September, 24, 2002].
[2] Cengel, Y. A. and Cimbala, J. M. (2010), Fluid Me-chanics Fundamentals and Applications, 2nd ed., Mc Graw Hill publisher, pp. 283-319.
[3] Daugherty, R. L. and Franzini, J. B. (1977), Fluid me-chanics with engineering applications, 7th ed., Mc Graw Hill, pp. 4 – 6 & 419 – 421.
[4] Krol, J. (1976), The automatic hydraulic ram: its theo-ry and design, ASME conference proceedings April, Paper 76 – DE , pp. 1 – 12.
[5] Montgomery, D. C. (2001), Design and Analysis of Experiments, 5th ed., John Wiley & Sons, pp. 219-286 & 302-362.
[6] Ojha, C.S.P. Berndtsson, R. and Chandramouli, P. N. (2011), Fluid Mechanics and Machines, 2nd ed., Ox-ford University press, pp. 908 - 911.
[7] Parmakian, J. (1963), Water hammer analysis, Dover
publication, New York, pp 131 –
[8] Rajput, R. K. (2009), Fluid Mechanics and Hydraulic Machines in S I Units, Chand and Co. Ltd, pp. 1299 – 1305.