ISSN (e): 2250-3021, ISSN (p): 2278-8719
Vol. 08, Issue 9 (September. 2018), ||V (I) || PP 40-49
Wavelet based Brain Tumor Segmentation using Fuzzy K-Means
Kaustav Dutta
1, Kaushik Das
2, Archisman Saha
31(ECE, Institute of Engineering and Management, India)
2(ECE, Institute of Engineering and Management, India)
2
(ECE, Institute of Engineering and Management, India)
Abstract:
Segmentation is an anterior and decisive step in image processing which extracts out and
describe the anatomical structures with regard to some input parameters. There are several algorithms
(edge detection, thresholding, region growing) to perform segmentation of an image. K-means
clustering algorithm has been extensively used in segmenting various parts of an image. However it
has got many drawbacks, which is not at all appreciable in medical grounds. In this paper, primarily
we have developed a new algorithm, Wavelet based Fuzzy-K-means algorithm, which focuses on use
of Quincunx wavelet transform for time-frequency transformation and then the combination of the
Fuzzy logic with the k-means algorithm helps in detecting various sections of a MRI image of the
brain. Finally we have used Roberts‟s edge detector to segregate the cancerous cells (tumor) from
other parts of the brain. The newly formulated algorithm has much better efficiency and precision
than the traditional ones.
--- --- Date of Submission: 26-08-2018 Date of acceptance: 07-09-2018 ---
---I.
INTRODUCTION
Image segmentation is a mechanism of dissolution of a digital image into multiple sectors. The intent of segmentation is to cut down an image into something which is more substantial and simple to analyze1. Image segmentation is customarily used to unearth the objects and boundaries in an image. More squarely, image segmentation is the way of assigning a trademark to every pixel such that pixels with same label share same characteristics. Segmentation of an image may be done using a number of sundry techniques such as thresholding technique, edge-detection technique, region based technique, neural network technique, clustering technique etc2. In this paper we have zoomed in the clustering technique. Clustering algorithms are basically classified as hard clustering, k- means clustering, fuzzy clustering and so on. The practical applications of Clustering and segmentation are:
● Locate tumors, cancer and other pathologies ● Measure tissue volumes
● Surgery planning ● Intra-surgery navigation
● Diagnosis, study of anatomical structure
●
Virtual surgery simulation etc.3,4
II.
METHOD
Segmentation of an image may be done using various techniques such as edge-detection technique, thresholding technique, region based technique, clustering technique, neural network technique. The method of segmentation which involves classification of objects into certain groups or clusters depending on some of the specific properties of the objects is known as clustering. In this technique, initially an attempt is made to extract a vector from the local areas of the image. The standard way of clustering is to assign each pixel to the nearest cluster mean. We can classify clustering algorithm into k- means clustering, hard clustering, fuzzy clustering, etc.4
dissimilarity between various pairs of data components. This algorithm is quite popular for its simple nature and ease of implementation and it is widely used to group pixels in the image.
On the other hand fuzzy clustering method is a type of clustering algorithm which depicts the relationship between the input data pattern and clusters more naturally. Fuzzy c-means is one of the most popular fuzzy-clustering methods whose effectiveness is largely limited to spherical clusters. Both these techniques have their own disadvantages as well as advantages. So we have combined the plus points of both the algorithms to create a more powerful algorithm which is known as the Wavelet based Fuzzy K-means algorithm6.
Procedure methodology
Step 1: Image loading and initialization of different variable and parameters
We have used „.dicom‟ image format for execution of our algorithm. A number of parameters are initialized in this step.
A parameter is introduced to check if an image is a 2D image or the image contains rhizome like objects. We have introduced a parameter which determines the nature of the input image and the quantity of noise
that is present in it. Proper tuning is required to get proper result. To mark a low contrast object another variable or parameter is needed. This parameter is tuned to a low value .To control noise we utilize a parameter whose value is 1 for noisy image, else it can be initialized to 0.
Another parameter is initialized to 1 if the tumor in the MRI image is darker than background; otherwise the value of the parameter is initialized to zero.
To make the algorithm run for a finite number of time, it demands a value that would highlight highest number of iterations of the proposed algorithm.
As the algorithm mainly deals with the medical images, it is necessary for it to deal with high precision value hence we have introduced a parameter or variable whose main job is to control the limit of error or to specify the maximum error value that can be accepted.
Lastly a variable is used to control the number of cases to find a perfect solution.
The initialization of these parameters is very necessary as proper tuning of them gives accurate result.
Step 2: Wavelet transform
After loading the parameters we will now perform wavelet transform. We have many algorithms to convert a signal in DWT. The oldest algorithm is the Mallat or pyramidal algorithm. This algorithm uses two filters– smoothing filter and non-smoothing filter – these are manufactured from the wavelet coefficients. These two filters are repeatedly used to get information for every scale. Here, the length of the output array is same as that of the input array .The outcomes are then generally sorted from large scale to small scale within the output array.
The most important feature of an image is the intersection between surfaces and textures which are necessary for image segmentation. An edge in an image is a well defined and finite collection of contiguous pixels which have a rapid change in intensity with respect to their neighborhood pixels in one direction and in the another perpendicular direction there is an even intensity variation. It is a local property of an image. For a nth degree polynomial, it is assumed that the wavelet transform is same as that of the wavelet transform of a constant value, provided that the Fourier Transform of the wavelet has a zero of the order (n+1) at f=0. Hence, the Wavelet transform is a powerful tool to identify the singularity of a function and edge detection. Image compression is another application of Wavelet transform. In our algorithm we have used quincunx wavelet.
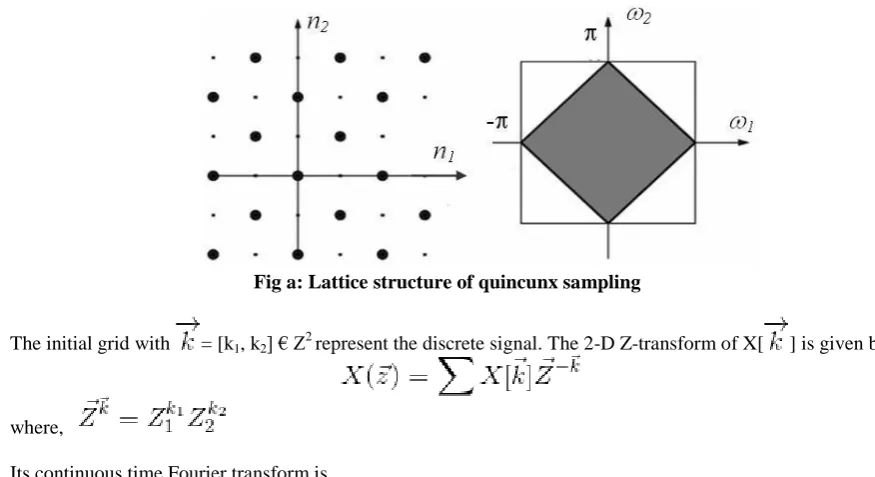
Quincunx Wavelet
The lattice structure of Quincunx sampling (Fig a) based on some basic outputs is shown below7:
Fig a: Lattice structure of quincunx sampling
The initial grid with = [k1, k2] € Z2 represent the discrete signal. The 2-D Z-transform of X[ ] is given by
where,
where =[Ѡ1, Ѡ2]. The discrete time 2-D Fourier transform of X[ ] on a NxN grid (k1, k2=0,1,2,3,4,…N) is
The Quincunx sampling version of X[ ] is
--- (a) The link between D and the identity matrix is D2=2I.
Representation of equation (a) in Fourier domain is
where =( π ,π).
The definition of up-sampling is given by:
Its Fourier domain representation is given by:
The up-sampling operator and the down-sampling operator on chaining together produce:
From this equation, the conditions for the perfect reconstruction are:
The wavelet filter, is an inflect version of the low pass filter .
Step 3: Filtering
After wavelet transform we shall now filter the resulting image. In our segmentation technique, the filter which we have used is 2D Gaussian filter. The purpose of filtering is to blur images and also to remove noise and details8. The impulse response of Gaussian filter is given as follows: -
For 2D Gaussian Filter, the frequency response is as follows: -
Step 4: Region refinement
The next step is region refinement. During this stage three basic operations are performed:
If there are any holes detected after the completion of filtering then they are filled so that the plateau regions get merged into its surrounding object regions.
The morphological disks are used for filtering so as to discard any noisy objects.
Step 5: Clustering using Fuzzy K-means algorithm
The process involved in Fuzzy K-Means is to primarily partition the data points in such a way such that a given set of vectors gets represented in an improved way. Initially we consider a set of cluster centers randomly and then we repeat the above mentioned mapping process till it satisfies a given condition. When the condition is satisfied, the iteration is stopped. No two clusters can be described by the same cluster centre. In order to avoid such a situation, a cluster center must be changed randomly to neglect this type of coincidence in the continual process9.
Let us consider that dij < η, (where η can be any positive number which is very small in magnitude) then ui,j = l and ui,l = 0 for l ≠ j. The fuzzy k-means clustering algorithm can now be represented in the following manner10:
Step 1: Input a set of random initial clusters centers say TC0= {cj(0)} and the value of ε, (acceptable error limit). Initialize p to 1.
Step 2: With the given cluster centre set TCp, evaluate dij for i=1 to N and j= 1 to k. Modify the membership ui,j with the help of the following expression:
Step 3: Evaluate the new centre for each cluster using the following equation, which gives a new set of cluster centers, TCp+1.
Step 4: If || cj(p+1) - cj(p) || < ε for all values of j then terminate the loop else set p + 1 → p and go to step 2.
Step 6: Edge Detection
The final step of our algorithm is edge detection. In our segmentation technique we have performed edge detection with the help of the Roberts operator. In this process we first convolve the input image with the help of the following two kernels:
and
Let us consider I(x,y) to be a point in the input image and another point Gx(x,y) in an image which is obtained by convolving the initial image with the 1st kernel and Gy(x,y) be another point in the image which is formed by convolving the original image with the 2nd kernel.
Then we can define the gradient as follows:
The gradient direction is given by:
The Roberts Edge filter helps in detecting the edges with the help of a horizontal and vertical filter. This two filters are applied to the input signal and the results are added up to form the output. The two filters are of the form:
HORIZONTAL FILTER VERTICAL FILTER
The Roberts Edge detector is fast in its operation as the filter is small but at the same time it is also subjected to noise which interferes with the output. If the edges of the source image are not very distinct or sharp the filter fails to detect the edge.11, 12
Step 7: Obtaining the final output
After all this process we get the final output which is much better and accurate than the tradition methods of segmentation. Some of the segmented images, which are the outputs of our algorithm, have been shown below (Fig b, c, d, e). The segmented part is bounded by the red border.
Fig b Fig c
Fig d Fig e
III. COMPARATIVE ANALYSIS
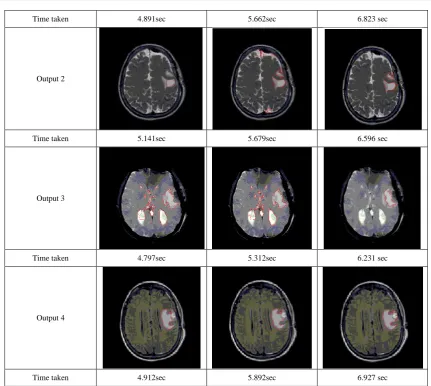
Table no 1: Comparison of Outputs of traditional segmentation algorithms with our wavelet based Fuzzy K-means Algorithm
Outputs Fuzzy C-means K-means Wavelet based Fuzzy
K-means
Time taken 4.891sec 5.662sec 6.823 sec
Output 2
Time taken 5.141sec 5.679sec 6.596 sec
Output 3
Time taken 4.797sec 5.312sec 6.231 sec
Output 4
Time taken 4.912sec 5.892sec 6.927 sec
Graphical comparison of various parameters of the three algorithms:-
Parameter 1: True Positive
This parameter is defined as follows: -
True positive = (Number of images having brain tumor and detected as positive) / (Total number images with brain tumor)
Fig. f
Parameter 2: True Negative
This parameter is defined as follows: -
True negative = (Number of images not having brain tumor and detected as negative) / (Total number images with no brain tumor)
Fig. g
In this graph (fig. g) we have plotted the various obtained values for the parameter ‘true negative’ (for the three algorithms) for increasing datasets. As we have increased the number of datasets the parameter value increases, which suggests that the algorithms works much more efficiently with a wide range of images. However from the graph it can be seen that the slope is much steeper in case of our proposed algorithm, i.e. Wavelet based Fuzzy K-means which clearly depicts that the algorithm is superior to the other two. It is more successful in differentiating an image with brain tumor from an image without it.
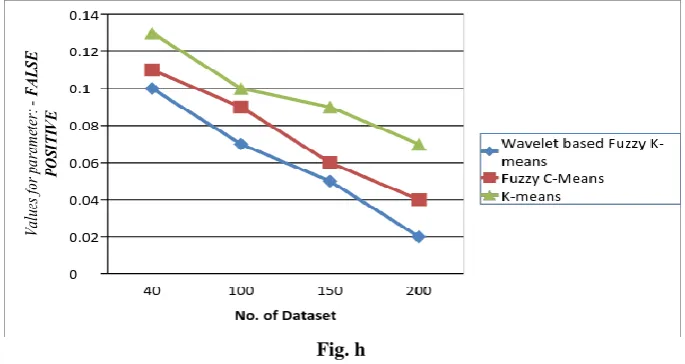
Parameter 2: False Positive
This parameter is defined as follows: -
False Positive = (Number of images not having brain tumor and detected as positive) / (Total number images with no brain tumor)
Fig. h
Parameter 2: False Negative This parameter is defined as follows: -
False negative = (Number of images having brain tumor but detected as negative) / (Total number images with brain tumor)
Fig. i
In this graph (Fig i) we have plotted the various obtained values for the parameter ‘false negative’ (for the three algorithms) for increasing datasets. As the datasets are increased the value of the parameters decrease, since categorizing a MRI image with tumor or blob like object from an image without tumor is more readily done with increased dataset. However from the graph it can be seen that the slope is much steeper in case of our proposed algorithm, i.e. Wavelet based Fuzzy K-means which clearly depicts that the algorithm is superior to the other two.
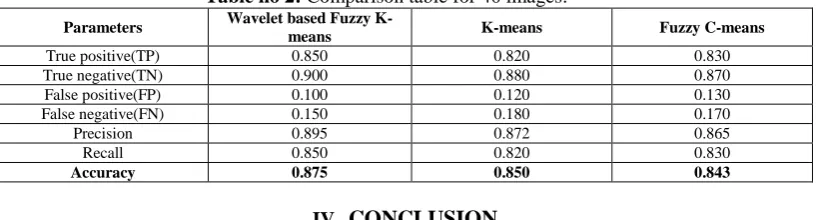
Table no 2: Comparison table for 40 images. 13, 14
Parameters Wavelet based Fuzzy
K-means K-means Fuzzy C-means
True positive(TP) 0.850 0.820 0.830
True negative(TN) 0.900 0.880 0.870
False positive(FP) 0.100 0.120 0.130
False negative(FN) 0.150 0.180 0.170
Precision 0.895 0.872 0.865
Recall 0.850 0.820 0.830
Accuracy 0.875 0.850 0.843
IV.
CONCLUSION
In this paper, we have presented a novel and efficient implementation of Wavelet based segmentation using Fuzzy- k-means clustering algorithm. The algorithm is facile to implement and only requires the number of clusters once for the given data points. Our outcomes revealed that our algorithm can improve the normal k-means algorithm. Efficiency is attained because the sample points do not vary throughout the computation and, hence, this data structure does not need to be recomputed at each stage. Our approach varies from existing algorithms only in how closest centers are computed with accuracy. We have demonstrated the practical efficiency of this algorithm both theoretically, through a data sensitive analysis, and empirically, through experiments on both synthetically generated and real data sets. The outcomes for both synthetic and real data sets stipulate that our proposed algorithm is notably more productive than the other two methods that were proposed previously. The progress of a simple and well organized algorithm which blends the best elements of the kinetic and filtering approaches would make a consequential offering.
REFERENCES
[1]. Jianbo Shi , Jitendra Malik: “Normalized Cuts and Image Segmentation” , Proc. IEEE Conf. Computer Vision and Pattern Recognition, pp. 731-737 (1997)
[2]. A. Mehta, S.Tatiraju “Image Segmentation using k-means clustering, EM and Normalized Cuts”, Department of EECS, pp. 1-7 (2008)
[4]. C. Piatko, D. M. Mount, N. Netanyahu, R. Silverman, & Y. Wu: "An efficient k-means clustering algorithm: Analysis and implementation” Proc. IEEE Conf. Computer Vision and Pattern Recognition, pp.881-892 (2002)
[5]. Malay K Pakhira: “A Modified k-means Algorithm to Avoid Empty Clusters” International Journal of Recent Trends in Engineering, Vol 1, No. 1 (2009)
[6]. K A Abdul Nazeer, M. P. Sebastian: “Improving the Accuracy and Efficiency of the k-means Clustering Algorithm” World Congress on Engineering, Vol 1(2009)
[7]. Dimitri Van De Ville, Manuela Feilner: “An Orthogonal Family of Quincunx Wavelet with Continuously Adjustable Order” IEEE TRANSACTIONS ON IMAGE PROCESSING, VOL. 14, NO. 4 (2005) [8]. Chandel, “Image Filtering Algorithms and Techniques: A Review” IJARCSSE, pp. 198-202 (2013) [9]. D. Arthur & S. Vassilvitskii: “k-mean++-The advantage of Careful Seeding” Symposium of Discrete
Algorithms (2007)
[10]. Hammad Majeed, Humayun Irshad, Samina Naz: “Image segmentation using fuzzy clustering: A survey in 2010” 6th International Conference on Emerging Technologies (ICET) (2010)
[11]. Amit Chhabra, Chinul: “Overview and Comparative Analysis of Edge Detection Techniques in Digital Image Processing”- International Journal of Information & Computation Technology., ISSN 0974-2239 Volume 4, Number 10, pp. 973-980 (2014)
[12]. Amandeep Kaur, Gurpreet Singh, Pooja Sharma: “Different Techniques Of Edge Detection In Digital Image Processing” (IJERA) ISSN: 2248-9622 Vol. 3, Issue 3, pp.458-461 (2013)
[13]. Aly A. Farag, Mohamed N. Ahmed, Nevin Mohamed, Sameh M. Yamany, Thomas Moriarty: “A modified fuzzy C-means algorithm for bias field estimation and segmentation of MRI data” IEEE Transactions on Medical Imaging (2002)
[14]. B. Vijay Kumar, M. Shasidhar, V. Sudheer Raja: “MRI Brain Image Segmentation Using Modified Fuzzy C-Means Clustering Algorithm” International Conference on Communication Systems and Network Technologies (2011)