Research Article
METHOD
DEVELOPMENT AND
STABILITY STUDY BY
CHROMATOGRAPHIC
METHOD FOR
PERAMPANEL IN API
AND TABLET DOSAGE
FORM
Dr. Chirag. J. Patel a*, Sonu S. Patel Dr. M. M. Patelc
aProfessor, Department of Pharmaceutical Anal sis, Shree Swaminarayan Sanskar Pharmacy
College, Gandhinagar, Gujarat, India. bDepartment of Pharmaceutical Analysis, Gujarat
Technological University, Ahmedabad, Gujarat, India,
c Principal, Shree Swaminarayan Sanskar Pharmacy College, Gandhinagar, Gujarat, India.
Date Received: 21st June 2017; Date accepted:
29th June 2017; Date Published: 6th
Abstract
To develop precise , accurate and reproducible st bility assay method by RP-HPLC for estimation of Perampanel in API and Tablet dosage form.The adequate separation was carried using whatman ODS partisil column (250mm*4.6mm* 5μm) using ACN:Buffer (0.5 ml Triethylamine in 500 ml water adjust pH 2.5 with OPA) (60:40v/v).Detecting w velength is 227 nm and Rt- 2.960 for API and 3.007 min for Tablet respectively.Linearity for Peramp nel was found in the range of 50 -150 μg/ml (R 0.99) respectively. The Accuracy of the present m thod was evaluated at 50 %,100% and 150%. recoveries of Perampanel API and Tablet were found to be in the range of 95.57 –
94.57 – 97.57 % respectively. Precision studies were carried out and the RSD values were less than two. The method was found to be robust.The proposed method was found to be specific, accurate, precise
DEVELOPMENT AND
STABILITY STUDY BY
CHROMATOGRAPHIC
METHOD FOR
PERAMPANEL IN API
AND TABLET DOSAGE
, Sonu S. Patelb ,
Professor, Department of Pharmaceutical Analy-sis, Shree Swaminarayan Sanskar Pharmacy
College, Gandhinagar, Gujarat, India. Department of Pharmaceutical Analysis, Gujarat
Technological University, Ahmedabad,
Principal, Shree Swaminarayan Sanskar Pharmacy College, Gandhinagar, Gujarat, India.
; Date accepted:
th July 2017
To develop precise , accurate and reproducible sta-HPLC for estimation of Perampanel in API and Tablet dosage form.The adequate separation was carried using whatman ODS partisil column (250mm*4.6mm* 5μm) using ACN:Buffer (0.5 ml Triethylamine in 500 ml water ).Detecting wa-2.960 for API and 3.007 min for Tablet respectively.Linearity for
Perampa-150 μg/ml (R2 = 0.99) respectively. The Accuracy of the present me-thod was evaluated at 50 %,100% and 150%. The % recoveries of Perampanel API and Tablet were – 98.51 % and 97.57 % respectively. Precision studies were carried out and the RSD values were less than two. The method was found to be robust.The proposed was found to be specific, accurate, precise
and robust can be used for estimation of Peramp nel in API and Tablet dosage form.
Keywords: HPLC, Perampanel, API, Tablet dosage form, OPA, TEA.
Introduction[1][2][3],[4],[5][6],[7],[16]
Introduction
Perampanel is chemically a 2-1’,6’-dihydro-[2,3’-bipyridine]-5’
with molecular weight of 349.38 g /mol.Perampanel is antiepileptic drug.
and only non-competitive AMPA
nist that targets glutamate activity at postsyna tic neuronsGlutamate is the primary excitatory neurotransmitter in the central nervous syste specifically engineered to block glutamate activity at postsynaptic AMPA receptors.
method has been reported for Perampanel They include Spectrophotometric method, HPLC .
Figure 1.Structure of Perampanel
However an extensive literature search didn’t r veal any estimation method for Perampanel in API and Tablet dosage form.Therefore an attempt has been made to develop and validate simple ,precise, accurate HPLC method for estimation of Peramp nel in API and Tablet dosage form.
Materials and Method
Drugs, chemicals and solvents: Perampanel in API was kindly given by Advanced Analytical Research and Training Institute, Gujarat. All the chemicals and solvents used were of analytical grade.
Instruments
The analysis was performed on Agilent HPLC ,fitted with a gradient pump PDA detector and whatman ODS partisil column (250mm*4.6mm* 5μm) using ACN:Buffer (0.5 ml Triethylamine 500 ml water adjust pH 2.5 with OPA) (60:40v/v) with flow rate of 1.5 ml/min. The injection volume and robust can be used for estimation of Perampa-nel in API and Tablet dosage form.
HPLC, Perampanel, API, Tablet dosage
- {6’-oxo-1’-Phenyl-5’-yl}benzonitrile with molecular weight of 349.38 g /mol.Perampanel is antiepileptic drug. The first AMPA receptor
antago-ctivity at postsynap-neuronsGlutamate is the primary excitatory neurotransmitter in the central nervous system-specifically engineered to block glutamate activity
receptors. Various analytical method has been reported for Perampanel alone. They include Spectrophotometric method, HPLC .
Figure 1.Structure of Perampanel
However an extensive literature search didn’t re-veal any estimation method for Perampanel in API and Tablet dosage form.Therefore an attempt has nd validate simple ,precise, accurate HPLC method for estimation of Perampa-nel in API and Tablet dosage form.
Drugs, chemicals and solvents: Perampanel in API was kindly given by Advanced Analytical Research arat. All the chemicals and solvents used were of analytical grade.
was 20μl. The chromatographic run time was ad-justed to 7 min. The wavelength of the detector was set at 227 nm for analysis of the drug.
Preparation of buffer
Add 0.5 ml Triethylamine in 500 ml of HPLC water adjust pH 2.5 with OPA. and degas before use.
Preparation of mobile phase
Prepare a mixture of Buffer (0.5 ml Triethylamine in 500 ml of HPLC water adjust pH 2.5 with OPA) and Acetonitrile in the ratio of 40:60. This solution was sonicated for 5 min for degassing and filtered through 0.45 μ Millipore filter.
Diluent
The drug was dissolved in acetonitrile:water (50:50)
Preparation of Standard stock solution(API)
Accurately weighed 10 mg of Perampanel was tak-en in a 10 ml standard volumetric flask and dis-solved in few ml of Diluent. Then the volume was made up to the mark with Diluent. From the above solution ,1 ml was diluted to 10 ml with to get a concentration of 100 μg/ml of Perampanel.
Preparation of Standard stock solution(Tablet)
The average of 10 Tablet was determined and grounded in mortar.An accurately weigh amount of powder equivalent to 10 mg of Perampanel was taken. It was transferred to 10 ml of volumetric flask .Add 5 ml of diluents and sonicated for 5 mi-nutes to ensure complete solubilization of drug after sonication ,volume was made up to the mark with diluent(1000 μg/ml of Perampanel stock solu-tion).Pipette out 1 ml from above solution and di-lute up to 10 ml with diluent(100 μg/ml of Peram-panel).
Calibration Curve
Aliquots of different concentrations of standard solution were prepared and their chromatograms were recorded at the optimized chromatographic conditions. The mean peak areas at different con-centration levels were calculated from the chroma-tograms. Then the linearity plot was constructed using the mean peak areas at their respective con-centrations. Figure 20
Forced Degradation Study
Forced Degradation Study of Perampanel in API and Tablet dosage form was carried out under dif-ferent stress conditions as mentioned in ICH guideline Q1A (R2).The standard solution contain-ing 100 μg/ml of Perampanel API and 100 μg/ml of Perampanel tablet were subjected to acid, alkali hydrolysis, peroxide ,thermal and photolytic de-gradation .
Acid degradation Procedure for API
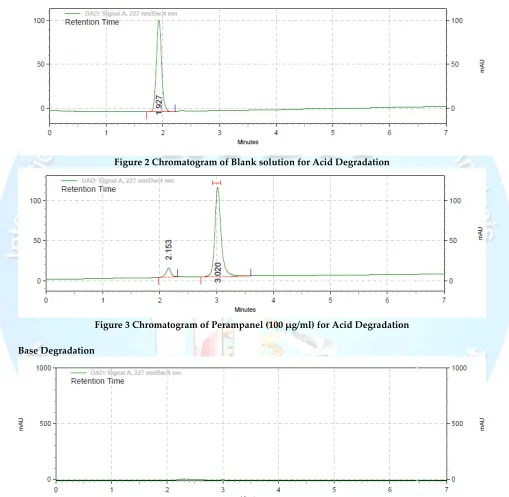
10 mg perampanel was taken and transferred to 10 ml volumetric flask separately and volume was made up with diluent (1000 μg/ml Perampanel). from the above solution 1 ml was taken into 10 ml volumetric flask and volume was made up by di-luent ( Stock solution-100μg/ml perampanel). Pi-pette out 1 ml from from the Stock solution and add 1 ml of 0.1N HCL and kept at 60º C in water bath for 2 hours. After that it was neutralized by adding 1 ml of 0.1N NaOH and make up with 10 ml of diluent. Filter the final solution with 0.45 μ PVDF Filter Similarly blank was prepared without adding sample. Blank and sample solution were injected in HPLC. Chromatograms are shown in figure: 3
Procedure for tablet
Base degradation Procedure for API
10 mg perampanel was taken and transferred to 10 ml volumetric flask separately and volume was made up with diluent (1000 μg/ml Perampanel). from the above solution 1 ml was taken into 10 ml volumetric flask and volume was made up by di-luent (Stock solution 100μg/ml perampanel). Pi-pette out 1 ml from from stock solution and add 1 ml of 0.1N NaOH and kept at 60º C in water bath for 2 hours. After that it was neutralized by adding 1 ml of 0.1N HCL and make up with 10 ml of dilu-ent. Filter the final solution with 0.45 μ PVDF Filter Similarly blank was prepared without adding sample. Blank and sample solution were injected in HPLC. Chromatograms are shown in figure: 5
Procedure for tablet
The Average Weight of 10 Tablet was determined and was ground in mortar. An Acurately weighd amount of powder equivalent to 10mg of Peram-panel. It was transferred 10 ml volumetric flask. Add 5 ml of diluent and sonicated for 5 minute to ensure complete solubilisation of drug After soni-cation volume was made up the mark with diluent (1000 μg/ml of Perampanel ). Pipette out 1.0 ml from the above solution and dilute up to 10 ml of diluent. (100 μg/ml Perampanel). Pipette out 1 ml from from stock solution and add 1 ml of 0.1N NaOH and kept at 60º C in water bath for 2 hours. After that it was neutralized by adding 1 ml of 0.1N HCL and make up with 10 ml of diluent. Fil-ter the final solution with 0.45 μ PVDF FilFil-ter Simi-larly blank was prepared without adding sample. Blank and sample solution were injected in HPLC. Chromatograms are shown in figure: 13
Peroxide Degradation Procedure for API
10 mg perampanel was taken and transferred to 10 ml volumetric flask separately and volume was made up with diluent (1000 μg/ml Perampanel). from the above solution 1 ml was taken into 10 ml volumetric flask and volume was made up by di-luent (Stock solution-100μg/ml perampanel). Pi-pette out 1 ml from from stock solution and add 1 ml of 3% H2O2 and kept at 60ºC in water bath for 2 hours. After that, make up with 10 ml of diluent. Filter the final solution with 0.45 μ PVDF Filter
Similarly blank was prepared without adding sample. Blank and sample solutions were injected in HPLC. Chromatograms are shown in Figure: 7
Procedure for Tablet
The average of 10 Tablet was determined and grounded in mortar.An accurately weigh amount of powder equivalent to 10 mg of Perampanel was taken. It was transferred to 10 ml of volumetric flask. Add 5 ml of diluents and sonicated for 5 mi-nutes to ensure complete solubilization of drug. After sonication ,volume was made up to the mark with diluent(1000 μg/ml of Perampanel stock solu-tion).Pipette out 1 ml from above solution and di-lute up to 10 ml with diluent(100 μg/ml of Peram-panel).Pipette out 1 ml from the sample solution and add 1 ml of 3 % H2O2 , keep the volumetric flask in waterbath at 60ºC for 2 hours . After time period cool the contents to ambient temperature. Dilute the volume with diluent. After inject the peroxide degradation sample into HPLC, peak area and peak shape were observed. Figure No. 16
Thermal Degradation Procedure for API
10 mg perampanel was taken and transferred to 10 ml volumetric flask separately and volume was made up with diluent (1000 μg/ml Perampanel). from the above solution 1 ml was taken into 10 ml volumetric flask and volume was made up by di-luent (Stock solution-100μg/ml perampanel). Pi-pette out 1 ml from from stock solution and add 1 ml of diluent and kept at 60ºC in water bath for 2 hours. After that make up with 10 ml of diluent. Filter the final solution with 0.45 μ PVDF Filter Similarly blank was prepared without adding sample. Blank and sample solution were injected in HPLC. Chromatograms are shown in Figure: 8
Procedure for Tablet
of volumetric flask. Keep the volumetric flask in waterbath at 60 ºC for 2 hours. After time period cool the contents to ambient temperature.Make up the volume with diluent. After inject the thermal degradation sample into HPLC ,peak area and peak shape were observed.Figure No.17
Photolytic Degradation Procedure for API
10 mg perampanel was taken and transferred to 10 ml volumetric flask separately and volume was made up with diluent (1000 μg/ml Perampanel). from the above solution 1 ml was taken into 10 ml volumetric flask and volume was made up by di-luent (Stock solution-100μg/ml perampanel). Pi-pette out 1 ml from from stock solution into 10 ml volumetric flask kept under sunlight for 2 hours. After that make up with 10 ml of diluent. Filter the final solution with 0.45 μ PVDF Filter Similarly blank was prepared without adding sample. Blank and sample solution were injected in HPLC. Chromatograms are shown in Figure: 9
Procedure for Tablet
The average of 10 Tablet was determined and grounded in mortar.An accurately weigh amount of powder equivalent to 10 mg of Perampanel was taken. It was transferred to 10 ml of volumetric flask. Add 5 ml of diluents and sonicated for 5 mi-nutes to ensure complete solubilization of drug. After sonication ,volume was made up to the mark with diluent(1000 μg/ml of Perampanel stock solu-tion).Pipette out 1 ml from above solution and di-lute up to 10 ml with diluent(100 μg/ml of Peram-panel).Pipette out 1 ml of sample solution to 10 ml of volumetric flask .It was exposed to direct sun-light for 1 hour,make up the volume with dilu-ent.After inject the photolytic degradation sample into HPLC, peak area and peak shape were ob-served . Figure No.
Method validation
System suitability was carried out by injecting standard solutions of API and Tablet 5 times into the chromatographic system. The system suitabili-ty parameters were then evaluated for tailing fac-tor, retention time and theoretical plates of stan-dard chromatograms.
Accuracy
The accuracy of the test method was demonstrated by % recovery across its range by making three different concentrations at 50%,100% and 150 % level using standard addition method .
Intraday precision(repeatability)
Intraday precision was performed by injecting standard preparations three times on the day by maintaining the optimized chromatographic condi-tions and calculate % RSD of retention time and peak areas for Perampanel.
Inter-day precision
Inter-day precision was performed by injecting standard preparations three times into chromato-graphic system on 2 different days by maintaining the optimized chromatographic conditions and calculate % RSD of retention time and peak areas for Perampanel.
Linearity
Transfer an accurately weighed quantity about 100 mg of Perampanel in 100 ml volumetric flask ,dissolve and dilute the volume with diluents. Pre-pare different linearity concentration solutions in the range of 50 – 150 μg/ml .
Robustness
The robustness was studied by analyzing the sam-ple of Perampanel by deliberate variation in me-thod parameters. The change in response of Pe-rampanel was noted . Robustness of the method was studied by changing flow rate ± 0.2 ml, mobile phase composition and column temperature. The change in the response of Perampanel was noted and compare with the original one.
Limit of Detection and Limit of Quantification
LOD and LOQ were determined by using the for-mula based on the standard deviation of the re-sponse and the slope . LOD and LOQ were calcu-lated by using equations:
LOD = 3.3 σ/ S LOQ = 10 σ/ S
Where , σ = Standard deviation of response S = Slope of calibration curve
Result and Discussion
ACN: Buffer (0.5 ml Triethylamine in 500 ml water adjust pH 2.5 with OPA) (60:40v/v) on whatman
ODS partisil column (250mm*4.6mm* 5μm)at a flow rate of 1.5 ml/min using PDA detector .
Force degradation in API Acid Degradation
Figure 2 Chromatogram of Blank solution for Acid Degradation
Figure 3 Chromatogram of Perampanel (100 µg/ml) for Acid Degradation
Base Degradation
Figure:5 Chromatogram of Perampanel (100 µg/ml) for Base Degradation
Peroxide Degradation
Figure: 6 Chromatogram of Blank solution for Peroxide Degradation
Figure: 7 Chromatogram of Perampanel (100 µg/ml) for Peroxide Degradation
Thermal Degradation
Figure: 8 Chromatogram of Perampanel (100 µg/ml) for Thermal Degradation
Photolytic Degradation
Figure: 9 Chromatogram of Perampanel (100 µg/ml) for photolytic Degradation
Force degradation (for Tablet) Acid Degradation
Figure 10 Chromatogram of Blank solution for Acid Degradation
Figure 11 Chromatogram of Perampanel (100 µg/ml) for Acid Degradation Base Degradation
Figure13 Chromatogra of Perampanel(100 µg/ml) for Base Degradation Peroxide degradation
Figure 14 Chromatogram of Blank solution for peroxide Degradation
Figure15 Chromatogram of Perampanel (100 µg/ml) for Peroxide Degradation
Thermal degradation
Photolytic degradation
Figure 17 Chromatogram of Perampanel (100 µg/ml) for Photolytic Degradation
Table 6.5 Degradation Summary for API
Type Solutions Area % Degradation
As Such Perampanel 17701755 -
Acid
0.1 N HCL at 60ºc for 2 hrs
Perampanel 1811629 10.23%
Base
0.1 N NaOH at 60ºc for 2 hrs
Perampanel 1751791 9.89%
Peroxide 3% H2O2 at 60ºc for 2 hrs
Perampanel 1780296 10.05%
Thermal At 60°C for 2hrs
Perampanel 1795105 10.14%
Photolytic In sun light for 2 hr
Perampanel 2283080 12.89%
Table 6.6 Degradation Summary for Tablet
Type Solutions Area % Degradation
As Such Perampanel 8261178 -
Acid
0.1 N HCL at 60°C for 2 hrs
Perampanel 752540 9.10%
Base
0.1 N NaOH at 60°C for 2 hrs
Perampanel 961297 11.63%
Peroxide 3% H2O2 at 60ºc for 3 hrs
Perampanel 821987 9.95%
Thermal At 60°C for 2hrs
Perampanel 909555 11.01%
Photolytic In sun light for 2 hr
Validation Data
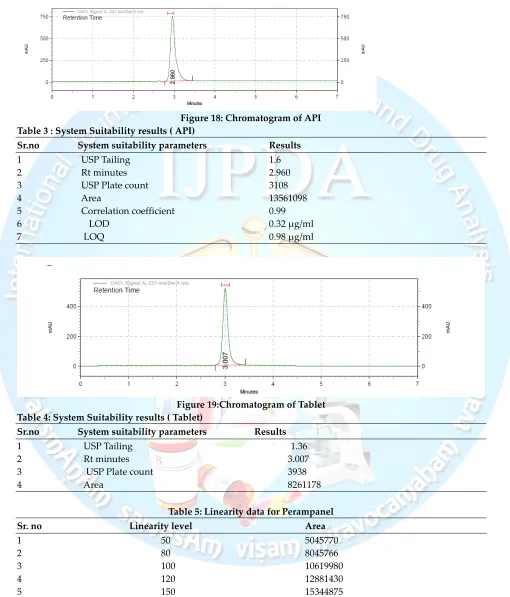
Figure 18: Chromatogram of API Table 3 : System Suitability results ( API)
Sr.no System suitability parameters Results
1 USP Tailing 1.6
2 Rt minutes 2.960
3 USP Plate count 3108
4 Area 13561098
5 Correlation coefficient 0.99 6 LOD 0.32 μg/ml 7 LOQ 0.98 μg/ml
Figure 19:Chromatogram of Tablet Table 4: System Suitability results ( Tablet)
Sr.no System suitability parameters Results
1 USP Tailing 1.36
2 Rt minutes 3.007
3 USP Plate count 3938
4 Area 8261178
Table 5: Linearity data for Perampanel Sr. no Linearity level Area
1 50 5045770
2 80 8045766
3 100 10619980
4 120 12881430
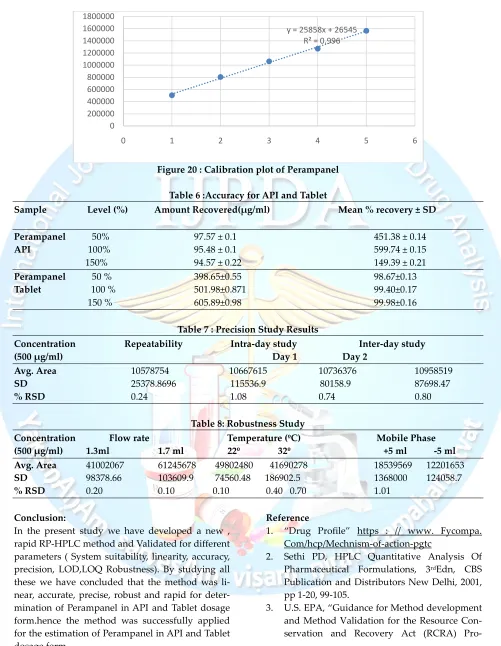
Figure 20 : Calibration plot of Perampanel
Table 6 :Accuracy for API and Tablet
Sample Level (%) Amount Recovered(µg/ml) Mean % recovery ± SD
Perampanel 50% 97.57 ± 0.1 451.38 ± 0.14
API 100% 95.48 ± 0.1 599.74 ± 0.15 150% 94.57 ± 0.22 149.39 ± 0.21
Perampanel 50 % 398.65±0.55 98.67±0.13
Tablet 100 % 501.98±0.871 99.40±0.17
150 % 605.89±0.98 99.98±0.16
Table 7 : Precision Study Results
Concentration Repeatability Intra-day study Inter-day study
(500 µg/ml) Day 1 Day 2
Avg. Area 10578754 10667615 10736376 10958519
SD 25378.8696 115536.9 80158.9 87698.47
% RSD 0.24 1.08 0.74 0.80
Table 8: Robustness Study
Concentration Flow rate Temperature (ºC) Mobile Phase
(500 µg/ml) 1.3ml 1.7 ml 22º 32º +5 ml -5 ml
Avg. Area 41002067 61245678 49802480 41690278 18539569 12201653
SD 98378.66 103609.9 74560.48 186902.5 1368000 124058.7
% RSD 0.20 0.10 0.10 0.40 0.70 1.01
Conclusion:
In the present study we have developed a new , rapid RP-HPLC method and Validated for different parameters ( System suitability, linearity, accuracy, precision, LOD,LOQ Robustness). By studying all these we have concluded that the method was li-near, accurate, precise, robust and rapid for deter-mination of Perampanel in API and Tablet dosage form.hence the method was successfully applied for the estimation of Perampanel in API and Tablet dosage form.
Reference
1. “Drug Profile” https : // www. Fycompa. Com/hcp/Mechnism-of-action-pgtc
2. Sethi PD, HPLC Quantitative Analysis Of Pharmaceutical Formulations, 3rdEdn, CBS Publication and Distributors New Delhi, 2001, pp 1-20, 99-105.
3. U.S. EPA, “Guidance for Method development and Method Validation for the Resource Con-servation and Recovery Act (RCRA)
Pro-y = 25858x + 26545 R² = 0.996
0 200000 400000 600000 800000 1000000 1200000 1400000 1600000 1800000
gram”, 1995, www.epa.gov/sw-846/pdfs/methdev.pdf
4. Hamilton RJ, Sevell PA, Introduction to HPLC, 2ndEdn, Chapman and Hall London Publica-tion, 1982, pp 189.
5. Beckett A.H, and Stenlake J. B, Practical Phar-maceutical Chemistry, 1stEdn, CBS Publishers and Distributors New Delhi, 2004, pp 275-325. 6. Dr. S. Ravi Shankar, Textbook of
Pharmaceuti-cal Analysis, 3rdEdn, RX Publication, 2014, pp 13.1, 13.3, 18.2 and 18.5.
7. Vogel’s, Textbook of Quantitative Chemical Analysis, 5th Edn, Pearson Education Limited Publication, 1996, pp 645-651, 752-755.
8. Sharma S, Sher P, Badve S, Atmaram P.P, Re-cent Advances in Spectroscopic techniques, 6th Edn, AAPS Pharm Science Technology Publi-cation, 2005, pp 618-625.
9. ICH Harmonized tripartitle guideline, Valida-tion of Analytical Procedures: Text and Me-thodology, Q2 (R1), 2005, pp 8-17.
10. Ahuja s, and Dong MW, Handbook of Phar-maceutical Analysis by HPLC, 1stEdn, Elsevier Academic Press, United Kingdom, 2005, pp 62-68.
11. Singh SS and Bakshi M, “Development of vali-dated stability indicating assay methods: criti-cal review”, Journal of Pharmaceuticriti-cal and biomedical analysis, April 2002,pp11–40. 12. SchirmerRE, Modern
MethodsofPharmaceuti-cal Analysis, CRCPressInc, 1982,pp61-138. 13. Cartenson JT, and Swarbirck J, Solution
kinet-ics- Drug stability principles and practice, 2nd Edn, Marcel Dekker series, 1995, pp 17-90. 14. Stability Testing of New Drugs and Product:
ICH Q1 A (R2). 2003, pp 1-20.
15. Charde MS, Kumar J, Welankiwar AS and Chakole RD, “Review: development of forced degradation studies of drugs”, International Journal of Advances in Pharmaceu-tics,December 2013, pp34-38.
16. Hotha KK, Reddi SK, Raju VK andRavindra-nath LK, “Forced degradation studies: practic-al approach- overview of regulatory guidance and literature for the drug substances and drug products”,International Research Journal of Pharmacy, July2013, pp78-83.
17. Ngwa G, “Forced degradation study as an integral part of HPLC stability-indicating
18. Validation of Analytical Procedure: Text and Methodology ICH, Q2 (R1).2005, pp 1-13. 19. “Drug profile” September 2016,www.
Drug-bank.Ca/drugs/DB08883
20. Yuji Mano, Osamu Takenaka and Kazutomi-Kusano, “High-perfomance liquid chromato-graphy-tandem mass spectrometry method for the determination of perampanela novel α-
amino-3-hydrxy-5-methyl-4-isoxazolepropionic acid receptor antagonist in human plasma”. J.of.Pharmaceutical.and Biomed-ical Analysi. 2015, 107,56-62
21. Yuji Mano, Osamu Takenaka and Kazutomi-Kusano, “HPLC with fluorescence detection assay of perampanel,a novel AMPA receptor antagonist, in human plasma for clinical
pharmacokinetic studies”.
J.of.Biomedchromatogr. 2015,29, 1589-1593 22. Yuji Mano, “An inter- laboratory
cross-validation study for the determination of pe-rampanel in human plasma by liquid chroma-tography assays”. J. Of Biomed chromatogr.