THE SCALE UP AND MODELLING OF
HIGH PERFORMANCE LIQUID CHROMATOGRAPHY.
A thesis submitted to the University of London for the degree of
DOCTOR OF PHILOSOPHY
by
Angela Scholtzova
The Advanced Centre for Biochemical Engineering 2000
Department of Biochemical Engineering University College London
Torrington Place London
All rights reserved
INFORMATION TO ALL U SE R S
The quality of this reproduction is d ep en d en t upon the quality of the copy subm itted. In the unlikely even t that the author did not sen d a com plete manuscript
and there are m issing p a g e s, th e se will be noted. Also, if material had to be rem oved, a note will indicate the deletion.
uest.
ProQ uest U 643787
Published by ProQ uest LLC(2016). Copyright of the Dissertation is held by the Author. All rights reserved.
This work is protected against unauthorized copying under Title 17, United S ta tes C ode. Microform Edition © ProQ uest LLC.
ProQ uest LLC
789 East E isenhow er Parkway P.O. Box 1346
ACKNOWLEDGEMENTS.
I would like to express my gratitude to my supervisor Prof. Mike Turner and to my advisor Dr. Nigel Titchener-Hooker for their guidance, support and endless encouragement.
My thanks also go to Dr. Andrew Gill for helping with the crushing and sieving of the particles and his help with logistics. His assistance with the technical aspects of commissioning the Prochrom system was invaluable.
Many thanks to Dr. George Habib for writing a program in Lab View to control the solenoid valves on the Prochrom system.
My thanks also to Dr. Youhong Zhou for helping me with fractionation diagrams.
The Prochrom large scale chromatographic system would never have been commissioned had it not been for all the help and expertise o f the Department’s technical staff, particularly in the mechanical and electrical workshops: I am especially indebted to Clive Orsbom, Billy Doyle, Martin Town, Alan Craig and Martin Vale.
This thesis concerns the scale up and modelling o f High Performance Liquid Chromatography. It aims to fulfil the need for a good empirical model which describes and predicts chromatographic performance but without recourse to a mathematical procedure which requires many assumptions and is mainly theoretical.
The project therefore attempted to predict large-scale separations from small-scale analyses on the basis of fractionation diagrams. The results show that the target was met in part i.e. the model was developed but could not be verified on a large scale. The reason was the unexpectedly good separation on a large scale which equalled that achieved on the analytical scale.
The project also aimed to show the sensitivity of the large scale separation to process variables, and to devise a practical protocol for running large scale chromatographic separations. The thesis contains reports o f experimental optimisation of chromatography conditions which will be of interest to other chromatographic researchers. The large scale column can be packed and operated satisfactorily provided certain rules are observed. The detailed points are summarised in the conclusion to the thesis (Chapter 5).
Its claims to originality and novelty are :
• the use o f fractionation diagrams as a modelling tool for chromatographic processes.
• a detailed examination of 35 micron particles o f polymeric origin in a large scale HPLC column (silica is widely used and majority o f experiments are carried out on analytical scale)
• a novel method for the determination of column band broadening and extra-column band broadening
The thesis is laid out as follows :
1. The introduction section contains an overview o f the history and development of HPLC, a literature survey of erythromycin analytical separation techniques, all the chromatographic theory relevant to this project including band broadening, column supports, etc., and a brief review of models used in mathematical modelling.
2. The results section describes the analytical separation of aromatic compounds where familiarisation with the HPLC system and the theory is outlined; this is followed by the analytical separation of erythromycin where the method for the separation of erythromycin is described and several aspects o f the separation are investigated. The semi-preparative stage mainly describes the treatment o f the packing material and the packing of the columns for the scale up studies. The natural progression to a large scale Prochrom column (180 x 60 mm) is then shown together with an explanation o f the system, its operation and its results, with particular regard to efficiency and band broadening. Finally, the principles o f modelling using fractionation diagrams are explained and the theory supported by results.
3. Discussion o f the results obtained:
a) Comparisons of the performance of large and small scale chromatography columns.
b) The role o f extra-column band broadening in large scale chromatography with regard to velocities and Reynolds number.
TABLE OF CONTENTS
1. AIMS AND OBJECTIVES...10
2. INTRODUCTION...11
2.1 Th eh is t o r ya n dd e v e l o p m e n to f H P L C ...11
2.1.1 The early development o f chromatography...11
2.1.1.1 Tswett and his revolutionary paper...11
2.1.1.2 Tswett's two additional papers... 12
2.1.2 Development o f chromatography in the 1930s...13
2.1.2.1 Manhattan project and API project...13
2.1.2.2 Preparative nature of early chromatography... 13
2.1.3 Other separation techniques...14
2.1.3.1 Gas chromatography versus liquid chromatography... 15
2.1.4 Classical chromatography...16
2.1.4.1 Classical LC versus HPLC...17
2.1.5 HPLC - High Performance Liquid Chromatography...18
2.1.5.1 Historical development o f HPLC...18
2.1.5.2 Main features of HPLC... 19
2.2 Ch r o m a t o g r a p h ict h e o r y...21
2.2.1 Chromatography characteristics...21
2.2.1.1 Capacity factor (k’) ... 21
2.2.1.2 Selectivity factor ( a ) ... 22
2.2.1.3 Resolution (Rg)...22
2.2.1.4 Symmetry (S)...23
2.2.2 Efficiency...23
2.2.2.1 Number of theoretical plates (N )... 23
2.2.2.2 Height equivalent to a theoretical plate (H )...23
2.2.2.3 Derivation of the number o f theoretical plates... 24
2.2.3 Porosity....25
2.2.3.1 Total Porosity (et)... 25
2.2.3.2 Internal and external porosity...25
2.2.4 Darcy ^s law and Carman-Kozeny equation...26
2.2.4.1 Ohm’s law... 26
2.2.4.2 Darcy’s law ... 26
2.2.4.3 Carman-Kozeny la w ...27
2.2.5 H/u cu rve...28
2.2.5.1 Van Deemter equation... 29
2.2.5.2 Knox equation...29
2.2.5.3 Reduced velocity and reduced plate height... 31
2.2.5.4 The optimum flow rate... 32
2.2.6 Reynolds number...32
2.2.6.1 Reynolds number for straight tubes...32
2.2.6.2 Reynolds number for packed columns... 33
2.2.7 Statistics...34
2.2.7.1 The arithmetic m ean ...34
2.2.7.2 The standard deviation... 34
2.2.7.3 The standard error... 35
2.2.7.4 Confidence limits... 35
2.2.7.5 Degrees of freedom... 35
2.3 Co l u m nb a n db r o a d e n in ga n de x t r a-c o l u m nb a n db r o a d e n in g...36
2.3.1 The separation process...36
2.3.1.1 Differential m igration...36
2.3.1.2 Dispersion... 36
2.4 Wa l le f f e c ta n din fin it ed ia m e t e rc o l u m n s... 40
2.5 La m in a ra n d t u r b u l e n tf l o w... 42
2.5.1 Inertial and viscous forces...42
Scale up and Modelling o f High Performance Liquid Chromatography
2.5.1.1 Reynolds num ber...42
2.5.2 Lam inar f l o w...43
2.5.3 Turbulent f l o w... 43
2.5.3.1 The equalisation effect...43
2.6 Sil ic aa n dp o l y m e r s...45
2.6.1 Silica...45
2.6.1.1 Physically bonded stationary phases... 45
2.6.1.2 Chemically bonded stationary phases...45
2.6.2 Polym eric stationary p h a se s...47
2.6.2.1 Natural and synthetic polym ers...48
2.6.2.2 Microporous and macroporous particles... 48
2.6.2.3 The preparation of polymeric packing material...49
2.6.3 N orm al and reversed p h a se...50
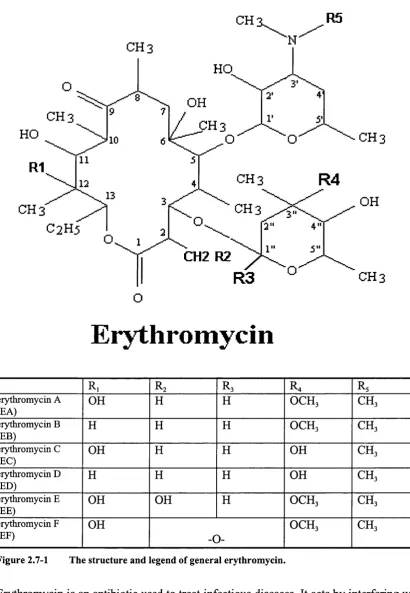
2.7 Er y t h r o m y c in...51
2.7.1 Erythromycin characteristics...52
2.7.2 Industrial production and iso la tio n...53
2.7.3 A nalytical separation o f erythrom ycin...54
2.7.3.1 Analytical separation o f erythromycin on silica... 55
2.7.3.2 Analytical separation of erythromycin on PSDVB...57
2.8 Ax ia la n dr a d ia lc o m p r e s s io n... 60
2.8.1 Types o f compression...60
2.8.1.1 Static compression... 60
2.8.1.2 Dynamic compression... 60
2.8.2 Packing pressure...61
2.8.3 Packing techniques - dry, wet an d slurry...62
2.9 Ma s sa n dv o l u m eo v e r l o a d...63
2.9.1 L oadability...63
2.9.1.1 Maximum amount of the sample loaded on silica... 65
2.9.2 M ass and volume overload...65
2.9.2.1 Volume overload profile... 66
2.9.2.2 Mass overload profile...66
2.9.2.3 Combination o f mass and volume overload... 67
2.10 Mo d e l l in g...69
2.10.1 Equilibrium m odel...69
2.10.2 The equilibrium-dispersive m odel (equilibrium theory p lu s )...71
2.10.3 Kinetic m odels...71
2.10.4 Plate m odels...71
2.10.4.1 Martin and Synge model... 71
2.10.4.2 Craig distribution model...72
3. RESULTS... 73
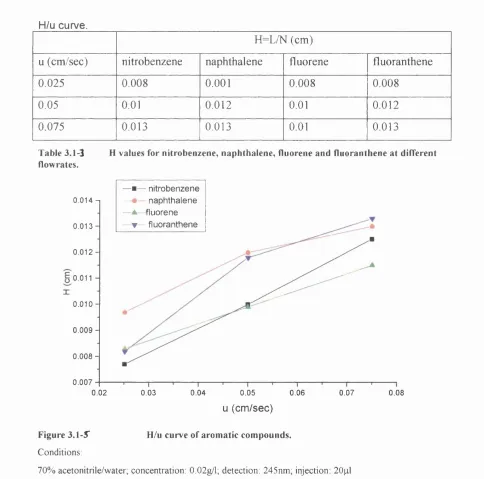
3.1 An a l y t ic a ls e pa r a t io no fa r o m a t icc o m p o u n d s : n it r o b e n z e n e, n a p h t h a l e n e, FLUORENE AND FLUORANTHENE... 73
3.1.1 High perform ance liquid chromatography - reversed p h a s e ....73
3.1.1.1 Principles of separation... 73
3.1.1.2 Factors affecting separation performance... 74
3.1.1.3 Stationary phase...74
3.1.1.4 Mobile phase in reverse phase L C ...75
3.1.2 M aterials and M ethods...77
3.1.3 A im s and objectives....79
3.1.4 Data collection and resu lts...79
3.1.4.1 Manual calculations...81
3.1.4.2 Electronic calculations...83
3.1.4.3 Troubleshooting... 91
3.2 An a l y t ic a ls e p a r a t io no fe r y t h r o m y c in... 95
3.2.1 E rythrom ycin...95
3.2.1.1 Brief description... 95
3.2.1.2 Structure of erythromycin... 96
3.2.2 M aterials and m eth o d s...96
3.2.2.1 Erythromycin and its impurities... 96
3.2.2.2 Mobile phase...97
3.2.2.3 Column specifications and packing m aterial...98
3.2.2.4 Packing m aterial... 98
3.2.2.5 Cleaning the column... 100
3.2.3 Method development... 101
3.2.3.1 Original method for the separation of erythromycin...101
3.2.3.2 Modification of the m ethod... 103
3.2.4 Results - Changes in the mobile phase composition...104
3.2.4.1 Buffer concentration... 104
3.2.4.2 Buffer pH...108
3.2.4.3 Sodium and ammonium phosphate buffer... 110
3.2.4.4 Column tem perature... 112
3.2.4.5 Sample concentration... 115
3.2.4.6 Flowrate study...115
3.2.4.7 Acetonitrile concentration... 117
3.2.5 Conclusion...118
3.3 Se p a r a t io no fe r y t h r o m y c ino na s e m i-p r e p a r a t iv ec o l u m n...120
3.3.1 Irregular versus spherical shape particles...121
3.3.1.1 Amberlite XAD-4... 121
3.3.1.2 Amberchrom CG-161... 124
3.3.2 Styrene versus methacrylate support...126
3.3.2.1 CG-161 and CG-71... 126
3.3.2.2 R esults-C G -71... 127
3.3.3 CG-300packing...134
3.3.3.1 Materials and methods... 134
3.3.3.2 R esults... 139
3.3.4 The CG-300 columns: comparisons o f their performance...144
3.3.4.1 Materials and methods... 144
3.3.4.2 Results... 145
3.3.4.3 Conclusion... 150
3.4 La r g es c a l ec h r o m a t o g r a p h y u s in ga P R O C H R O M c o l u m n...153
3.4.1 Introduction...153
3.4.2 Description...153
3.4.2.1 Risk Assesment (COSHH) and Prochrom... 155
3.4.2.2 Solvent module...157
3.4.2.3 UV Detector...157
3.4.2.4 C olum n... 158
3.4.3 Column operation...158
3.4.4 Column packing...159
3.4.4.1 Column packing - points to remember:... 160
3.4.4.2 Packing pressure...160
3.4.5 Column unpacking...161
3.4.6 Results...162
3.4.6.1 Prochrom separation... 162
3.4.6.2 Particle size distribution... 162
3.4.6.3 Pressure flowrate relationship... 166
3.4.6.4 Volume overload on a large scale colum n... 167
3.4.6.5 Column ruggedness and reproducibility...167
3.4.7 Troubleshooting the PROCHROM column...171
3.4.7.1 The history of the Prochrom column used...171
3.4.7.2 Factors to observe...173
3.4.7.3 Symptoms...174
3.4.7.4 The lessons learned...183
3.5 Co l u m ne f f ic ie n c y v s. Fl o w r a t e... 184
3.5.1 Introduction...184
3.5.2 Materials and m ethods....184
3.5.2.1 Sample concentration... 184
3.5.2.2 Column efficiency calculations... 185
3.5.3 Results...185
3.5.3.1 Acetone and uracil...185
3.5.3.2 Erythromycin... 186
3.5.4 Packed columns and laminar flo w...186
Scale up and Modelling o f High Performance Liquid Chromatography
3.5.5 The solutes and the number o f theoretical p la tes...187
3.5.5.1 Acetone and uracil... 187
3.5.5.2 Erythromycin... 187
3.5.6 Column efficiency and mobile phase velocity...188
3.5.7 Column efficiency and sample volume injected...188
3.5.7.1 Acetone and uracil... 188
3.5.7.2 Erythromycin... 189
3.5.8 Reynolds number in tubes with granular material...189
3.5.9 Conclusion...189
3.6 H / v CURVES...191
3.6.1 Methods...191
3.6.1.1 Porosity... 191
3.6.2 Results...192
3.6.2.1 Acetone...192
3.6.2.2 U racil... 193
3.6.2.3 Erythromycin... 193
3.6.2.4 h / v curve of acetone, uracil and erythromycin together... 195
3.6.3 Column efficiency and h /v curve...195
3.6.4 Conclusion...196
3.6.5 Discussion...197
3.7 Ex t r a-c o l u m nb a n d b r o a d e n in g (E C B B )...198
3.7.1 Approach 1...198
3.7.1.1 Materials and m ethods...198
3.7.1.2 Extra-column band broadening... 200
3.7.2 Results...201
3.7.2.2 Main findings...203
3.7.2.3 Band broadening in analytical and large scale chromatography...204
3.7.3 Approach 2...207
3.7.3.1 Calculations of band broadening...207
3.7.4 Results....209
3.7.5 Conclusions from both approaches...211
3.8 Fr a c t io n a t io nd ia g r a m sa sac h r o m a t o g r a p h icm o d e l l in gt o o l...213
3.8.1 Introduction...213
3.8.2 Materials and m ethods...213
3.8.3 Construction o f fractionation diagrams...214
3.8.4 Results...219
3.8.4.1 Change o f acetonitrile concentration in the mobile p h ase ...219
3.8.4.2 Change in the buffer type used in mobile phase...221
3.8.4.3 Effect o f temperature on purification factor/yield...222
3.8.5 Large scale separation...222
3.8.6 Conclusion...222
4. DISCUSSION...224
4.1 Ma t h e m a t ic a lm o d e l l in g, P C A a n df r a c t io n a t io nd ia g r a m s...224
4.2 Newd ir e c t io n...226
4.3 Pr o c h r o mc o l u m np a c k in g...228
4.4 Ke yf a c t o r s: h/vc u r v e s, w a l le f f e c ta n de x t r a-c o l u m nb a n db r o a d e n in g...234
5. CONCLUSIONS... 245
6. FUTURE WORK AND MAIN RECOMMENDATIONS... 249
7. REFERENCES... 250
8. APPENDICES... 257
8.1 Ap p e n d ix 1 - No m e n c l a t u r e... 257
8.2 Ap p e n d ix 2 - Ar o m a t icc o m p o u n d s...260
8.2.1 Loop size and the number o f theoretical p la tes....260
8.2.2 Wavelength and “/V” ...261
8.2.3 Mobile phase change and ‘W”...262
8.2.3.1 Methanol / water and 90% Acetonitrile / w ater... 262
8.2.4 Influence o f sample concentration on the number o f theoretical p la te s...264
8.2.5 Evaluation o f capacity factor, selectivity factor and resolution...265
8.2.5.1 Sample concentration...265
8.2.5.2 Wavelength...266
8.2.5.3 Mobile phase... 266
8.2.5.4 Loop size... 266
8.3 Ap p e n d ix 3 - An a l y t ic a ls e pa r a t io no fe r y t h r o m y c ino n P LR P c o l u m n... 269
8.3.1 Temperature...269
8.3.2 Flowrate...269
8.3.3 Acetonitrile concentration...270
8.3.4 Buffer concentration...270
8.3.5 Buffer p H...271
8.4 Ap pe n d ix 4 ... 274
8.4.1 Semipreparative separation o f erythromycin on CG-300...274
8.5 Ap p e n d ix 5 - Pr o c h r o m... 276
8.5.1 Reproducibility studies....276
8.6 App e n d ix 6 - h/vc u r v e s... 278
8.6.1 ACETONE...278
8.6.2 URACIL...279
8.6.3 ERYTHROMYCIN...280
8.6.3.1 with normal retention tim e... 280
8.6.3.2 with a reduced retention time...281
8.6.4 Molar volume o f acetone...281
8.6.5 Molar volume o f uracil...282
8.6.6 Molar volume o f erythromycin...282
8.6.7 Reynolds numbers calculated fo r different temperatures...282
Scale up and Modelling o f High Performance Liquid Chromatography
1. Aims and Objectives
Aim 1.
To commission and operate a large scale Prochrom
chromatography system in order to purify erythromycin. To troubleshoot
analytical and large scale chromatography systems.
Aim 2.
To determine the effect o f mobile phase variations on the
separation o f erythromycin. This is because the large scale system requires
the preparation o f substantial amounts o f mobile phase and operation of
the system is susceptible to operator error.
Aim 3.
To determine how overload conditions and scale would affect
the separation.
Aim 4.
To establish the extent o f extra-column band broadening on a
large scale column.
Aim 5.
To determine the role o f h/v curves with different compounds
on the Prochrom system and the factors influencing the minimum value of
reduced plate height.
2. Introduction
2.1 The history and development of HPLC
S u m m a ry
This chapter deals with the development of chromatography from its early stages at the beginning o f the 20* century, progressing through some o f its milestones, up to the first signs of the emergence of the state of the art HPLC technique in the late 1960s.
As Tswett is regarded as the father of chromatography, a substantial section is devoted to his revolutionary first paper which laid the foundations for a whole range of separation techniques.
2.1.1 The early development of chromatography
Although the first signs of chromatography began to appear in the 19* century it was not until 1903 when the Russian botanist M. S. Tswett published a paper (1903) on the separation of xanthophylls and chlorophyll on an inulin (polysaccharide originally obtained from the tubers of the dahlia) column that chromatography was officially recognised as a new separation technique. The author tested 110 different column packing materials and emphasised the importance of adsorption in achieving good separation.
2 .1 .1 .1 T s w e tt a n d h is revolu tion ary p a p e r
Tswett in his paper (1903) tried to explain the phenomenon called adsorption which at that time was not very well known and understood. He conducted experiments on the insolubility of chlorophyll in petrol and ligroin (a petroleum fraction comprised largely of heptane and hexane with a boiling point in the range o f 90 to 120°C). Green leaves contain chlorophyll which comprises five pigments. When these leaves are soaked in ligroin, only carotene pigment can be extracted from them. However, the addition of only a small amount o f another solvent (e.g. alcohol) enables the extraction of all the remaining pigments. He ascribed this phenomenon to adsorption. In this case the adsorption tissues were green leaves. He correctly predicted from this outcome that
Scale up and Modelling o f High Performance Liquid Chromatography
other substances could be used as adsorbents. He then went on to test more than a hundred different substances for use as adsorbents. Amongst them were elements such as sulphur, magnesium, zinc, iron, and lead; oxides and hydroxides; acids; phosphates; nitrates; aldehydes; amides; alkaloids and others. Bone charcoal appeared to be the best adsorbent as it adsorbed the pigments completely. This was due to “the outstanding porosity of this substance” (Quincke 1859). Solvents which he used included: alcohol, acetone, ether, chloroform, and ligroin.
The author described the process of adsorption as a physical one. He correctly pinpointed the need for a carefully chosen solvent whose properties were known. It had to be of a definite chemical composition, easily obtainable in a pure state, and of easily determinable solubility. This paper, which was published in 1903 in Russian and only translated later (1906) into German, laid the basis for chromatography. Tswett showed here great scientific thinking: a person who was capable o f analysing and interpreting data with great precision and able to draw very sensible conclusions from them, bearing in mind that he was a botanist rather than a chemist.
2 .1 .1 .2 T s w e t f s tw o additional p a p e r s
In his second publication Tswett (1906*) described some o f the aspects of chromatography which remain critical today in achieving a satisfactory separation. Some of them are: the importance of regular packing (fine particles giving better separations than coarse particles); purity of packing material; the importance of the top of the column not being disturbed when applying the sample or the solvent; and the possibility of chemical change on the columns because of adsorption phenomena.
The third paper (1906**) was devoted to the utilization of columns with a larger diameter (2-3 cm) - preparatory columns.
Tswett was undoubtedly far ahead of his time. Unfortunately his work was not appreciated for several reasons: firstly his results were difficult to reproduce as they required considerable technical expertise; Willstatter and Stoll (1913) expressed doubts about the feasibility o f this separation. Williams (1947) claimed that this new technique was not needed at that time although Mikes (1966) stated that the method could indeed be useful.
These factors, together with Tswett's final thesis being written in Russian and therefore hard to access, postponed further development in this area o f analytical research.
2.1.2 Development of chromatography in the 1930s
Some twenty years after Tswetfs breakthrough, during which time chromatography had lain dormant, Kuhn (1931*) and Lederer (1931*) together with Winterstein (1931) used preparative chromatography to separate alpha and beta carotene and also egg-yolk pigments.
2 .1 .2 .1 M an h attan project a n d API project
The use of chromatography really took off in the 1940s when two main projects were undertaken: the Manhattan project and the API (American Petroleum Institute) project.
The Manhattan project (Spedding et al. 1947) dealt with the purification o f rare earth elements by ion-exchange chromatography.
The API project developed in the late 1940s and early 1950s used preparative liquid chromatography to fractionate samples of virgin crude oil and petroleum distillates to determine their contents of paraffins, naphthalenes, olefins and aromatics (Camin and Raymond 1973).
2 .1 .2 .2 P r e p a r a tiv e n atu re o f ea rly c h r o m a to g r a p h y
Initially chromatography was carried out for quantitative, qualitative and preparative analysis using columns of larger diameters and larger particle sizes (100pm and more). The flow of the mobile phase along the column was dependent on gravity, sometimes accelerated by hydrostatic pressure. Because of the large particle sizes used the efficiency o f these columns was quite low (Engelhardt 1979).
Scale up and Modelling o f High Performance Liquid Chromatography
2.1.3 Other separation techniques
Although to begin with chromatography had a preparative character, it shortly developed into an analytical method. Kuhn, Lederer and Winterstein’s first important chromatography separations gave rise to the development of other analytical separation techniques. 1938 marked the beginning o f thin layer chromatography (Izmailov and Shraiber 1938).
In 1941 Martin and Synge introduced partition chromatography. Paper chromatography emerged thanks to Consden, Gordon and Martin in 1944. Ion exchange chromatography was developed in 1949 by Spedding followed by gas chromatography in 1952 (James and Martin), capillary GC in 1958 (Golay) and size exclusion chromatography in 1959 (Porath and Flodin). The first signs of a new method of separation appeared in the publications of several workers: Hamilton (1966) and particularly Giddings (1965) who gave an account of a fundamental theory of HPLC.
Liquid chromatography can be devided into two main classes: classical or conventional LC, and modem or high performance liquid chromatography also known as high pressure LC (HPLC). The latter is distinguished from conventional LC by its use of sophisticated instmments, high efficiency columns, and extremely sensitive detectors.
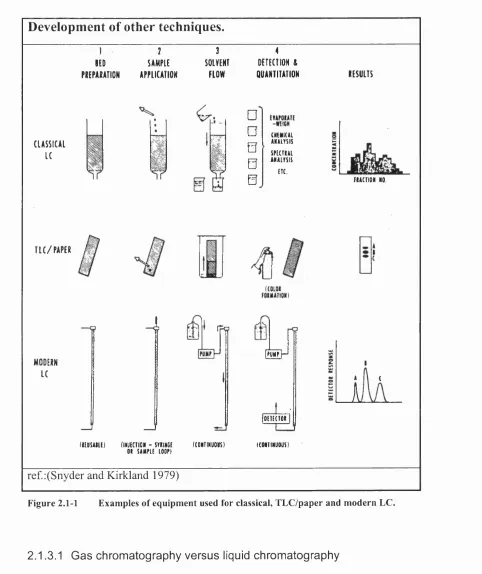
Development of other techniques.
I BED PREPA K A TIO N
2
S A M P LE A P P L IC A T IO N
3
SOLVENT F L O W
4
D ET E C T IO N & Q U A N T IT A T IO N
C L A S S IC A L
LC
%
□
o
0
0
0
C H t H I C U
« â l Y S I S
S P t C T I A l A N A i r S I S ETC
T L C / P A P E R #
M O D E R N LC
4
ïrQI P U M PH
[O E IE CT O P
( l E B S A I L E ) ( IN J E C T I O N - STXINGE ( C O N T I N U O U S )
0 1 S A M P L E L O O P ) ( C O N T IN U O U S )
R E S U L T S
E X A CT IO N NO
A \ C
1
ref.:(Snyder and Kirkland 1979)
Figure 2.1-1 Examples of equipment used for classical, TLC/paper and modern LC.
2 .1 .3 .1 G a s ch ro m a to g ra p h y v e r s u s liquid ch ro m a to g ra p h y
Liquid chromatography arose in the late 1960s and is a complementary method to gas chromatography. In fact gas chromatography gave the theoretical base for liquid chromatography. The latter developed as a result of a limitation of GC: liquid
Scale up and Modelling o f High Performance Liquid Chromatography
chromatography can easily separate substances which cannot be vaporised readily. HPLC is particularly suitable for the separation o f compounds with:
a) high polarity
b) high molecular weight
c) a tendency to ionise in solution d) thermal instability.
As there are differences between LC and GC, allowances had to be made for LC. As liquids are 20 to 100 times more viscous than gases, higher pressures are experienced in LC.
As the diffusion rates in LC are between 3000 to 30000 times lower than in GC, particles o f much lower diameter have to be used ( 5-10pm). The columns used in LC are shorter: about 100 to 250 mm long, 5mm in diameter, and with operating pressures o f 300 to 3000 psi. The equipment must withstand high pressures and the use o f eluents of various compositions and pH range: for this reason stainless steel and PTFE are the materials most commonly used by manufacturers (Knox 1978).
2.1.4 Classical chromatography
Classical chromatography was performed on glass columns roughly 100cm x 5cm. The
column had to be emptied after the analysis and repacked for the next separation. As many of the stationary phases were not very efficient, long columns (with consequent long retention times) had to be used to accomplish the analysis. The consumption of solvent was consequently high. Additionally, the individual samples had to be collected manually. A typical separation therefore required several hours which was very time- consuming. The results were recorded as a chromatogram, a bar graph o f sample concentration against fraction number (Snyder and Kirkland 1979).
The packing material used in these separations included aluminium oxide, calcium carbonate, magnesium oxide, and fuller's earth (an earthy hydrous aluminium silicate, capable o f absorbing grease): there was no mention of silica gel which is the most popular packing material today (Verzele and Dewaele 1985).
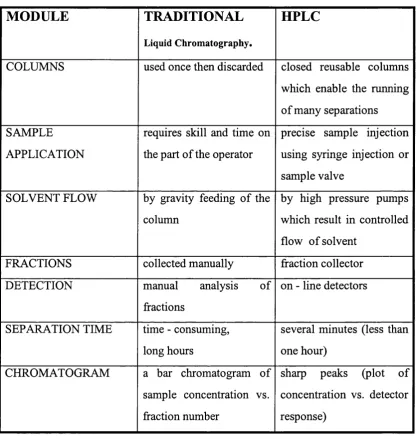
2.1.4.1 Classical LC versus HPLC
MODULE
TRADITIONAL
Liquid Chromatography.
HPLC
COLUMNS used once then discarded closed reusable columns
which enable the running o f many separations
SAMPLE APPLICATION
requires skill and time on the part of the operator
precise sample injection using syringe injection or sample valve
SOLVENT FLOW by gravity feeding of the colunrn
by high pressure pumps which result in controlled flow of solvent
FRACTIONS collected manually fraction collector
DETECTION manual analysis of
fractions
on - line detectors
SEPARATION TIME time - consuming, long hours
several minutes (less than one hour)
CHROMATOGRAM a bar chromatogram of
sample concentration vs. fraction number
sharp peaks (plot of concentration vs. detector response)
Table 2.1-1 A comparison of traditional and HPLC techniques.
The “birth” of HPLC was a result of an immense improvement in instrumentation, packing material, columns and, above all, in the understanding o f chromatographic theory.
Scale up and Modelling o f High Performance Liquid Chromatography
2.1.5 HPLC - High Performance Liquid Chromatography
2 .1 .5 .1 H istorical d e v e lo p m e n t o f HPLC
HPLC plays an important role as a fast, sensitive and accurate analytical method. The development o f HPLC was triggered by the discovery o f DNA. The more recent technique o f separating subnanolitre quantities o f nucleotides and nucleosides from hydrolysates o f DNA and RNA was not available when HPLC was first being developed. The results achieved using the columns available were not satisfactory: retention times were still long and other characteristics were not reproducible even when applying modules from the same company; pump flowrates were inconsistent and a sensitive universal detector for HPLC which could be as good as the flame ionization detector for GC did not exist (Brown 1990).
In 1958 the first liquid chromatograph was produced (Spackman et al. 1958).
Some years later Horvath and Lipsky (1966)(1967) pioneered the development of HPLC. The authors constructed and published a complete system for separations.
The technique was later developed (1968-1973) into modem HPLC by Huber, Kirkland, Majors, Snyder, Unger, Karger, Knox and other scientists. By the end o f this period, HPLC developed using 5 pm silica gel and 10 pm reversed phase bonded silica (Majors
1973).
The development of microparticle chemically bonded packing was a major breakthrough which made HPLC a valuable separation technique for the life sciences (Kirkland 1971, 1972). The reputation and convenience o f this technique was enhanced by the introduction o f reversed phase packing which made it a more universal tool (Halasz and Sebastian, 1969). Subsequent to 1975 the microprocessor began to play a major part in the wide range o f chromatography data processing and data acquisition (Scott 1985). By the late 1970s HPLC became an accepted technique in any laboratory requiring a good separation (Snyder and Kirkland 1979).
As HPLC has developed the size of particles used has decreased. Today use is made of micro-particulate column packing consisting o f uniform silica particles o f spherical shape, usually sized between 3 and 10 pm. Seventy-five percent o f separations are now performed on chemically bonded phases. Typically the column length is 100 to 250 mm
and the diameter 4.6 mm. The mobile phase is pumped through the colunrn at 1 to 5 ml/min. (Lindsay, 1992).
HPLC serves as an analytical tool and its speed, high resolving power, versatility and predictability facilitate the performance of highly satisfactory qualitative and quantitative analyses with samples of different origins and structure. These analyses give a high number of theoretical plates coupled with good resolution and capacity. Taken together these factors make HPLC a good candidate for scale-up and production- scale LC for the high value-added products which are becoming so important.
HPLC uses narrow columns o f small diameter (2-8mm). The speed of separations is increased by pumps with high pressures: 10-400 bar. (Engelhardt, 1979).
The revival of LC in 1970, leading to the development o f HPLC, induced the study of preparative separations. Preparative LC has generated wide appreciation in the pharmaceutical industry. With the rapid development o f new pharmaceuticals arising from the recent remarkable progress in genetic engineering (recombinant products), the need has emerged for a good preparative technique which can fulfil the current requirements of speed, purity, quantity, quality and cost effectiveness.
2 .1 .5 .2 Main fe a t u r e s o f H PLC
• small particles (3-5 pm) • regular (uniform) particles • spherical particles
These three features in particular helped to minimise diffusion and enabled a rapid interaction of the solute with the surface. Having these aspects under control leads to an improved column efficiency, i.e. increase in plate number.
Great progress in the field of instrumentation brought about the following characteristics of modem HPLC technique:
• powerful and versatile technique
Scale up and Modelling o f High Performance Liquid Chromatography
• more convenient and less operator dependent • minimum sample preparation
• on-line (continuous) detection - increased speed o f data capture and analysis (advances in microprocessor development- computer controlled instrumentation) • highly sensitive detectors - with the use of spectrophotometers operating down
to 190nm, it is possible to detect almost any compound type • more reproducible operation
• greater accuracy and precision • better & faster separation.
2.2 Chromatographic theory
2.2.1 Chromatography characteristics
2 .2 .1 .1 C a p a c ity fa cto r (k’)
In partition chromatography, which is based on the partitioning o f a solute between a stationary and a mobile phase, the principle is governed by Nemst’s law:
K = Cs/Cm (2.2.1)
where K is the distribution constant and Cs and Cm are concentrations o f the solute in the stationary and mobile phases, respectively. This can be expressed in relation to the capacity factor as:
K = k ’ VmA^s (2.2.2)
where Vm and Vs are the volumes of a sample in the mobile and stationary phases, respectively.
The capacity ratio in liquid chromatography is the ratio o f the amounts of the compound in the stationary and mobile phases.
k' = (tR - t j / t , or k* = (V, - V j/V , (2.2.3)
where t^ is the retention time of a compound - which is the time that a peak spends in the column
to is the hold-up time - the time of an unretained, unadsorbed compound; alternatively, the retention time of the mobile phase
retention volume
Vo mobile phase volume of a column
Scale up and Modelling o f High Performance Liquid Chromatography
2 .2 .1 .2 S e le c tiv ity fa cto r (a )
It is expressed by the separation factor a and is a measure o f the ease o f the separation.
a= k 2’/ k ; ( 2 .2 .4 )
where k / and kg' are capacity factors o f compounds 1 and 2, respectively.
This means that high values of a can give a better separation. It follows that if a = 1 the separation does not take place. The a values are much more important in preparative chromatography than they are in analytical chromatography. There is a desire to achieve the highest possible value of selectivity factor that will allow greater loads to be used on the colunrn and consequently an increased rate of production.
2 .2 .1 .3 R e so lu tio n (Rs)
Is a degree of disengagement of two bands. Small values o f usually appear as overlapped bands (Snyder, Glajch and Kirkland 1988). To calculate from the band, the following equation can be used:
Rs = ( «2 - t , ) / [ ( l / 2 ) ( w , + W j ] (2.2.5)
ti and tg refer to the retention times o f two adjacent bands and W, and Wg are their baseline bandwidth. This equation is used when bands 1 and 2 are completely separated. (R,>1.5).
However, when the peaks overlap, baseline measurements become difficult. In these circumstances the widths of the peaks are measured at their half height.
Rj = 1 .1 8 ( t 2 - t ,) /( w , + W2) ( 2 .2 .6 )
where w, and W2 are peak widths of compounds 1 and 2 at half height.
For another way of calculating resolution see the end of Section 2.2.2.S.
2 .2 .1 .4 S y m m e tr y (S )
The symmetry factor determines how symmetrical the peak is. This is measured at 10% of the height o f a peak where the peak is devided into two parts by the perpendicular running from the peak crest to its base. This gives us two widths o f the peak Wpj and Wp2- Thus symmetry can be calculated as:
s = —
(2.2.7)
Symmetry S=1 is ideal but small variations from this value are acceptable.
2.2.2 Efficiency
2 .2 .2 .1 N u m b er o f th e o re tic a l p la te s (N)
The efficiency of a chromatographic system can be expressed by the number of theoretical plates:
N = 5.54(V p/W i/J' = 5 .5 4 (t, / L1/2)' ( 2 .2 .8 )
where w^j is the peak width at half height t^ is the retention time of a compound t^i/ 2 is the half width at half height
2 .2 .2 .2 H eig h t e q u iv a le n t to a th e o re tic a l p la te (H)
Colunrn performance can also be expressed by the plate height or height equivalent of one theoretical plate H and it is equal to:
H = L/N ( 2 .2 .9 )
where L is a column length and N is a number o f theoretical plates.
Scale up and Modelling o f High Performance Liquid Chromatography
2 .2 .2 .3 D erivation o f th e n u m b er o f th e o re tic a l p la te s
Because sample zones in HPLC are nearly Gaussian in shape, they can be defined by the equation for the standard error function. As a result the measure o f band width of a chromatographic peak is the same as the standard deviation o f the distribution a. Height Equivalent to a Theoretical Plate (HETP) was defined by Martin and Synge (1941) as
2
H = on (2.2.10)
A/ = L (2.2.11)
<7
where <r is a band width and Z is a column length.
If we assume that zone width w is approximately 4 a the equation for the theoretical plates can look like:
AT = - ^ = 1 6 - (2.2.12)
W \ \ W /
4
When N is calculated from a chromatogram, L and w must be converted to time based units which gives:
= or A = 5 .5 4 |^ ^ | ( 2 .2 .1 3 )
where W is the peak width at the baseline of a chromatogram w is the peak width at half height.
The factors 16 and 5.54 come from statistical mathematics related to the Gaussian shape o f the peak.
Plate height is usually calculated from N:
and this formula is useful when comparing the efficiencies of columns o f different lengths (Bidlingmeyer 1992).
To determine how the resolution is related to other separation parameters and how it can be controlled by choosing the best experimental conditions, the following equation (also known as Purcell’s equation) is used:
R, = ( l / 4 ) ( a - l ) N ‘’*[k'/(l + k')]
2.2.3 Porosity.
One of the routine checks done on a column is to calculate the bed porosity. This determines how good the column is. Bed porosity is determined from a void volume- volume of an unretained peak such as uracil. If that is not possible, the tg value is taken from the first baseline “blip” on the chromatogram.
2 .2 .3 .1 T otal P o r o sity (8t)
where r is the column radius F is a volumetric flowrate
Vq is the column volume
A well-packed column would have a porosity in the range of 0.6-0.9. Porosity which exceeds 0.9 means that the compound used for the test was retained.
2 .2 .3 .2 Internal a n d e x tern a l p o ro sity Total porosity consists of two types of porosity:
a) porosity within the particles or intraparticle porosity (internal porosity) and b) porosity between the particles or interparticle porosity (external porosity)
Scale up and Modelling o f High Performance Liquid Chromatography
£ j = £ i + £ ^ (2.2.15)
where
gg is external porosity
£■,. is an internal porosity
The interparticle (or external) porosity has a value between 0.35 and 0.5. The value of the overall porosity is between 0.6 and 0.8.
2.2.4 Darcy’s law and Carman-Kozeny equation
In order to calculate a pressure drop across the column Darcy’s law equation is used. It is a permeability equation which relates the flow o f fluid through a porous medium to the pressure gradient causing the flow. Darcy’s law was essentially derived from Ohm’s law of fluid flow..
2 .2 .4 .1 O h m ’s law
Ohm’s law states that the flux of a current is proportional to the pressure drop per unit length
^ = (2.2.16)
dp
where Kp is a constant of proportionality (empirical parameter) and — is the pressure
drop per unit length.
2 .2 .4 .2 D a rcy ’s law
Darcy’s law enables the calculation of a total flow through a known medium under the given hydrostatic conditions.
FrjL AlSp
^f = - 7 7 - (2.2 .1 7 )
where
Kp is a specific column permeability
A is the surface area o f the column opening ft is a mobile phase viscosity
Ap is a pressure drop across the column
The disadvantages of Darcy’s law are its limited applicability to laminar flow and the fact that it does not reveal much about the flow pattern. There was therefore a need for a more developed equation. This came in the form of the Carman-Kozeny equation (Coulson and Richardson 1978). This equation extends to turbulent flow and also includes a porosity parameter.
2 .2 .4 .3 C a r m a n -K o z e n y law
The Carman-Kozeny equation relates permeability and porosity. This equation is also used to calculate a particle size. The size o f particles in a packing is not normally uniform but usually falls within a given range. Obviously, the narrower the given range the better.
2.2.4.3.1 Permeability for nan-porous particies
Carman-Kozeny derived the equation to calculate permeability from particle size for columns filled with regular non-porous spherical particles.
KcK = (d p 'G /)/[k (l-E j'] (2 .2 .1 8 )
where K^^: is the Carman - Kozeny permeability dp the particle size
Eg the interstitial (external) porosity and
k a constant related to the form of the particles (150<k<200)
2.2.4.3.2 Permeability for porous particles
For porous packings the chromatographic permeability is:
Scale up and Modelling o f High Performance Liquid Chromatography
urjL
Kt o= - ^ (2.2.19)
where u is linear velocity
Kjo can be related to Kp as follows:
K p = s^ Kj q (2.2.20)
where Kp is specific permeability (Darcy’s law)
L inear v e lo c ity
The velocity used in the equation is a linear velocity o f the mobile phase. This can be calculated in two ways:
a) when to is known: L
u — — (2.2.21)
[cm/sec]
where to is a hold-up time (the time when mobile phase is eluted o f the column) b) when to is not known, it is calculated from volumetric flowrate F
u = — (2.2.22)
Ae,
where F is a volumetric flowrate [ml/min]
A is a geometric cross-section of the column [cm^]
2.2.5 H/u curve
The plate theory of chromatography was developed by Martin and Synge (1941).
This theory managed to describe the results but does not explain how and why the chromatography works. Therefore a number of researchers have attempted to describe
band spreading in the column. Two of these theories have become most important: Van Deemeter equations and the Knox equation.
2 .2 .5 .1 V a n D e e m te r e q u a tio n
The best known approach (theory and equation) is that by van Deemter, Zuderweig and Klinkerberg (1958) which is based on the mass balance model.
This equation expresses the sum of all the contributions to the H value:
H = Ah + Bh/u + ChU ( 2 .2 .2 3 )
where is the eddy diffusion
Bh is the longitudinal (axial) diffusion Ch is the mass transfer resistance u is the linear solvent velocity
Peak dispersion against mobile phase velocity is often expressed in a van Deemter plot or H/u curve. This curve can tell us about the quality of the packing material used, whether the packing procedure was correct, and whether this was the right chromatographic system for the compounds of interest to be separated.
2 .2 .5 .2 K nox e q u a tio n
The above van Deemter equation is now, however, obsolete. Knox and Parcher (1969) and Bristow and Knox (1977) later discovered that the A-term exhibited dependency on velocity for columns packed both with non-porous glass beads and porous non-spherical particles o f Chromosorb. This fact led to the so-called Knox equation which is now widely used amongst researchers.
h = A v ''^ + ^ + C v (2 .2 .2 4 )
where v is a reduced velocity, defined on the next page.
Scale up and Modelling o f High Performance Liquid Chromatography
In the early days of chromatography, B term and A term were neglected as it was not possible to measure the former and the latter was negligible because the columns were not very well packed at that time. Therefore the plate height was determined by the C term or H = Cu. However, with the advent o f the use o f small particles, the B and particularly the A terms became vitally important (Verzele and Dewaele 1985)
A, B and C terms are defined as follows:
A = 21dp (eddy diffusion term) (2.2.25)
B = 2yDjn (longitidinal diffusion term) (2.2.26)
C = codp^/Dn, (mass transfer term) (2.2.27)
where
A, is a packing factor which value equals 0.7 y is a geometrical factor with a value of 0.5 CO is a geometry factor
other terms are defined elsewhere.
The dominant factors which control plate height are therefore: flow velocity, particle diameter, packing structure, packing geometry and diffusion coefficient. They are commonly referred to as kinetic parameters.
The longitudinal diffusion or B-term becomes significant at very low flowrates particularly as the diffusion coefficient is large. The mass transfer or C- term is directly proportional to reduced velocity. It represents the right side o f the h/v curve. It is directly proportional to the particle size and indirectly proportional to the diffusion coefficient o f the solute. This means that the slope of the right hand side o f the curve will be steeper the larger the particle size and the minimum reduced velocity will be reached at lower velocities. This is because the mass transfer contributions would lead to a larger band broadening. However, the tendency in chromatography is to use higher velocities in order to reduce the separation time. It is therefore obvious that, to enable the chromatographer to operate at low plate heights (large column efficiencies) and larger velocities, a small particle diameter needs to be employed. Although the C-term is affected by the diffusion coefficient it is affected to a much greater extent by the particle diameter because the C-term increases according to the square o f the latter. Solutes with
larger diffusion coefficients are preferred at high velocities as large diffusion coefficients in this case reduce the value of C-term (unlike in the case of the B-term) as they speed up the diffusion process.
2 .2 .5 .3 R e d u c e d v e lo c ity and r e d u c e d p la te h e ig h t
The lowest value on the H/u curve is directly related to the size of the particles. In order to compare columns with different particle sizes reduced parameters o f plate height and velocity can be used. The equations for reduced plate height and reduced velocity follow:
Reduced velocity:
1/ = ^ (2.2.28)
D .
where:
V is reduced velocity, also known as particle Peclet number dp is a particle size
is a diffusion coefficient of a solvent u is linear flowrate
Reduced velocity tells whether an average solute molecule is moved primarily by the flow or by diffusion. If the value is >1, the solute movement is governed by the flow. On the other hand, a value <1 would indicate that diffusion has priority over flow in the movement (Giddings 1965).
Reduced plate height:
h = 4 ~ (2.2.29)
H is the height equivalent to a theoretical plate
For a moderately well-packed column h=3 (Subramanian 1991)
Scale up and Modelling o f High Performance Liquid Chromatography
2 .2 .5 .4 T h e o p tim u m flow rate
The ideal reduced velocity occurs when v is between 3 and 5. To calculate the volumetric flowrate which corresponds to this value, the diffusion coefficient needs to be determined. This comes from Wilke-Chang equation (1955):
^ L ^ [cmls>] (2.2.30)
where
M2 is the molecular weight of the solvent [g]
^ 2 is the solvent association factor which accounts for solute-solvent interactions (1 for
non-polar solvents, 1.9 for methanol, 1.5 for ethanol and 2.6 for water) T temperature in [°K]
T| is viscosity [cP]
Vj molar volume o f the liquid solute at its normal boiling point (molecular weight of solute/density) [cm^mol ']
The optimum flowrate is then calculated:
vD
u = ^ (2.2.31)
u = - L _ (2.2.32)
Ae j.
2.2.6 Reynolds number
Giddings (1965) in “Dynamics of chromatography” analysed the laminar and turbulent flow in straight tubes and tubes containing granular materials.
2 .2 .6 .1 R e y n o ld s n u m b er for stra ig h t t u b e s
Reynolds number is an indication of laminar or turbulent flow. The standard equation used for the calculation of Reynolds number is applicable to straight tubes.
Re = (2.2.33) V
where p is density of the mobile phase [kg/m^] u is linear flowrate [m/sec]
dt is the internal diameter of the tubing [m]
p is a dynamic viscosity [cpoise= 10 Nsm '^=10 '^kgms'^*m'^s]
The linear flowrate is calculated:
^ (2.2.34)
A60
where A is the cross section area o f the tube used.
In straight tubes, the flow is regarded as laminar up to the value o f Re 2100. When the Re reaches the value o f 4000, the flow is turbulent. The region in between is a transition region.
2 .2 .6 .2 R e y n o ld s n u m b er for p a c k e d c o lu m n s
For columns packed with granular material, the Reynolds number is calculated as follows:
Re = (2.2.35)
where
dp is a particle diameter p is a mobile phase density V is a linear velocity ?/is a viscosity
The linear flowrate is calculated:
Scale up and Modelling o f High Performance Liquid Chromatography
u = --- (2.2,36)
A S j 6 0
where A is a cross section area of the column (=7r*r/)
In tubes packed with granular material, on the other hand, turbulent flow already starts at Re=l and develops into the fully turbulent flow at Re=100.
The turbulent flow, with its flattening profile, equalises the velocities in the tubing. The importance o f equations is particularly relevant when the contribution o f band broadening is studied in preparative chromatography with and without the column.
2.2.7 Statistics
2 .2 .7 .1 T h e arithm etic m e a n
—
% = — (2 .2 .3 7 )
where A is a measurement value SX is the sum of the measured values N is number o f measurements
2.2.7.2 The standard deviation
Can be calculated
or
N - l
s = — --- (2.2.38b)
where
is the sum o f the squares of all values of X taken singly (ZX)^ is the square o f the sum of all values o f ^
2 .2 .7 .3 T h e sta n d a rd error
S . E = ^ (2.2.39)
where s is standard deviation
2 .2 .7 .4 C o n fid e n c e limits
95%.CL = X ± t,osS.E. (2.2.40)
where X is the arithmetic mean
W.05 is “Student” constant for 95% confidence limits
2 .2 .7 .5 D e g r e e s o f fr e e d o m
D.F.=N-1 (2.2.41)
The equations were taken from Parker (1979) and Caswell (1982)
Scale up and Modelling o f High Performance Liquid Chromatography
2.3 Column band broadening and extra-column band broadening
S u m m a ry
This section deals with dispersion of the sample during a separation. The final band width of a peak is the sum o f band broadening in the colunm and outside the column. Here both o f these aspects are explained.
2.3.1 The separation process
A chromatographic separation is characterised by two phenomena: differential migration o f the sample compounds and diffusion both taking part concurrently.
2 .3 .1 .1 D ifferential m igration
Chromatographic separation is possible due to differential migration o f the compounds of a sample. The separation takes place because the molecules of different compounds are more or less adsorbed to the stationary phase and thus are eluted from the column earlier or later. Differential migration depends on the equilibrium distribution of each compound between the stationary and mobile phases.
The interaction of the sample with the stationary phase is a thermodynamic property. The factors which affect the rate of differential migration are: the composition of the mobile phase, the composition of the stationary phase and the temperature.
2 .3 .1 .2 D isp e r sio n
Dispersion, on the other hand, is governed by kinetics. Excessive dispersion leads to a decrease in the quality of the separation, making the peaks wide and consequently overlapping.
C olu m n b a n d b r o a d e n in g
As the solute band passes through the colunm, the width of the band increases and the solute is diluted by the mobile phase.
There are three main contributors to mobile phase band broadening: eddy diffusion, longitudinal diffusion, and mass transfer.
• Eddy diffusion
Eddy diffusion - also known as multiple flowpaths - is a result of the different microscopic flowpaths followed by the solvent. Thus sample molecules take different directions according to which solvent molecule they follow. Some of the molecules will move faster along the column (e.g. in wide paths) and some will move slower (e.g. in narrower paths). As a result, all this contributes to the to the spreading o f molecules along the column.
• Longitudinal diffusion
Longitudinal diffusion is related to a sample. Whether the mobile phase is moving or steady, the sample molecules spread in all directions. This becomes significant particularly at low mobile phase flowrates (Snyder and Kirkland 1979).
Axial dispersion includes, in addition to molecular diffusion, the tortuosity of the flow and non-homogeneity of the colunm bed.
• Mass transfer
Mass transfer is divided into two groups: mobile and stationary phase mass transfer.
* Mobile phase mass transfer
Mobile phase mass transfer refers to the solvent molecules moving between two particles. Molecules in the middle o f the stream are carried away by the flow faster than those close to the particle walls. As a result some of the molecules are eluted from the column faster than others.
Scale up and Modelling o f High Performance Liquid Chromatography
* Stagnant mobile phase mass transfer
Stagnant mobile phase mass transfer is linked to the solvent molecules entering the pores o f the particle. Some of the molecules will enter further into the pore than others. The result is band broadening.
* Stationary phase mass transfer
Once the molecules have entered the pores there will be an interaction between the particle and the molecules of solvent and the sample. The interaction is stronger if the penetration of the solvent or sample molecule is deeper. The deeper the penetration, the longer the time spent in the stationary phase and thus the longer it takes for that molecule to be eluted from the column. This action is called stationary phase mass transfer.
E x tra-colu m n b an d b r o a d e n in g
Extra-column band broadening is a result of band broadening caused by a source other than the column. It takes place in the parts o f the equipment through which the sample travels: i.e. anywhere between the injector and the detector inclusive.
In most cases the sample is diluted by using wider bore tubing between the injector and detector or by simply injecting a larger amount of sample using larger loops (Snyder and Kirkland 1979)
Therefore the contributions to band broadening (Dolan and Snyder 1989) result from: 1. volume of injected sample
2. detector time constant 3. connecting tubing 4. fittings
5. detector volumes.
=> Volume o f injecting sample
If the sample is dissolved in the mobile phase the extra-column band broadening value is twice the sample volume. If, however, the sample is dissolved in a weaker solvent, it is possible to use larger injection volumes without the impact o f band broadening.
=> Detector time constant
A slow response of the detector can also contribute to band broadening o f the sample. The time constant is usually adjustable to fast or slow response. Fast response gives a small value o f band broadening but a noisy baseline.
The contribution of the detector time constant to band broadening Wt^ equals:
The time constant should not be more than 1/12 the baseline width o f the first band of interest. A value of 0.25 sec is usually acceptable.
=> Connecting tubing.
The width of the tubing also contributes to band broadening: the wider the tubing the more diluted the sample and therefore more axial spreading occurs. Usually 0.01-in. tubing is used anywhere between the injector and the detector. Although even thinner tubing would be preferred its use can result in blockages and thus high pressures.
=> Detector volume
The volume of the flowcell contributes to band broadening and many flowcells have a capacity o f approximately 8 pi. Band broadening in the detector is roughly equal to eight times the volume of the flowcell, or approximately 64 pi. However, this value can be higher as additional factors play a role such as the tubing connecting the inlet and outlet ports, and the shape o f the flowcell. To minimise the broadening o f early eluting peaks, the volume of the detector cell should be less than about 1/10 the volume o f the peak of interest Vp: ¥^<0.1 Vp (Sternberg 1966).
Scale up and Modelling o f High Performance Liquid Chromatography
2.4 Wall effect and Infinite diameter columns
Knox and Parcher (1969) in their paper on “infinite diameter columns” investigated the ratio o f column to particle diameter and its influence on plate height.
According to this theory, the wall effect is caused by inequalities in the flow pattern through the cross section of the column. The column consists o f a central circular core with a random bed structure. That core is surrounded by a layer o f about 3 particle diameters from the column wall where the packing structure is different from the core and is dominated by a smooth wall. The experiments showed that the flowrate o f the mobile phase in this layer was much greater than in the rest of the column.
According to the authors, h (reduced plate height) is a function o f v (reduced velocity) for columns with the same ratio of column length to column diameter and particle size. This function also depends on the ratio of column to particle diameter.
They arrived at a general equation:
- ^ = 2Adp (2.3.1)
where d^ is the column internal diameter dp is the particle diameter
The ratio of column to particle diameter is:
P ^ ~ f ~ (2.3.2)
p
Their experiments at different velocities using different ratios o f p showed that there is a region of p between 6 and 8 where the reduced plate height - h - suddenly increases. They therefore plotted log(h) vs. log(p) at a particular reduced velocity v=300. The sigmoidal profile revealed that there is a region at p =7 where the gradient o f the curve sharply increases and then it levels off.
To avoid working in the region o f a rapid increase in h the concept o f infinite diameter column was introduced.
When an infinite diameter column is used the sample injected at the head of the column would never reach the column walls by the time it reached the foot o f the column. In these circumstances the sample will not be affected by the wall effect and the disturbances connected with it.
Golay (1961) first noticed the boundary layer effect (“wall effect”) when experimenting in gas chromatography. He concluded that the increase in plate height “h” due to the wall effect was independent o f the column diameter when the column diameter was much larger than the particle diameter. According to Golay the thickness o f the layer is about O.Sdp.
He also suggested that the wall effect can be eliminated by roughening the inner column wall to slow the fast moving boundary layer.