Introduction
The Subsecond Thermophysics Group at Graz University of Technology has been working to determine the thermophysical properties of liquid metals for about 25 years. The work remains rele-vant and of current interest for scientific applications as well as for the metalworking indus-try. Accurate data for the melting transition and the liquid state are often sparse, but are essential inputs to computer simulations, for instance those of solidification or die-casting.
Palladium is used in dentistry, jewellery, watch-making, spark plugs, the production of electrical contacts, and metallising ceramics (1). Finely divid-ed palladium makes a good catalyst, usdivid-ed to accelerate hydrogenation and dehydrogenation reactions, and for petroleum cracking. The palladi-um-hydrogen electrode is used in electrochemical studies. Palladium has recently attracted much interest as a potential replacement for higher-priced platinum in catalytic converters for controlling emissions from diesel vehicles.
The present experiments on palladium form part of a systematic investigation of the thermo-physical properties of the platinum group metals. Measurements on rhodium are scheduled in the present programme; osmium and ruthenium are not available in wire shape. Platinum and iridium have already been investigated (2–4), and show a slight increase of normal spectral emissivity at wavelength 684.5 nm in the liquid phase, similar to
the trend in emissivity values for palladium report-ed in the present work.
Experimental and Data Reduction
Procedures
Using a pulse-heating apparatus (Figure 1), the thermophysical properties of conducting materials are accessible from the solid state up to the end of the stable liquid phase. For the present investiga-tions, palladium samples in the form of wire (0.5 mm diameter, 60 mm length, purity 99.9%, pur-chased from Alfa Aesar, Stock 10279, lot F28J28) were incorporated in a capacitor-driven discharge circuit and resistively pulse-heated.
The following parameters were determined directly:
• electric current • voltage drop • surface radiance • thermal expansion • normal spectral emissivity.
From these, the following thermophysical proper-ties were derived:
• sample temperature • enthalpy of fusion • isobaric heat capacity
• electrical resistivity at initial geometry • electrical resistivity under thermal expansion • thermal conductivity
• thermal diffusivity.
The accessible range of measurement extends DOI: 10.1595/147106706X129079
Thermophysical Properties of
Palladium
DETERMINATIONS (INCLUDING SPECTRAL EMISSIVITY AT 684.5 nm) AT THE MELTING TRANSITION AND IN THE LIQUID STATE
By Claus Cagran and Gernot Pottlacher
Institut für Experimentalphysik, Technische Universität Graz, Petersgasse 16, A-8010 Graz, Austria; E-mail: pottlacher@tugraz.at
from room temperature up to superheated liquid states. Experimental details are described exten-sively elsewhere (2, 5).
To enable accurate and unambiguous tempera-ture determination over such a large range, pyrometric detection based on Planck’s law of black-body radiation (6) was used. Normal spectral emissivity data were determined by an ellipsomet-ric method (division of amplitude polarimeter; μs-DOAP) (7, 8) to avoid uncertainties arising from the unknown emissivity and its behaviour
over the temperature range of the measurement.
Results
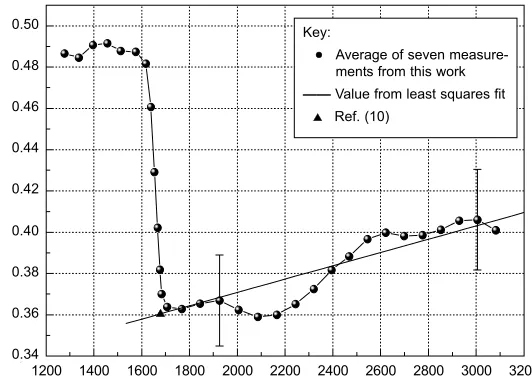
In Figure 2, the normal spectral emissivity, ε,of palladium at wavelength 684.5 nm is plotted against radiance temperature, Trad, and compared with literature results. The melting temperature of palladium, Tm, is 1828 K (9), whereas the radiance temperature at melting is 1680 K for wavelength 650 nm. At the latter temperature, the value of the emissivity is 0.36. An average of seven
measure-1200 1400 1600 1800 2000 2200 2400 2600 2800 3000 3200 0,34
0,36 0,38 0,40 0,42 0,44 0,46 0,48 0,50
no
rm
al
sp
ectr
al
e
m
issiv
ity
at 684
.5 nm
radiance temperature at 650 nm, K Fig. 1 Sketch of pulse-heating circuit
Fig. 2 Normal spectral emis-sivity for palladium at wavelength 684.5 nm versus radiance temperature at 650 nm for palladium
0.50
0.48
0.46
0.44
0.42
0.40
0.38
0.36
0.34
Normal spectral emissivity
,
ε
, at 684.5 nm
Radiance temperature, Trad,at 650 nm, K Key:
Average of seven measure-ments from this work ——Value from least squares fit
Ref. (10)
•
ments in the liquid phase produced the following linear fit for normal spectral emissivity in the radi-ance temperature range 1680 K < Trad< 3200 K:
ε = 0.3063 + 3.2258 ×10⁻⁵
Trad (i)
At the end of the solid phase, emissivity values were around 0.49 (following surface preparation with abrasive paper of grade 1200 or 4000). As the surface smooths during liquefaction, a strong decrease can be observed; the emissivity is 0.360 at the end of melting. An emissivity of 0.3602 for liq-uid palladium at the melting temperature is reported (10); this was interpolated for wavelength 684.5 nm. A slight increase of normal spectral emissivity is observed up to 3200 K; this is similar to the behaviour reported for platinum (11).
Figure 3 is a plot of specific enthalpy, H, versus temperature, T. Since this work focuses mainly on melting and the beginning of the liquid phase, temperature dependences are shown in all plots from around 1500 K upwards.
For the solid and liquid phases in the tempera-ture ranges: 1550 K < T < 1828 K and 1828 K < T < 2900 K respectively, averages of seven pulse-heating measurements give:
Hs(T) = –95.8103 + 0.2854T (iia)
Hl(T) = –55.5552 + 0.3507T (iib)
where H is in kJ kg–1 and T in K. The slope of
Equation (iib) gives a constant value of the isobar-ic heat capacity, cp, of (351 ± 36) J kg–1 K–1;
Arblaster (11) recommends for the liquid a value of 387 J kg–1K–1. (Our conversion from the molar
value uses an atomic weight of 106.42 (11)). At melting, which is indicated in Figure 3 by a vertical broken line, the specific enthalpy changes from Hs= 425.9 kJ kg–1to Hl= 585.5 kJ kg–1(the subscripts s and l denoting solid and liquid respec-tively.) These results yield ΔH = (159.6 ± 16) kJ kg–1for the enthalpy of fusion. Arblaster (11)
rec-ommends specific enthalpy values of 442.3 kJ kg–1
for the onset of melting and 593.4 kJ kg–1for the
end of melting, yielding ΔH = (151.1 ± 6.9) kJ kg–1
for the enthalpy of fusion. Dinsdale (12) reports a value of ΔH = 157.3 kJ kg–1for the enthalpy of
fusion. Seydel et al. (13, 14) report specific enthalpy values of 445 kJ kg–1for the onset of melting and
609 kJ kg–1for the end of melting, giving ΔH =
164 kJ kg–1for the enthalpy of fusion.
Figure 4 shows electrical resistivity, ρ, as a function of temperature, T. At the onset of melt-ing, indicated by a vertical broken line, a resistivity value of 0.461 μΩm is obtained for the initial geometry (i.e. with no correction for thermal expansion). The corresponding value at the end of melting is 0.724 μΩm. Thus an increase Δρ = 0.263 μΩm is observed at melting.
The linear fit to the present values for the
liq-1600 1800 2000 2200 2400 2600 2800
300 400 500 600 700 800 900 1000
speci
fic en
th
alp
y, k
J·k
g
-1
temperature, K
Fig. 3 Specific enthalpy versus temperature for palladium
S
pecific enthalpy
,
H
, kJ kg
–
1
Temperature, T, K Key:
Average of seven measure-ments from this work Linear least squares fit to mean values of measured data Recommended values from Ref. (11)
Melting temperature (1828 K) ——
3 3 O
uid in the temperature range 1828 < T < 2900 K is:
ρ= 0.7777 – 2.9226 ×10⁻⁵T (iii)
where ρis in μΩm and T in K.
For electrical resistivity that is compensated for thermal expansion, ρv, Seydel and Kitzel’s (13) thermal expansivity values for palladium were adopted. Several other authors also report density values for palladium (15–17). The change in diam-eter (and hence cross-section) of the sample with heating results in a shift to higher resistivity values. At the onset of melting, a volume-adjusted resistiv-ity of 0.495 μΩm was obtained, and at the end of melting 0.844 μΩm. Thus an increase Δρ= 0.349 μΩm at melting is observed. Matula (18) recom-mends a resistivity at the onset of melting of 0.46 μΩm and for the end of melting 0.83 μΩm, giving an increase Δρ= 0.37 μΩm at melting.
The polynomial fit to the present volume-adjusted values for liquid palladium in the temperature range 1828 K < T < 2900 K is:
ρv= 0.8372 + 3.5413 ×10⁻⁶T (iv)
where ρvis in μΩm and T in K.
The present resistivity values, compensated for thermal expansion, agree excellently with Matula’s recommendations (18) for the liquid phase, and well for the solid.
Figure 5 is a plot of thermal conductivity, λ, against temperature, T. To estimate thermal con-ductivity via the Wiedeman–Franz law (6), Seydel and Kitzel’s density data (13) were again used to correct electrical resistivity for actual thermal expansion. For liquid palladium in the temperature range 1828 K < T < 2900 K:
λ= 0.8131 + 0.0286T (v)
where λis in W m–1K–1and T in K.
At the onset of melting a thermal conductivity value of 85.3 W m–1K–1was obtained, and at the
end of melting, for the beginning of the liquid phase, 54 W m–1K–1. Zinovyev (19) reports a value
of 86 W m–1K–1at 1600 K. Vlasov et al. (20) as
cited by Mills et al. (21) report thermal conductivi-ty values for the end of the solid phase and the beginning of the liquid phase of 99 and 87 W m–1
K–1, respectively.
Thermal diffusivity, a, can be estimated from thermal conductivity (2). Thermal diffusivity is not plotted against temperature here; this gives no additional relevant information since λand cpare used for the calculation. The corresponding fit for liquid palladium in the temperature range 1828 K < T < 2900 K yields:
a = –1.7636 ×10⁻⁶
+ 8.9500 ×10⁻⁹
T (vi)
where a is in m2s–1and T in K. At the onset of
1600 1800 2000 2200 2400 2600 2800
0,35 0,40 0,45 0,50 0,55 0,60 0,65 0,70 0,75 0,80 0,85 0,90
ele
ctr
ical r
esisti
vity
,
μΩ
·m
temperature, K Fig. 4 Electrical resistivity
versus temperature for palla-dium
Key:
Average of seven measurements from this work, without correction for volume expansion, and least squares fit
Calculated with volume data from Ref. (13), with correction for volume expansion Melting temperature
Recommended values from Ref. (18) X
W
——
- - -
Electrical resistivity
,
ρ
,
μΩ
m
Temperature, T, K 0.90
0.85
0.80
0.75
0.70
0.65
0.60
0.55
0.50
0.45
0.40
melting a value for a of 2.75 × 10⁻⁵ m2 s–1 was
obtained, and at the end of melting, for the begin-ning of the liquid phase, a was 1.46 ×10⁻⁵m2s–1.
Discussion
Thermophysical data for liquid palladium are quite sparse in the literature. Seydel and Kitzel (13) report only enthalpy dependences and no temper-ature dependences, since they did not perform the latter measurements. The values found here for the normal spectral emissivity εfor liquid palladi-um at wavelength 684.5 nm at the end of melting give an excellent match to that reported by McClure et al. (10). The enthalpy of fusion obtained here compares very satisfactorily with the results reported by Arblaster (11), Dinsdale (12) and Seydel et al. (13, 14), within the range of uncer-tainty of the present work. Further, selected values from (22), considered the best of their time, must be considered outdated for comparison purposes. The temperature-dependent resistivity values reported here agree well with the recommended values of Matula (18), within the present experi-mental uncertainty. Only a comparison of the present thermal conductivity values at the onset and end of melting with corresponding data from Vlasov et al. (20) as reported by Mills et al. (21) shows a significant discrepancy, but Zinovyev’s data (19) for the end of the solid phase appear to confirm the thermal conductivity values obtained
in the present work.
Uncertainties
Within the terms of (23), the uncertainties reported here are expanded relative uncertainties with a coverage factor of k = 2. The uncertainties given in Table I have been derived for the thermo-physical properties calculated here.
Conclusion
For liquid palladium, a set of thermophysical data is reported here: enthalpy, isobaric heat capacity, electrical resistivity, thermal conductivity and thermal diffusivity as a function of tempera-ture. Since temperature measurement is combined with simultaneous emissivity measurements, there is no ambiguity in the present temperature-depen-dent data.
Acknowledgement
This research was supported by the Austrian Fonds zur Förderung der Wissenschaftlichen Forschung (FWF), Grant No. P15055.
1400 1600 1800 2000 2200 2400 2600 2800 3000
50 60 70 80 90 100 110
th
er
m
al
co
nd
ucti
vi
ty
, W
·m
-1 ·K
-1
temperature, K
Fig. 5 Thermal conductivity of palladium versus tempera-ture
Key:
Average of seven measurements from this work
Values for melting transition from Ref. (20) as reported in Ref. (21) Value from Ref. (19)
U U
•
V
Thermal conductivity
,
λ
, W m
–
1K
–
1
Temperature, T, K
References
1 “Platinum 2006”, Johnson Matthey PLC, Royston, Hertfordshire, U.K. , 2006, pp. 32–39
2 B. Wilthan, C. Cagran, C. Brunner and G. Pottlacher, Thermochim. Acta, 2004, 415, (1–2), 47 3 B. Wilthan, C. Cagran and G. Pottlacher, Int. J.
4 C. Cagran and G. Pottlacher, submitted to Int. J. Thermophys.
5 R. Gallob, H. Jäger and G. Pottlacher, Int. J. Thermophys., 1986, 7, (1), 139
6 M. Boivineau and G. Pottlacher, Int. J. Mater. Product Technol., 2006, 26, (3/4), 217
7 A. Seifter, F. Sachsenhofer and G. Pottlacher, Int. J. Thermophys., 2002, 23, (5), 1267
8 C. Cagran, B. Wilthan and G. Pottlacher, Int. J. Thermophys., 2004, 25, (5), 1551
9 R. E. Bedford, G. Bonnier, H. Maas and F. Pavese, Metrologia, 1996, 33, (2), 133
10 J. L. McClure, A. Cezairliyan and E. Kaschnitz, Int. J. Thermophys., 1999, 20, (4), 1149
11 J. W. Arblaster, Calphad, 1995, 19, (3), 365 12 A. T. Dinsdale, Calphad, 1991, 15, (4), 317
13 U. Seydel and W. Kitzel, J. Phys. F: Metal Phys., 1979, 9, (9), L153
14 U. Seydel, H. Bauhof, W. Fucke and H. Wadle, High Temp.–High Press., 1979, 11, (6), 635
15 P. S. Martsenyuk and Yu. V. Ivanschenko, Ukr. Khim. Zhur (SU), 1974, 40, 431
16 L. D. Lucas, C. R. Acad. Sci. (Fr.), 1961, 253, 2526
17 T. Iida and R. I. L. Guthrie, “The Physical Properties of Liquid Metals”, Oxford University Press, Oxford, 1988, p. 71
18 R. A. Matula, J. Phys. Chem. Ref. Data, 1979, 8, (4), 1147
19 V. E. Zinovyev, “Metals at High Temperatures – Standard Handbook of Properties”, Hemisphere Publishing Corporation, New York, 1990
20 B. V. Vlasov, S. G. Taluts, V. E. Zinov’ev, N. A. Korenovskii and V. P. Polykova, Phys. Met. Metall., 1992, 74, (4), 371
21 K. C. Mills, B. J. Monaghan and B. J. Keene, ‘Thermal Conductivities of Liquid Metals – Part 1: Pure Metals’, NPL Report CMMT(A), Teddington, U.K., 1997, p. 53
22 R. Hultgren, P. D. Desai, D. T. Hawkins, M. Gleiser, K. K. Kelley and D. D. Wagman, “Selected Values of the Thermodynamic Properties of the Elements”, American Society for Metals, Metals Park, OH, 1990 23 GUM, “Expression of the Uncertainty of Measurement in Calibration”, EA-4/02, European Co-operation for Accreditation, 1999,
http://www.european-accreditation.org/n1/doc/EA-4-02.pdf Table I
Uncertainties in Thermophysical Properties Determined for Liquid Palladium
Thermophysical parameter Symbol Uncertainty, %
Temperature T 4
Normal spectral emissivity ε 6
Enthalpy H 4
Enthalpy of fusion ΔH 10
Specific heat capacity at constant pressure cp 8
Electrical resistivity with initial geometry ρ 4
Expansion-corrected electrical resistivity ρV 6
Thermal conductivity λ 12
The Authors
Claus Cagran studied physics at Graz University of Technology, Austria, from which he received his master’s (Dipl.-Ing.) and doctoral (Dr. Techn.) degrees. He currently works for the Optical Technology Division at NIST, Gaithersburg, MD, dealing with optical reflectance and emittance measurements of metals, ceramics, and surface coatings.
Gernot Pottlacher studied physics at the Technical University of Graz, Austria, and holds its Dipl.-Ing. and Dr. Techn. degrees. He is a professor at the Institute for Experimental Physics. His main fields of activity are the