268
International Journal of Pharmaceutical Sciences and Drug Research
2018; 10(4): 268-273
Research Article
CODEN (USA): IJPSPP
ISSN: 0975-248X
Development and Validation of Stability Indicating Assay Method for
Determination of Felodipine in Tablet Dosage Form
Narendra G. Patre
*, S. S. Patil
Nanded College of Pharmacy, Nanded-431606, Maharashtra, India
Copyright © 2018 Narendra G. Patre et al. This is an open access article distributed under the terms of the Creative Commons Attribution-NonCommercial-ShareAlike 4.0 International License which allows others to remix, tweak, and build upon the work non-commercially, as long as the author is credited and the new creations are licensed under the identical terms.
ABSTRACT
A simple and sensitive, HPTLC method has been developed for the quantitative estimation of felodipine in it’s single component tablet formulation. The separation was carried out on Merck aluminium plates precoated with silica Gel 60 F254 using n -hexane: ethyl acetate in the ratio of 6:4 (v/v) as mobile phase. Felodipine showed Rf value of 0.53 ± 0.027 and was scanned at 366 nm using Camag TLC Scanner 3. The linear regression data for the calibration plot showed a good relationship with r=0.9792. The method was validated for precision and recovery. The limits of detection and quantification were 23.54 and 71.33 ng/spot respectively. The developed method was successfully used for the assay of felodipine tablet formulations. The method is simple, sensitive and precise; it can be used for the routine quality control testing of marketed formulations.
Keywords:Stability indicating, thin layer chromatography, Felodipine, 1,4-Dihydro pyridine.
DOI: 10.25004/IJPSDR.2018.100409 Int. J. Pharm. Sci. Drug Res. 2018; 10(4): 268-273
*Corresponding author: Mr. Narendra G. Patre
Address: Nanded College of Pharmacy, Nanded-431606, Maharashtra, India Tel.: +91-9822789255
E-mail: [email protected]
Relevant conflicts of interest/financial disclosures: The authors declare that the research was conducted in the absence of any commercial or financial relationships that could be construed as a potential conflict of interest.
Received: 17 May, 2018; Revised: 01 July, 2018; Accepted: 04 July, 2018; Published: 20 July, 2018
INTRODUCTION
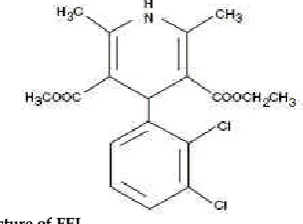
Felodipine is a calcium channel blocker and dihydropyridine derivative that is chemically described as ethyl methyl 4(2, 3-dichlorophenyl)-1,
4-dihydro-2,6-dimethyl-3,5-pyridinedicarboxylate. Its molecular
formula is C18H19Cl2NO4 and its structural formula is
shown in Figure-1. Felodipine is highly effective and well tolerated in hypertension mono therapy and in combination with 13-adrenoceptor blockers. [1] Calcium
is necessary for muscle cells to contract. Felodipine prevents calcium from being released within the
muscle cells of the small arteries and thereby causes the muscles to relax and the arteries to dilate or expand. Dilation of arteries reduces blood pressure. Felodipine has little or no effect on the muscles of veins or the heart. [2-6]
There is a need for a simple, rapid, cost effective and reproducible method for assay of FEP in its dosage forms. A literature survey revealed that several HPLC
[7-15], SFC. [16] References [17-18] are helpful in performing
Int. J. Pharm. Sci. Drug Res. July-August, 2018, Vol 10, Issue 4 (268-273) stability study of FEP. Therefore, it was thought of
interest to develop simple, rapid, accurate, specific and precise HPTLC method for the analysis of felodipine (FEP) in its tablet formulation. HPTLC method was developed and validated as per the recommendations of ICH guidelines of analytical method validation.
Fig. 1: Structure of FEL
MATERIALS AND METHODS
Felodipine (FEL) procured from Zydus Cadila Ahmedabad as Gift sample. The pharmaceutical dosage form used in study was a Felogard tablet labelled to contain 10 mg of FEL was obtained from local retail pharmacy. Other solvents are obtained from local market.
Instrumentation
The HPTLC system consisted of a Camag Linomat 5 semi-automatic spotting device (Camag, Muttenz, Switzerland), a Camag twin-trough chamber (10 cm × 10 cm), Camag win CAT Software 1.4.4.6337 and a 100µl Hamilton syringe. Sample application was done on pre-coated silica gel 60 F254 TLC plates (10 cm × 10 cm). TLC plates were pre-washed with methanol and activated at 80°C for 5 min prior to the sample application. Densitometric analysis was carried out utilizing Camag TLC scanner 3.
Preparation of standard solutions
A stock solution of FEP was prepared by dissolving 10 mg in 10 ml methanol (1000μg/ml). Further standard solutions were prepared by dilution of the stock solution with methanol to reach a concentration range 10μg/ml.
Selection of Detection Wavelength
From the standard stock solution further dilutions were done using methanol and scanned over the range of 200- 400 nm. The maximum absorbance showed at 366 nm.
Sample Preparation
Twenty tablets weighed accurately and powered. A quantity of powder equivalent to 10 mg average weight was calculated. The tablets were then powdered and an amount equivalent to one tablet was dissolved in 10 ml methanol. To ensure complete extraction of the drug it was sonicated for 45 min. This solution was filtered through a Whatman no. 41 paper.
Selection of Mobile Phasein chromatographic studies
Selection of Mobile Phase in chromatographic studies was carried out on the standard stock solution of FEL. Different mobile phases containing various ratios of
Toluene, Methanol, n- Hexane, Ethyl acetate and Isopropyl alcohol were examined. Finally the mobile phase containing n-hexane: Ethyl acetate (6: 4 v/v) was selected as optimal for obtaining well defined and resolved peaks. Other chromatographic conditions like chamber saturation time, run length, sample application rate and volume, sample application
positions, distance between tracks, detection
wavelength, were optimized to give reproducible Rf
values, better resolution, and symmetrical peak shape for the drug.
HPTLC method and Chromatographic condition In the proposed HPTLC method, the samples were streaked on the pre-coated TLC plates in the form of a narrow band 6 mm in length, 10 mm from the bottom and margin and 10 mm a part at a constant flow rate of 150nl/s by using a nitrogen aspirator. A Camag Twin Trough Chamber was saturated for 20 min at room temperature (25 ± 2°C) with the mobile phase containing a mixture of n-hexane: ethyl acetate in the ratio of 6:4 (v/v). After chamber saturation, the plates were developed to a distance of 80 mm and then dried in hot air. Densitometric analysis was carried out using a Camag TLC Scanner 3 (Camag) in the absorbance mode at 366 nm for all measurements. The slit dimension was kept at 5.0 mm × 0.45 mm and a scanning speed of 20 mm/s was employed. FEP was detected at Rf of 0.53 ± 0.027. The chromatograms were integrated using win CATS evaluation software (Version 1.1.3.0).
Summary of Chromatographic Parameters Selected
Solvent used : Methanol
Stationary phase : TLC plate precoated with silica gel F254
Mobile phase : n-hexane: Ethyl acetate (6: 4 v/v)
Chamber saturation time : 15 min
Development time : 20 min
Detection wavelength : 366 nm
Temperature : Ambient
Method validation
Method Validation carried out with respect to the following parameters.
Linearity and range
The standard stock solution 100 ng/µl was applied on HPTLC plate in range of 1 to 10µl with the help of CAMAG 100µL sample syringe, using Linomat 5 sample applicator to obtain final concentration 100-1000 ng/band. Each concentration was applied six times on the HPTLC plate. Peak area was recorded for each concentration and a calibration plot was obtained by plotting peak area against concentration
Limit of Detection and Quantification
The limits of detection (LOD) and quantification (LOQ) were calculated from the slope (s) of the calibration plot and the standard deviation of the response (SD). Precision
Int. J. Pharm. Sci. Drug Res. July-August, 2018, Vol 10, Issue 4 (268-273) Repeatability studies were performed by analysis of
three different concentrations (200, 400 600 ng/spot) of the drug six times on the same day. The intermediate precision of the method was checked by repeating studies on two different days.
Accuracy
To check the accuracy of the method, recovery studies were carried out by over spotting standard drug solution to pre-analyzed sample solution at three different levels 50, 100 and 150%. Basic concentration of sample chosen was 200 ng/band. The areas were noted after development of plate. The drug concentration was calculated by using regression equations.
Specificity
The specificity of the method was ascertained by analyzing standard drug and sample. The spot for FEP in sample was confirmed by comparing the Rf and spectra of the spot with that of standard. The peak purity of FEP was assessed by comparing the spectra at three different levels, i.e. peak start, peak apex and peak end positions of the spot.
Robustness of the method
The robustness of the method was studied, during method development, by small but deliberate variation in mobile phase composition (±2%) chamber saturation period (±10%), development distance (±10%) time from application to development (0, 10,20,30 min) and time from development to scanning (0, 30,60,90 min). One factor at a time was changed at concentration level of 100 ng/band and 200 ng/band, to study the effect on peak area of the drug.
Analysis of marketed formulation
Twenty tablets (Felogard 10 mg) were weighted & average weight calculated, tablets finely powered and the powder equivalent to containing 10 mg of FEP from T-1 and T-2 respectively and dissolved in 10 of methanol, The solution was filtered using Whatman paper No. 41. From the filtrate 1 ml was further diluted to 10 ml with methanol to get sample stock solution of FEP 100 ng/µl. From sample stock solution 2µl volume was applied on HPTLC plate to obtain final concentration of 200 ng/band. After chromatographic development peak areas of the bands were measured at 366 nm and concentration of drug in the sample was estimated from the respective calibration curves. Procedure was repeated six times for the analysis of homogenous sample.
Degradation Studies Acidic condition
For acid decomposition studies, 1 ml of pure drug solution (concentration 1 mg/ml) was mixed with 1 ml of 1 M Methanolic HCl and volume was made up to 10 ml with methanol and solution was refluxed for 2 hours. 10µl volume was applied on TLC plate to obtain the chromatogram.
Alkaline condition
For alkali decomposition studies, 1 ml of pure drug solution (concentration 1 mg/ml) was mixed with 1 ml of 1 M Methanolic NaOH and volume was made up to
10 ml with water and solution was refluxed 2 hours. 10µl volume was applied on TLC plate to obtain the chromatogram.
Neutral conditions
For neutral decomposition studies, 1 ml of pure drug solution (concentration 1 mg/ml) was mixed with 9 ml of AR grade water and solution was kept for 2 hours. 10µl volume was applied on TLC plate to obtain the chromatogram.
Oxidative conditions
For oxidation decomposition studies, 1 ml of pure drug solution (1 mg/ml) was mixed with 1 ml of 30% H2O2,
volume was made up to 10 ml with water and solution was kept for 2 hours. 10µl volume was applied on TLC plate to obtain the chromatogram.
Photolytic conditions
Photo degradation was performed by spreading the drug substance in petri dish as thin film and kept in photo stability chamber equipped with ultraviolet light with energy of not less than 200 Watt hours/Square meter and fluorescence light illumination not less than 1.2 million lux hours. Suitable controls were kept in dark for comparison for the same period. From drug exposed; solution of 1 mg/ml was prepared in methanol and from resulting stock solution 1 ml was further diluted to 10 ml with methanol. 10µl volume of this solution was applied on TLC plate to obtain the chromatogram.
Thermal Degradation
Dry heat studies were performed by keeping drug sample in oven (60°C) for a period of 12 hours. From drug exposed to dry heat condition; solution of 1 mg/ml was prepared in methanol and from resulting stock solution 1 ml of solution was further diluted to 10 ml with methanol. 10µl volume of this solution was applied on TLC plate to obtain the chromatogram. Wet heat studies were also performed by keeping drug solution (1 mg/ml in methanol) in oven (60°C) for a period of 12 hours. After exposure 1 ml of solution was further diluted to 10 ml with methanol. 10µl volume of this solution was applied on TLC plate to obtain the chromatogram.
RESULTS AND DISCUSSION
It was observed that drug showed considerable absorbance at 366 nm as shown in (Figure 2).
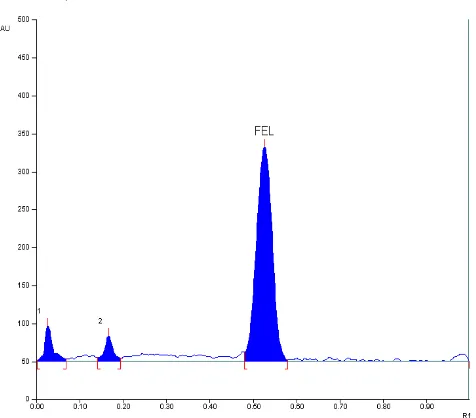
The Rf value of FEL was found to be 0.53 ± 0.027. Densitogram of FEL is shown in (Figure 3).
Each standard in five replicates was analyzed and peak areas were recorded. A calibration curve of FEL was plotted of peak area Vs concentration. The result obtained is shown in Table 1. The linearity was established in the range of 100-1000 ng/band with regression coefficient equation is y = 3.053x + 668.74 (R20.979) calibration curve shown in Figure 4 and
regression analysis of calibration curves shown in Table 2.
Int. J. Pharm. Sci. Drug Res. July-August, 2018, Vol 10, Issue 4 (268-273)
Fig. 2: In situ spectrum of FEL measured from 200 to 400 nm.
Fig. 3: Standard densitogram of FEL (200 ng/band, Rf = 0.53 ± 0.027)
y = 3.053x + 668.74 R2 = 0.9792
0 500 1000 1500 2000 2500 3000 3500 4000
0 200 400 600 800 1000 1200
Concentration (ng/spot)
A
re
a
U
nd
e
r
C
urv
e
Fig. 4: Calibration Curve for FEL
Table 1:Observation Table for Calibration Curve of FEL (n = 5) S. No. Concentration (ng/band) Peak Area*
1 100 786.5
2 200 1266.6
3 400 2097.3
4 600 2616.1
5 800 3152.9
6 1000 3557.4
*Average of 5 determinations
Table 2: Regression Analysis of Calibration Curves
Parameter FEL
Detection Wavelength (nm) 366
Linearity range (ng/band) 100-1000
Correlation Coefficient (r) 0.9792
Linear Regression Equationa (y = mx + c) y = 3.053x + 668.74
Intercept (c) 668.74
Slope (m) 3.053
aWith respect to y = mx + c, where y is the peak area and x is the
concentration (ng/band).
Table 3: Recovery Studies of FEL
Drug taken (ng Amount per band)
Amount added (ng/band)
Total amount (ng/band)
% Recovery*
% RSD*
CA 200 200 100 200 300 400 100.193 101.406 1.851 0.647
200 300 500 100.082 0.944
*Average of three determinations
Table 4: Robustness Data in Terms of % RSD of Retention Time S.
No. Parameters Variation
% RSD* CA
1. Chamber saturation period 10 % 1.09
2. Time from application to development 0, 10, 20, 30 min 0.069
3. Time from development to scanning 0, 30, 60, 90 min 0.055 *Average of three determinations
Table 5: Analysis of Tablet Formulation
Drug Label Claim (mg/tablet) % of Label Claim SD* % RSD*
FEL 10 102.151 4.547 0.044
*Average of six determinations
LOD : 23.54 ng/ band LOQ : 71.33 ng/band
Results of robustness study are presented in Table 4. The proposed method was evaluated by the assay of commercially available tablet formulation contains 10 mg of FEL. The % drug content (Mean ± S.D.) was found to be 102.151±4.547. The results obtained are shown in Table 5.
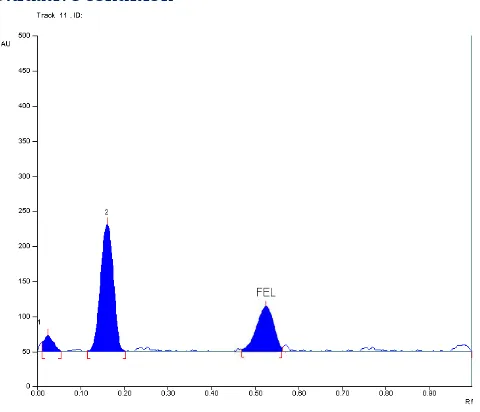
Degradation Studies Acidic condition
Under this condition 2 peaks of degradation products were observed (D1, D2,).
Fig. 5: Chromatogram showing the separation of different degradation products of FEL obtained under acidic condition
Basic Condition
Int. J. Pharm. Sci. Drug Res. July-August, 2018, Vol 10, Issue 4 (268-273)
Fig. 6: Chromatogram showing the separation of different degradation products of FEL obtained under alkaline condition
Neutral Condition
Fig. 7: Chromatogram showing the separation of different degradation products of FEL obtained under neutral condition
Oxidative condition
Fig. 8: Chromatogram showing the separation of different degradation products of FEL obtained under oxidative condition
Photolytic condition
For above conditions one additional peak was observed with % of drug 96.46.
Fig. 9: Chromatogram showing the separation of different degradation products of FEL obtained under Photolytic condition
Thermal condition Dry heat
Drug was found to be stable for above mentioned condition. Drug was found to be stable for above mentioned condition (% of Drug -99.32 for Dry heat/98.87 for wet heat).
Fig. 10: Chromatogram showing the separation of different degradation products of FEL obtained under Dry heat condition
Int. J. Pharm. Sci. Drug Res. July-August, 2018, Vol 10, Issue 4 (268-273)
Table 6: Summary of Degradation Study of Felodipine S.
No. Stress Degradation Condition Percent recovered For FEL (%)
1. Base (1 N NaOH, kept for 2 hours) 76.28
2. Acid (1 N HCl, kept for 2 hours) 86.84
3. Neutral (kept for 2 hours) 94.10
4. H2O2 30% (kept for 2 hours) 83.36
5. meter Florescence , 1.2 million Lux. hours] Photo stability [UV, 200 watt hrs/square 88.59
6. Heat dry (60°C, 12 hours.) 99.32
7. Wet Heat, (60°C, 12 hours.) 98.87
As there are several methods were published in by HPLC & in combination by HPTLC but these methods can’t explain degradation pattern properly as degradation in combination can’t predict that it (Degradation) comes only at right or left side of its Original (Drug) form. Also combination may interfere with each other degradation. While this method give accurate, specific information about stability study of felodipine which will be helpful for further study in pharmaceutical research for study of degradation product in details..
ACKNOWLEDGEMENTS
We are thankful to Principal of Nanded College of Pharmacy to provide a facility for research.
REFERENCES
1. Hansson BG, Lyngstam G, Lyngstam O, Ryddn, L, Thildn, U. Antihypertensive effect of felodipine combined with 13-blockade: a comparison between 2 and 3 daily dosages. Drugs, 1984; 29 suppl. 2: 124-130.
2. Borow KM, Neumann A, Wynne J. Sensitivity of endsystolic Pressure dimension and pressure-volume relations to the inotropic state in humans Circulation. 1982; 65: 988-97. 3. Bostrom SL. Ljung B, Mardh S, Forsen S, Thulin E.
Interaction of the antihypertensive drug felodipine with calmodulin. Nature. 1981; 292: 777-778.
4. Culling W, Ruttley MS, Sheridan DJ. Acute haemodynamic effects of felodipine during beta-blockade in patients with coronary artery disease. Br. Heart J.1984; 52: 431-434. 5. Dillon MJ. Investigation and management of hypertension in
children. Pediatr Nephrol. 1987; 1: 59-68.
6. Fleckenstein A. Specific pharmacology of calcium in myocardium, cardiac pacemakers and vascular smooth muscle. Annu Rev Pharmacol Toxicol. 1977; 17: 1496
7. Cardoza RM. A stability indicating LC method for felodipine. J.Pharm Biomed Anal. 2002; 27:711-718
8. Basvaiah K, Chandrashekar U, Prameela HC. Deterrmination of felopidine in Bulk drug &in tablets by HPLC. Indian Journal of Chemical Technology. 2003; 10: 454-456.
9. Gedil F, Ustun O, Atay O. Quantitative determination of Felodipine in pharmaceuticals by HPLC & UV spectroscopy. Turkish J. Pharm. Sci. 2004;2: 65-76
10. Nataraj S, Kumar K, Suresh S, Duza M, Badrud K. Method validation and estimation of felodipine in pure and capsule dosage form by RP-HPLC. Journal of Pharmacy Research 2011; 4:2822.
11. Annapurna MM, Pavan Kumar BS, Goutam SVS, Stability indicating RP-HPLC method for determination felodipine in tablets. Indo American Journal of Pharmaceutical Research. 2013; 11:9277-85.
12. Dhale C, Joshi S, Shete S. Development & RP- HPLC Method for analysis of Felodipine in bulk and pharmaceuticals. Int. Res. J. Pharm. 2014; 5(10): 770-772.
13. Setti A, Phazna D, Pawar S. Method Development, Validation and stability studies of Felodipine by RP-HPLC and molecular interaction studies of Foledipine and Vpltage Gated L-type calcium channel Int. J Pharm. Sci. Rev Res. 2013;24(3):15-20.
14. Vadlamudi MK, Dhanaraj S. Stability Indicating Method for the determination of related substance in Felodipine solid dosage form and in drug substance by RP-HPLC. J Bioequiv Aavailab. 2016; 8(4):153-166.
15. Zhang N, Yu LJ, Li J, Tong JW, Meng J. Analysis and evaluation of the impurity of felodipine and its tablets. Yao Xue Xue Bao. 2012; 47:223-228.
16. Strode JT, Taylor LT, Howard AL. Analysis of felodipine by packed column supercritical fluid chromatography with electron capture and ultraviolet absorbance detection. J.Pharm Biomed Anal.1994; 12:1003-1014.
17. Renger B, Vegh Z, Fodor F. Valadation of Thin Layer and high performance thin layer chromatographic methods.J. Chromatogr. A. 2011; 1218:2712-2721.
18. Shirode AR, Jadhav BG, Kadam VJ. HPTLC Method Development and Validation of Zolpidem Tartrate in Bulk and Marketed Formulation. Int. J. Pharm. Sci. Drug Res. 2015; 7(2): 193-197.
19. Mohamed AM, Omar MA, Hammad MA, Mohamed AA. Development & validation of TLC-densitomeric method for simultaneous determination of two binary antihypertensive mixtures containing felodipine. Biomedical Chromatography. 2016; 30:200-207.
20. Rao JR. HPTLC method development and validation for simultaneous estimation of Metoprolol succinate and Felodipine in bulk drugs and combined dosage form. Int J Pharma Bio Sci.2018; 9 (2):1-7.
HOW TO CITE THIS ARTICLE:Patre NG, Patil SS. Development and Validation of Stability Indicating Assay Method for Determination of Felodipine in Tablet Dosage Form. Int. J. Pharm. Sci. Drug Res. 2018; 10(4): 268-273.