DECISION SUPPORT SYSTEM FOR ECOSYSTEM SERVICESMARKET BASED ON MULTI
Alexandre Chikalanov
1Department of Computer Science, Faculty of Information Sciences, University for Library Studies and Information
Technologies, 119 Tzarigradskoshosse Bld. , 1784 Sofia, Bulgaria
2Department of Ecology and Environment
Tzankov Bld., 1164 Sofia, Bulgaria
3Initiate of Information and Communication Technologies. Bulgarian A R T I C L E I N F O A B S T R A C T
This of
Multicriteria
Networks have been selected and studied. Based on common theory of that methodologies the authors have developed their own algorithms and software implementation. The implementation results bas
real cases.
of the described approaches as well as the continuous feedback monitoring in the implementation of a specific ecosystem service delivery program, was
INTRODUCTION
The current definition of ecosystem services as " contribution of ecosystem structures and functions, combined with other elements, to human well-being" (Burkhard 2012 ab, 2013, 2017) includes both the contribution of the natural environment and the anthropogenic impacts and human contribution for the welfare of the community. explanation "in combination with other elements" covers changes in nature as a result of human activities
facilities, agricultural crops, agro forestry systems (including forest belts), changes in land use, intensification, etc., which nowadays have reached considerable proportions and lead to a significant change in the natural functions of nature, especially in industry and agriculture. The methodology and classification of ecosystem services were developed in the Millennium Ecosystem Assessment (MEA, 2005) and later publications (de Groot et al. 2002). In MEA, the services forest ecosystems are listed in the following order: food, wood, drinking water, fuel, regulation of water flow, regulation of diseases, carbon sequestration, regulation of local cli medicine, recreation, aesthetics and cultural.
International Journal of Current Advanced Research
ISSN: O: 2319-6475, ISSN: P: 2319-6505,
Available Online at www.journalijcar.org
Volume 8; Issue 11 (B); November 2019
DOI: http://dx.doi.org/10.24327/ijcar.2019
Copyright©2019 Alexandre Chikalanov, Mariyana Lyubenova and Yurii Pavlov
Commons Attribution License, which permits unrestricted use, distribution, and reproduction in any medium, provided the origi cited.
Article History:
Received 06th August, 2019
Received in revised form 14th September, 2019
Accepted 23rd October, 2019 Published online 28th November, 2019
Key words:
Forest ecosystem service, alternative and cost, multi criteria analysis, probability theory, value-based model, Bayesian formula, and artificial neural network
*Corresponding author: Alexandre Chikalanov
Department of Computer Science, Faculty of Information Sciences, University for Library Studies and Information Technologies, 119 Tzarigradskoshosse Bld. , 1784 Sofia, Bulgaria
DECISION SUPPORT SYSTEM FOR ECOSYSTEM SERVICESMARKET BASED ON MULTI
APPROACH APPLICATION
Alexandre Chikalanov1, Mariyana Lyubenova1 and Yurii Pavlov3
Department of Computer Science, Faculty of Information Sciences, University for Library Studies and Information Technologies, 119 Tzarigradskoshosse Bld. , 1784 Sofia, Bulgaria
Department of Ecology and Environment Protection, Faculty of Biology, St. Kl. Ohridski University of Sofia 8 Dragan Tzankov Bld., 1164 Sofia, Bulgaria
Initiate of Information and Communication Technologies. Bulgarian Academy of Science, Sofia, Bulgaria A R T I C L E I N F O A B S T R A C T
Thispublicationdeals with creation of DSS forecosystem
oftheoretical methodologies have beenexplored.Threeof them as
Multicriteria Analyses based on fuzzy logic, Value based Model, and Artificial Neural Networks have been selected and studied. Based on common theory of that methodologies the authors have developed their own algorithms and software implementation. The implementation results based on the theory of applied methodologies were
real cases. Hereby, an ecosystem services management paradigm, based on the use of each of the described approaches as well as the continuous feedback monitoring in the implementation of a specific ecosystem service delivery program, was
The current definition of ecosystem services as "The contribution of ecosystem structures and functions, combined being" (Burkhard et al. 2012 ab, 2013, 2017) includes both the contribution of the natural environment and the anthropogenic impacts and human community. The explanation "in combination with other elements" covers of human activities - engineering forestry systems (including forest belts), changes in land use, intensification, etc., which nowadays have reached considerable proportions and lead to a ral functions of nature, especially The methodology and classification of ecosystem services were developed in the Millennium Ecosystem Assessment (MEA, 2005) and later . 2002). In MEA, the services of forest ecosystems are listed in the following order: food, wood, ter flow, regulation of diseases, carbon sequestration, regulation of local climate,
The classification of ecosystem services
changes over timedepending on the objects and objectives of the inventory.
According to the typology proposed by Kandziora (2013), ecosystem services are grouped into 4 groups: regulating, provisioning, cultural and
the United States Environmental Protection Agency (US EPA), forest ecosystem services are subdivided into the following groups: environmental (including mainly forest regulatory and support functions); economic (mainly
and services); sociocultural (the forest as
people, the strong cultural and spiritual attachment of the people to the forests), as well as the value of the forest as a picturesque landscape (a range of services related to the ideas of aesthetics and beauty for the inhabitants,
ecotourism functions, etc.). An EU
classification (CICES) has been published on the website of the European Environment Agency. Human society's dependence on ecosystem services, incl
resources, is steadily growing, while practices for managing and using these services and resources are leading to environmental degradation, and loss of
biodiversity (Leon and de Groot 2012).
Services is a well-defined and sufficiently active
International Journal of Current Advanced Research
6505, Impact Factor: 6.614
www.journalijcar.org
November 2019; Page No.20443-20448
//dx.doi.org/10.24327/ijcar.2019.20448.3994
ana Lyubenova and Yurii Pavlov. This is an open access article distributed under the Creative Commons Attribution License, which permits unrestricted use, distribution, and reproduction in any medium, provided the origi
Alexandre Chikalanov
Department of Computer Science, Faculty of Information Sciences, University for Library Studies and Information Technologies, 119 Tzarigradskoshosse Bld. , 1784 Sofia,
DECISION SUPPORT SYSTEM FOR ECOSYSTEM SERVICESMARKET BASED ON MULTI -
3
Department of Computer Science, Faculty of Information Sciences, University for Library Studies and Information
Protection, Faculty of Biology, St. Kl. Ohridski University of Sofia 8 Dragan
Academy of Science, Sofia, Bulgaria
services (ES). A number of them as application of , Value based Model, and Artificial Neural Networks have been selected and studied. Based on common theory of that methodologies the authors have developed their own algorithms and software implementation. The methodologies were illustrated with an ecosystem services management paradigm, based on the use of each of the described approaches as well as the continuous feedback monitoring in the implementation of a specific ecosystem service delivery program, was demonstrated.
The classification of ecosystem services is not uniform and changes over timedepending on the objects and objectives of
According to the typology proposed by Kandziora et al. (2013), ecosystem services are grouped into 4 groups: , cultural and supporting.According to the United States Environmental Protection Agency (US EPA), forest ecosystem services are subdivided into the following groups: environmental (including mainly forest regulatory and support functions); economic (mainly provisioning benefits nd services); sociocultural (the forest as a home of millions of people, the strong cultural and spiritual attachment of the people to the forests), as well as the value of the forest as a picturesque landscape (a range of services related to the ideas aesthetics and beauty for the inhabitants, based on which An EU-wide up-to-date classification (CICES) has been published on the website of the European Environment Agency. Human society's dependence on ecosystem services, including natural resources, is steadily growing, while practices for managing and using these services and resources are leading to and loss of ecosystems and biodiversity (Leon and de Groot 2012). Today Ecosystem defined and sufficiently active
Research Article
Decision Support System for Ecosystem Services Market Based on Multi - Approach Application
20444
interdisciplinary scientific field that maintains its organizations, platforms and specialized journals. There are an extremely large number of organizations at national and international level that are relevant to environmental, economic or social aspects of biodiversity and ecosystem services. E.g. the worldwide network - Ecosystem Services Partnership (ESP, 2009; https://www.es-partnership.org/) with 48 environmental organizations, universities, companies, etc .; The European Commission adopting “A strategy for Biodiversiry 2020” (2011) and setting up a special Working Group on Mapping and Assessment on Ecosystems and their Services (MAES, 2012; https://biodiversity.europa.eu/maes); Rio+20 outlines the vision for a “Green Economy (UN, 2012)”, which recognizes that economic performance depends on the effective management of ecosystems and biodiversity and on the sustainability of ecosystem services; The International Finance Corporation (IFC, 2012, UN), which publishes revised “Performance Standards” on environmental and social sustainability; Economics of Ecosystems and Biodiversity - TEEB2 (http://www.teebweb.org/about/the-initiative/), developing concepts and methodology for the evaluation and evaluation of ecosystem services. The Intergovernmental Platform on Biodiversity and Ecosystem Services (IPBES, 2012; https://www.ipbes.net/) provides mechanisms for assessing, integrating and analyzing knowledge and information that are consistent with both the scientific community and management structures. Open NESS and OPERA (Seventh Framework Program, 2015) and ESMERALDA (http://www.esmeralda-project.eu/) have contributed to the development of the concept and methodologies for ecosystem services evaluation and valuation. Assessments of the state of bioresources and ecosystem services are essential to support decision-making. However, adequate assessment requires both an integrated approach and the development of applications to support decisions regarding the use of the provided services (Maes et al. 2012, Lyubenova et al. 2015 ab, Lyubenova et al. 2016, Chikalanov et al. 2016, 2019 and others.). Such decision-making process can determine which set of services is most valued and achieves system sustainability. In a narrow sense, the sustainability of the production of an ecosystem service can only relate to whether the biological potential of the ecosystem can sustain the same yield of that service. Combining new technologies from the digital age can facilitate the creation of effective and sustainable resource management by developing a program for choosing and facilitating the right decisions.In-depth analysis of existing DSS has been made byBagstad et al. (2013) The authors have conducted research and implemented DSS software in the three main areas Multicriteria Analyses based on fuzzy logic, Value based Modeland Artificial Neural Networks.METHODS
As a result of research on existing DSS, three approaches for developing DSShavebeen selected asApplication of multi-criterion analysis based on fuzzy sets, use of expertise and application of artificial neural networks. The use of multi-criterion analysis based on fuzzy sets is convenient in cases, where a finite number of alternatives evaluated by several criteria are known. The developedapproach wasbased onPeneva and Pochev (2006, 2007) and algorithm was implemented in JAVA.
In many cases the application of modeling based on expert knowledge is s an applicable approach for building decision-making systems (Bagstad et al. 2013, Pavlov and Andreev 2013). The Value Based Model (VBM) provides such an opportunity. The appliedapproach was based on stochastic programming and the Utility theory (Keeney and Raiffa 1999). The Utility theory basically deals with the expressed subjective preferences. Possible criteria for "the meaning of best" can be an expert (decision maker -DM) utility function (Pavlov and Andreev 2013). The developed model was implemented in MATLAB.
The methodology for data processing by means of Artificial Neural Networking based on estimated time series was applied.
RESULTS AND DISCUSSION
Application of multicriteria analyses based on fuzzy logic (MA)
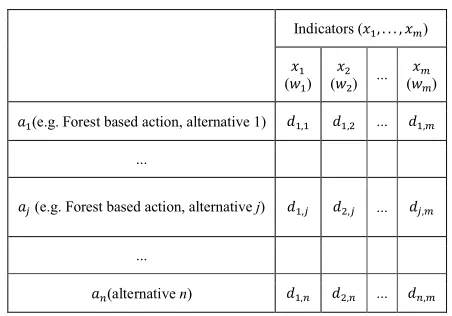
Let’s assume that we have a set of n forest-based solutions, each one with different impact on forest ecosystem and different total cost. The decision maker’s objective is to select the most cost-effective solution to improve the forest ecosystem services within this set of alternatives, which will be the one with the lowest total cost effectiveness ratio. We assume that ecosystem performance can be defined by a set of m key performance indicators, ∈ = { , … }. For each indicator the decision makers (based on scientific evidence) have defined some minimum quality thresholds denoted by . Also, the indicators may have different measurement units. We also assume that the alternatives ∈ =
{ , … }share the same project duration and their discounted
total costs? each indicator denoted with , {i = 1 … n} are known (Tabl. 1). We define the cost effectiveness ratio as: (1) =
For each indicator is given a weight ≥ 0 and ∑ = 1
Table 1 Decision table with rows alternatives and indicators
Indicators ( , . . . , )
( ) ( ) ... ( )
(e.g. Forest based action, alternative 1) , , ... ,
...
(e.g. Forest based action, alternative j) , , ... ,
...
(alternative n) , , ... ,
Since the measurements of the indicators can be in different units, a procedure to unify them, by transforming the values of each of the criteria into fuzzy relationships is applied.
For each column of the table, the corresponding fuzzy relation is obtained, i.e., for the k numbersof indicators, the corresponding matrix-like relation appears
All relations are merged to obtain an aggregate relation with the following matrix:
Each element of this matrix is calculated using the formulas for aggregating operators with weights ( , … ,
following operators are used?, such as values of are taken from (5).
(5) ( , ) = ∑ , ,
or
(6) ( , ) = ∏ [ ( , )]
Two aggregate matrices of the type R, are obtained. Each of these matrices is recalculated to obtain a matrix follows:
if μ( , ) ≥ μ( , ), then ( , ) = μ ( , ) = 0.
In any of the matrices obtainedthe alternative with onlywithnon-zero values is chosen as optimal.
Application of Value based Model (VBM)
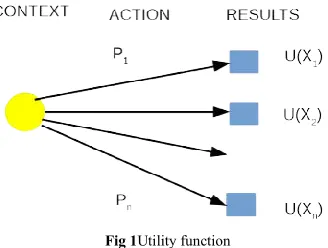
In many cases it is useful to apply a modeling based on expert knowledge. VBM provides such an opportunity. presented approach is based on stochastic programming and the Utility theory [Keeney and Raiffa 1999]. The Utility theory basically deals with the expressed subjective preferences. Possible criteria for "the meaning of best" can be an expert (decision maker -DM) utility function (Pavlov and Andreev 2013). Standard description of the utility function application LS presented by Figure (1).
Fig 1Utility function
There are a variety of final results that are a consequence of the experts’ or DM’s choice and activities. This activity is motivated by a DM (Decision maker’s) objective which For each column of the table, the corresponding fuzzy relation is obtained, i.e., for the k numbersof indicators, the
are merged to obtain an aggregate relation R
Each element of this matrix is calculated using the formulas , … , ). The following operators are used?, such as values of ( , )
are obtained.
Each of these matrices is recalculated to obtain a matrix ′ as
μ( , ) and
with
In many cases it is useful to apply a modeling based on expert knowledge. VBM provides such an opportunity. The approach is based on stochastic programming and ]. The Utility theory basically deals with the expressed subjective preferences. Possible criteria for "the meaning of best" can be an expert Pavlov and Andreev Standard description of the utility function application
There are a variety of final results that are a consequence of s choice and activities. This activity is motivated by a DM (Decision maker’s) objective which
possibly includes economic, social, ecological or other important process characteristics. A multi attribute utility function ( )assesses each of the final
The DM judgment is based on the DM choice and is measured quantitatively (discrete set of final results in this case) by the following formula (Fishbarn1970)
(7) ( ) = ∑ ( ) , p = ( , …
Further, we will present a use case of applying VBM for forest management. The problem being considered in a dialogue with the DM or expert, defines the following main objective of investigation: to develop a value based model (VHM) for integrated assessment of economic, ecological and social forest ecosystem services, which could be applied for monitoring and ecological management of forest areas and allow the sustainable development of business and use of forest resources. Modeling of such complex system
ecosystem is a difficult task, especially if one needs the functions to be regulated and subordinated to the multifaceted sustainable use. For the modeling purposes we accept three indicators (sub-objectives or factors) adequately describing main objective of the investigation: X1
1
) as representing criteria for the assessment of effects or provisioning services; X2 –
representing criteria for the assessment of ecological effect or regulating and supporting services and
population employed in the forestry sector and representing criteria for the assessment of social effect or services. The model is developed as multy-attributes utility function with the three factors mentioned. The coefficients of function were calculated using the preferences? of ecology and environmental professionals. The expert analysis and earned structuring led to accepting the following sub
the appropriate criteria, which adequately describe the main objective and are real, physically measured quantities. We determine the domain of variation of representing criteria as follows:
X1- factor (provisioning services as per hectare - economic effect) [10
X2 - factor (regulating and supporting services ecological effect) [1 - 200 number of species per hectare]:
X3- factor (percentage of employed meals in the forestry sector - social effect) [1
Graphically the structure of the main DM’s objective has the form shown in Fig. 2.
Fig 2 Main objective and three subobjectives
The preferences of DM for at different values of do not change, suggesting independence of
changes of the other two factors. This means that whatever the reserves of wood are and the difference of richness of the species in the forest ecosystem, in any case, the preferences are aligned with the increasing of number of workers in the possibly includes economic, social, ecological or other important process characteristics. A multi attribute utility assesses each of the final results ( , i=l, … ,n). DM choice and is measured quantitatively (discrete set of final results in this case) by the
), ∑ = 1.
Further, we will present a use case of applying VBM for forest management. The problem being considered in a dialogue with the DM or expert, defines the following main objective of investigation: to develop a value based model (VHM) for nt of economic, ecological and social forest ecosystem services, which could be applied for monitoring and ecological management of forest areas and allow the sustainable development of business and use of forest resources. Modeling of such complex system as the forest ecosystem is a difficult task, especially if one needs the functions to be regulated and subordinated to the multifaceted sustainable use. For the modeling purposes we accept three objectives or factors) adequately describing the X1 - timber reserve: (m3.ha -) as representing criteria for the assessment of economic
species richness, (n. ha-1) representing criteria for the assessment of ecological effect or regulating and supporting services and X3 percentage of population employed in the forestry sector and representing criteria for the assessment of social effect or services. The attributes utility function with the three factors mentioned. The coefficients of function were calculated using the preferences? of ecology and environmental professionals. The expert analysis and earned ollowing sub-objectives and the appropriate criteria, which adequately describe the main objective and are real, physically measured quantities. We determine the domain of variation of representing criteria as
factor (provisioning services as volume of timber economic effect) [10 - 300 nrlha'1]: factor (regulating and supporting services -
200 number of species per
factor (percentage of employed meals in the ct) [1 - 30 %].
Graphically the structure of the main DM’s objective has the
Main objective and three subobjectives
Decision Support System for Ecosystem Services Market Based on Multi - Approach Application
forestry sector. At low timber reserves and a poor species composition the increasing of employment in forest sector is motivated by the need of reforestation, regeneration, cultivation of existing forests, optimization of forest-related natural resources, development of alternative uses and others. At high timber reserves and rich species composition, the increasing of employment is motivated by the opportunities of multifaceted use of forests and the need of environmental management and balanced utilization of forest resources. Using the theory for decomposition of multi attribute utility applied to simpler functions given in (Keeney, 1999) we determine the following multi attribute utility structure:
(8) ( ) = 1 ( , , ) + ( ) ( , , ) +
( ) ( , , , ) +
+ ( ) ( , , ) ( , , , ), where ( , , )
= 0 and ( ∗, ∗, ∗)=1.
In the formula above = ( , , ) = (10, 1, 1) and
∗= ( ∗, ∗, ∗) = (300,200,30).
The functions , and have forms
( ) = ( , ∗, ) - ( , , )
( ) = ( , , ∗) - ( , , )
( ) = ( , ∗, ∗) - ( , , ∗)
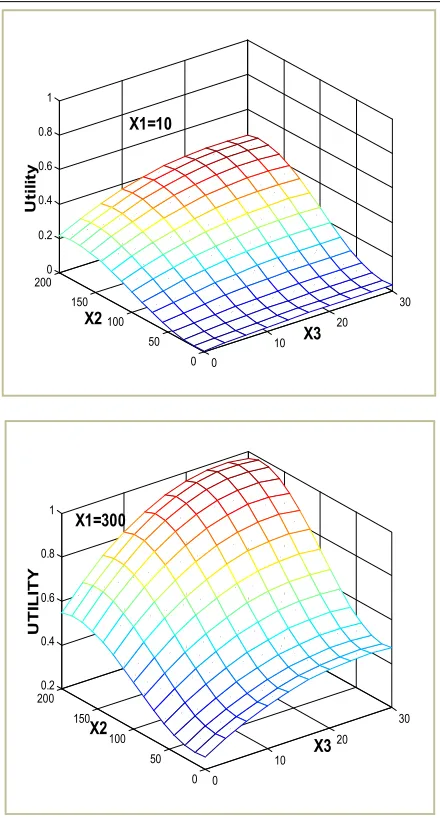
Each of these six functions was evaluated based on the DM’s preferences. For example, the function ( , , ) has the form presented on Fig. (3).
The blue see sow? line is pattern recognition of the positive or the negative DM’s preferences. The solid line is evaluated Utility function polynomial approximation ( , , ). Fig. 4 shows a comparison between the evaluated Utility function
(10, , ) and the evaluated Utility function (10, , )
Fig 3 Graphical representation of utility function u(X , X , X )
Some results from simulations are presented on Table. 2
Table 2 Similar utility resulted from the simulations
Utility X1 X2 X3 Utility X1 X2 X3
0.0 10 50 1 70 200 7
10 1 30 150 200 1
70 1 1 300 50 7
01.-0.2 10 11 15 0.5-0.6 10 200 30
10 50 7 300 200 1
10 200 1 150 100
10 70 1 0.7-1.0 300 200 30
0.3-0.4 10 100 300 300 100 15
10 20 7 150 200 15
Fig 4 Comparisin between Utility functions u(10, X , X ) and u(10, X , X )
Application of Artificial Neural Networks
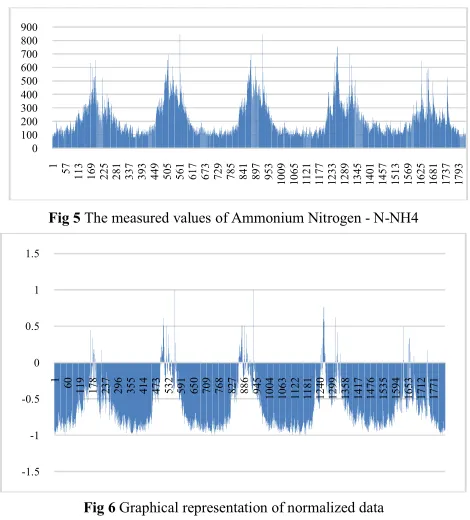
In the summary below, we will illustrate the ANN created by means of a specific example.In this article, a studyhas been conducted on the expected level of pollution of the Danube with the substance Ammonium Nitrogen - N-NH4. Data on the measured levels of pollution the river are 1827 observations in total and are reported at regular intervals every 24 hours.Тhe created application generates a probabilistic model based on Estimated Time Series through the capabilities of the Artificial Neural Network.It generates a probabilistic model through training based on supplied historical data. The input data in the particular case presented is normalized, in the nterval -1 +1. The normalization takes into account the smallest and largest values in the time line.The normalzation formula is:
RS = ( − SMin)
(SMax − SMin) ∗ (RawMax − RawMin) + Raw
Where RS is the rescaled sampling, SMin is scaled minimum, SMax is scaled maximum, RawMax is maximum raw value, RawMin is minimum raw value and Raw is measured raw value. The normalized set of time series data is conditionally divided into two subsets - a window of past data (Lag frame) and a window of data for future period (Lead frame). The training of the Neural Network and the level of error it
0
10 20
30
0 50 100 150 200
0 0.2 0.4 0.6 0.8 1
X3 X2
U
til
it
y
X1=10
0 10
20 30
0 50 100 150 200
0.2 0.4 0.6 0.8 1
X3 X2
U
TI
LI
TY
20447
generats togeter with the weights submitted is reported at regular intervals.On Fig. is presented the measured values and on Fig, are presented the normalized valus.Fig 5 The measured values of Ammonium Nitrogen - N-NH4
Fig 6 Graphical representation of normalized data
Figure 6 presents the learning outcomes of the Neural Network with the normalized data set submitted, and the error in the course of its training is traced. Its average value is 0.05. An array of four values is fed to the trained Neural Network(lag), which are 0.958360274, 0.943100996, 0.928876245 -0.93249709, and the neural network must generate a probability model for the next two values(lead), which ar 0.895771369 и -0.92680719. The estimate the neural network gives for these two valuesis е – 0,9557624 и -0.9557024. After recalculation the obtained values are 88.827676 и 88.804483.
Fig7 Results obtained from network training
The three proposed methodologies are implemented as components of the author-developed ecosystem services management system presented in Figs.. 8.
Fig 8 Schematic representation of adaptive ecosystem services management
CONCLUSION
The publication presents implementationс of three methodologies in the process of managing ecosystem services. The authors propose a cyclical process. Еachcycleconsists of two main stages – preparation phase and ecosystem service implementation phase. The activities carried out in the first stage are: evaluation of the results of the previous cycle, use of neural networks to predict the values of key indicators, simulations based on MA and VDM and decision-making. Next stage is the stage of implementation of the decisions taken. This stage, in turn, is divided into a series of iterations. At the beginning of each iteration, the feedback from the implementation of the solutions is analyzed by analyzing the changes in the ecosystem service provision. If there is a need for change in the decisions, the simulation is performed again on the basis of the new information accumulated, and then corrective decisions are made (Fig. 8). The approach proposed is innovative and unique, as it involves the consistent use of the methodologies described above, and also allows for flexible management by continuously monitoring feedback data and performing simulations to support operational and adequate decisions.
The future development of developedalgorithms will be related to their import into the high performance Apache Spark and Apache Hadoo environments. This will allow for various simulations with thousands of conditions.
Acknowledgements
The research relates to COST Action Payments for Ecosystem Services (Forests for Water), 2016-2020 and the project DCOST1/30/20.12.2017 “Development of a scheme for assessment of forest ecosystem services, efficiency of their provision through the creation of belts for the purpose of purification and protection of waters and other natural components in the regions” funded by the Research Fund, Bulgaria.
References
Assenov, A., Chikalanov, A., Lyubenova, M. and Kostadinova, S. 2017. Ecosystem Services: A Function of Natural Capital Contemporary Studies in Environment and Tourism Edited by Recep Efeand MünirÖztürk Cambridge Scholars Publishing ISBN (13): 978-1-4438-7283-6 p 43 - 60
Bagstad, K., Semmens, D., Waage, S., Winthrop R.2013.A comparative assessment of decision supporttools for ecosystem services quantification and valuation. Ecosystem Services 5 (2013) e27–e39
Burkhard, B., Kroll, F., Nedkov, S., Muller, F., 2012. Mapping ecosystem services supply, demand and budgets. Ecological Indicators 21, 17–29.
Burkhard, B., De Groot, R., Costanza, R., Seppelt, R., Jorgensen, S.E., & Potschin, M. 2012b.
Solutions for sustaining natural capital and ecosystem services. EcologicalIndicators, 21, 1-6.
Burkhard, B., Crossman, N., Nedkov, S., Petz, K., & Alkemade, R. 2013. Mapping and modeling ecosystem services for science, policy and practice. Ecosystem Services, 4, 1-3.
Burkhard B, Maes J (Eds.). 2017. Mapping Ecosystem Services. PensoftPublishers, Sofia, 374 p.
0 100 200 300 400 500 600 700 800 900
1 57
1
13 169 225 281 337 393 449 505 561 617 673 729 785 841 897 953
1
0
09
1
0
65
1
1
21
1
1
77
1
2
33
1
2
89
1
3
45
1
4
01
1
4
57
1
5
13
1
5
69
1
6
25
1
6
81
1
7
37
1
7
93
-1.5 -1 -0.5 0 0.5 1 1.5
1 60
1
19
1
78
2
37
2
96
3
55
4
14
4
73
5
32
5
91
6
50
7
09
7
68
8
27
8
86
9
45
Decision Support System for Ecosystem Services Market Based on Multi - Approach Application
20448
Chikalanov, A., Lyubenova, M. and Nikolov, R. 2016.Future of Internet, Ecosystem Services and Sustainable Regional Development. Athens: ATINER'S Conference Paper Series, No: ECL2016-2135.
Chikalanov, C., M. Lyubenova, S. Peteva, Y. Petkov, Iliana Todorova. 2019. Costeffectiveness assessment of forest ecosystem services for water bodies protection.- In: Kaliterna L.,LipovËan, O. Ramljak (Eds.). REFLECTIONS ON THE MEDITERRANEAN, Mediterranean Issues, Book 2, 481-492. ISBN 978-953-7964-77-1; 978-953-8101-04-5; National and university Library in Zagreb- CIP 001034095
de Groot, R. S., Wilson, M., &Boumans, R. 2002. A typology for the classification, description and valuation of ecosystem functions, goods and services. Ecological Economics, 41(3), 398-408.
Fishbarn. P 1970. Utility Theory for Decision-Making. New York. Wiley
Kandziora, M., Burkhard B., Muller F. 2013. Mapping provisioning ecosystem services at the localscale using data of varyingspatial and temporalresolution. Ecosystem Services 4, 47-59.Keeney. R. Ji H. Raiffa 1999 Decision with Multiple Objectives. Preferoces and Value Tradeoff (2nded). Cambridge Ji: New York: Cambridge Umversiiy Press.
Leon, C., R. de Groot. 2012. The ecosystem services agenda: bringing the worlds of natural science and economics, conservation and development, and private policy. Ecosystem Services 1, 4-15.
Lyubenova, M., Y. Pavlov, A. Chikalanov, K. Spassov, G. Novakova, R. Nikolov. 2015a. Smart Forest Ecological Management System. Journal of BalkanEcology. Vol. 18, b. 4, 363-374.
Lyubenova, M., Y. Pavlov, A. Chikalanov, K. Spassov. 2015b. A Decision Making Support Model for a Smart Forest Ecological Management System. – In: Proceedings International Conference “Big Data, Knowledge and Control Systems Engineering - BdKCSE'2015”, 5-6 November 2015, Sofia, 119-131.
http://conference.ott-iict.bas.bg/wp-content/uploads/2015/12/BdKCSE2015_Proseedings1.p df
Lyubenova, M., S. Peteva. 2016. Management and Services of Forest Ecosystem: Benefits, payment and values. Journal of BalkanEcology, 19 (1), 35-49.
Maes, J., B. Egoha, L. Willemena, C. Liquetea, P. Vihervaarab, J. Philipp, S. Agnera, B. Grizzettic, E. G. Drakoua, A. La Nottea, G. Zuliana, F. Bouraouia, M. Luisa Paracchinia, L. Braatd, G. Bidoglioa. 2012. Mapping ecosystem services for policy support and decision making in the European Union. Ecosystem Services 1, 31–39. Open access under CC BY-NC-ND Pavlov, Y., R Andreev 2013. Decision control, management.
and support in adaptive and complex systems: Quanutauve models. Hersliey. PA: IGI Global
Peneva, V., Popchev, I.2007Aggregation of fuzzy relations with fuzzy weighted coefficients Advanced Studies in Contemporary Mathematics (Kyungshang) 15(15):121-132 · August 2007
Peneva, V., Popchev, I.2006Aggregation of fuzzy preference relations with different importance. Comptesrendus de l'Académiebulgare des sciences: sciences mathématiques et naturelles · January 2006
Raiffa, H. 1968. Decision Analysis. Introductory Lectures on Choices under Uncertainty Addison- Wesley.
How to cite this article:
Alexandre Chikalanov, Mariyana Lyubenova and Yurii Pavlov (2019) 'Decision Support System for Ecosystem Services Market Based on Multi - Approach Application', International Journal of Current Advanced Research, 08(10), pp. 20443-20448. DOI: http://dx.doi.org/10.24327/ijcar.2019.20443-20448.3994