Abstract—Regional integration development reinforces the influence and communication among intraregional cities. Meanwhile, big cities gradually turned to metropolitanization. In the dual transition situation of regions and cities, urban integration, called as Tongchenghua in Chinese, has become a kind of urban functional area in the last decade. There are subtle differences from commonly known urban conurbation; urban integration is initiated in China, and its practices precede the theories. Therefore, lacking of advanced theoretical guidance of both developed western countries and native academia provides a huge boost in the study on urban integration. The research applies diachronic and synchronic analysis on 13 whole samples and 4 sub-samples, based on socioeconomy data and satellite imagery. Firstly, the research defines the point-in-time of urban integration, by analyzing historical data of socioeconomy and satellite imagery. Secondly, it identifies the special characteristics of urban integration, by comparing the satellite imagery of all the urban integration areas synchronously. Finally, the research proposes 2 results. It names three points-in-time during the process of urban integration: the germinate point, the start point, and the grow point. And, according to the characteristics of spatial pattern, it names 3 types: concentrated-spread, multi-group fragmentation, and halfway-point growth. The research can promote the development of urban-rural regional structure theories, and guide the development and construction of practices of urban integration. Furthermore, it’s aimed at constructing the first theory of regional development initiated in China, and setting the benchmark on the regional coordinated development for developing countries.
Index Terms—Urban integration, point-in-time, spatial structure, mechanical effect, socioeconomy, satellite imagery.
I. INTRODUCTION
The emergence of urban integration (known as tongchenghua in Chinese) marked the new creation of urban functional areas in China [1]-[3], in the situation of dual transformation of region and big cities [4]. However, urban integration is neither a brutal inter-government merger nor a simple adjoining urban combination, it breaks the boundaries between traditional administrative divisions and protectionism among cities, leaving elements and resources free among these cities or in the region [5]-[7]. Free flows and the optimization of allocations enable the economic and social integration of two or more cities to form an overall effect of complementary advantages and common prosperity and development [3], [8]. On the one hand, strategies can promote cooperation among cities and achieve resource sharing, thus improving urban competitiveness [9]. On the
Manuscript received December 9, 2018; revised May 23, 2019. Pei Chen and Ya-Ping Huang is with the Huazhong University of Science and Technology, China (e-mail: [email protected], [email protected]).
other hand, it’s an innovative governance method to adjust the failure of inter-government merger. However, the existing regional and urban spatial parsing theories lack pertinence for urban integration [10]-[14]. Compared with the spatial formation mechanism of individual cities, urban integration is significantly more complex; Compared to the spatial formation mechanism of urban agglomerations, the more compact relationship between cities brings different influence factors and mechanism of spatial organization.
For the first time, urban integration as a regional development strategy and development target has officially appeared in the government planning document. It is Shenzhen 2030 Urban Development Strategy, released in 2006, which proposes to create the urban integration development between Shenzhen and Hong Kong [15]. The academia has undergone two stages of conceptual understanding of urban integration. In the early period, it focused on the hardware-level measures such as spatial collaboration and facility sharing [16]-[19]; at present, it has expanded to the software-level requirements as policy interoperability and cultural identity, advocating the same social feelings as living in the same city [20]-[22]. To synthesize the definition proposed by different scholars from different perspectives, there’re several basic features: regional proximity, industrial complementarity, economic connectivity, and regional identity [16], [19], [23]-[26].
Urban integration is the gradual dilution and ambiguity of administrative boundaries between adjacent cities, while urban infrastructure and service functions are shared by more cities. Regional exchanges are more frequent and resource elements are allocated to achieve industrial positioning, reaching a high degree of coordination and unity in various aspects such as industry orientation, factor flow, urban development, ecological environment, policy measures, social undertakings, etc., weakening residents' original concept of possession and sharing the development achievements.
II.METHODOLOGY
A. Research Samples
Research samples are the urban integration areas that have emerged in China, with a total of 13. According to different research purposes, it can be divided into whole sample and sub-sample: the whole sample is the above mentioned 13 areas; the sub-samples are 4 typical samples extracted according to the economic development stage and geographic location.
The 13 whole sample includes: Changsha Zhuzhou-Xiangtan, Xi’an-Xianyang, Guangzhou-Foshan, Wulumuqi-Changji, Zhengzhou-Kaifeng, Shenzhen-Hong
Research on the Point-in-Time and Spatial Structure of
Urban Integration in China
Pei Chen and Ya-Ping Huang
Kong, Shenyang-Fushun, Taiyuan-Jincheng, Nanjing-Zhenjiang-Yangzhou, Shenzhen-Huizhou, Xiamen-Zhangzhou-Quanzhou, Wuhan-Ezhou, and Chengdu-Deyang. The 4 sub-sample includes: Guangzhou-Foshan, Changsha-Zhuzhou-Xiangtan, Xi’an-Xianyang and Shenyang-Fushun.
Firstly, division of economic development stage is based on Chenery Industrialization Stage Theory (Table I). According to the analysis: 4 samples at stage of post-industrialization, Guangzhou-Foshan, Shenzhen-Hong Kong, Nanjing-Zhenjiang-Yangzhou, Shenzhen-Huizhou; 5 samples at stage of late industrialization, Changsha-Zhuzhou-Xiangtan,Xiamen-Zhangzhou-Quanzho u,Wuhan-Ezhou,Chengdu-Deyang,Wulumuqi-Changji; 4 samples at stage of mid-industrialization, Xi’an-Xianyang, Zhengzhou-Kaifeng, Shenyang-Fushun, Tai-yuan-Jincheng (Table II).
TABLEI:CHENERY INDUSTRIALIZATION STAGE
Pre-industria lization
Early industrializa tion
Mid-indust rialization
Late industrializa tion
Post-indus trialization
GDP per capita(USD in 2015)
781-1562 1562-3125 3125-8250 8250-13718 >13718
Industrial structures1 A>I
A>20%, A <I
A<20%, I >S
A<10%, I >S
A<10%, I <S Industrial
added value to GDP ratio
<15% 15-30% 30-45% 45-60% >60%
Contents come from related references.
TABLEII:CHENERY INDUSTRIALIZATION STAGE
Urban integration
areas City
GDP per capita (USD in 2015)
Industrial structures
Industri al added value to GDP ratio(% )
Industriali zation stage2
Changsha-Zhuzho u-Xiangtan
Changsha 18536 4.0:52.6:43.4 44.0 L
L Zhuzhou 9371 7.6:57.3:35.1 50.6 L
Xiangtan 9702 8.3:54.8:36.9 50.0 L
Xi’an-Xianyang
Xi’an 10716 3.8:37.3:58.9 27.1 M M Xianyang 6973 15.3:57.5:27.2 48.1 M
Guangzhou-Fosha n
Guangzhou 21526 0.4:29.0:70.6 30.0 P P
Foshan 17295 1.7:60.5:37.8 58.4 L
Wulumuqi-Changj i
Wulumuqi 11882 1.2:29.4:69.4 21.9 P L Changji 12682 10.2:51.2:38.6 26.6 M
Zhengzhou-Kaife ng
Zhengzhou 12398 2.1:49.6:48.4 43.6 L M Kaifeng 5672 17.8:41.0:41.2 37.0 M
Shenzhen-HongK ong
Shenzhen 25365 0:41.2:58.8 38.8 P P
HongKong 42337 0:7.4:92.6 1.2 P
1 A, I, S successively stands for agriculture, industry, and service. 2 Pr, E, M, L, P successively stands for pre-industrialization, early industrialization, mid- industrialization, late industrialization, and post- industrialization.
Shenyang-Fushun
Shenyang 14103 4.7:48.1:47.2 36.0 M M
Fushun 9402 8.0:48.9:43.1 38.2 M
Taiyuan-Jincheng
Taiyuan 10195 1.4:37.3:61.3 22.0 L M Jincheng 4985 10.2:43.7:46.1 36.3 M
Nanjing-Zhenjian g-Yangzhou
Nanjing 18973 2.4:40.3:57.3 34.9 P
P Zhenjiang 17720 3.8:49.3:46.9 48.5 L
Yangzhou 14394 6.0:50.1:43.9 23.5 L
Shenzhen-Huizho u
Shenzhen 25365 0:41.2:58.8 38.8 P P Huizhou 10634 4.8:55.0:40.2 50.6 L
Xiamen-Zhangzho u-Quanzhou
Xiamen 14514 0.7:43.5:55.8 36.2 P
L Zhangzhou 8923 13.4:48.5:38.1 40.4 M
Quanzhou 11628 2.9:61.0:36.1 54.5 L
Wuhan-Ezhou
Wuhan 16720 3.3:45.7:51.0 37.4 P
L Ezhou 11066 11.6:57.9:30.5 52.5 L
Chengdu-Deyang
Chengdu 11926 3.5:43.7:52.8 37.6 L L
Deyang 7336 13.0:58.6:28.4 55.3 M
Contents come from related statistics yearbooks, statistics annual bulletin and governments’ official websites.
Secondly, geographic location division is officially based on the China's geographical regions, which according to differences in nature and human geography. China are divided into four major regions, the northern region, the southern region, the northwest region, and the Qinghai-Tibet region, three demarcation lines are Daxinganling-Yinshan-Helanshan, Qinling-Huaihe, and Kunlun Mountains-Qilian Mountains- Hengduan Mountains. Therefore, there’re 3 samples in the northern region: Taiyuan-Jincheng, Shenyang-Fushun, Zheng-zhou-Kaifeng;
8 samples in the southern region:
Changsha-Zhuzhou-Xiangtan, Guangzhou-Foshan, Shenzhen-Hong Kong, Shenzhen-Huizhou, Nanjing-Zhenjiang-Yangzhou,
Xiamen-Zhangzhou-Quanzhou, Wuhan-Ezhou, Chengdu-Deyang; 2 samples in the northwest region: Xi’an-Xianyang, Wulumuqi-Changji.
Finally, combine the two results and extract the sub-sample as: Guangzhou-Foshan (post-industrialization, southern region); Changsha-Zhuzhou-Xiangtan (late industrialization, southern region); Xi’an-Xianyang (mid-industrialization, northwest region); Shenyang-Fushun (mid-industrialization, northern region).
B. Data Sources
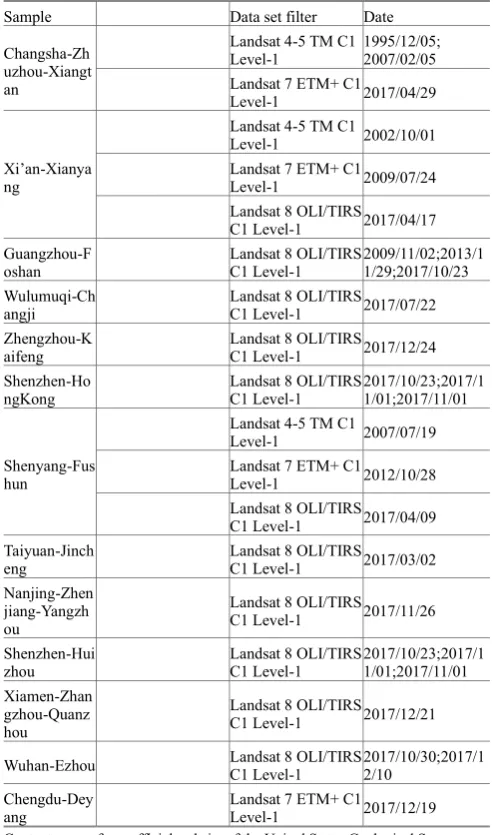
satellite image data is from the open source of the official website of the United States Geological Survey (USGS) (Table III).
C.Research Methods
The research methods insist two parts: diachronic study and synchronous study. Diachronic study is conducted on sub-sample, to propose the point-in-time theory of urban integration. Synchronous study is conducted on whole sample; to summarize the spatial pattern characteristics of urban integration.
The sub-samples adopt diachronic research. Three time points are selected from satellite image data for single case comparison, and then summarize them. The whole samples adopt synchronous study, all the satellite image data of the latest year were selected for horizontal comparative study and a summary was made.
TABLE III:THE SATELLITE IMAGE DATA RESOURCES
Sample Data set filter Date
Changsha-Zh uzhou-Xiangt an
Landsat 4-5 TM C1 Level-1
1995/12/05; 2007/02/05 Landsat 7 ETM+ C1
Level-1 2017/04/29
Xi’an-Xianya ng
Landsat 4-5 TM C1
Level-1 2002/10/01
Landsat 7 ETM+ C1
Level-1 2009/07/24
Landsat 8 OLI/TIRS
C1 Level-1 2017/04/17
Guangzhou-F
oshan Landsat 8 OLI/TIRS C1 Level-1 2009/11/02;2013/11/29;2017/10/23 Wulumuqi-Ch
angji
Landsat 8 OLI/TIRS
C1 Level-1 2017/07/22
Zhengzhou-K aifeng
Landsat 8 OLI/TIRS
C1 Level-1 2017/12/24
Shenzhen-Ho ngKong
Landsat 8 OLI/TIRS C1 Level-1
2017/10/23;2017/1 1/01;2017/11/01
Shenyang-Fus hun
Landsat 4-5 TM C1
Level-1 2007/07/19
Landsat 7 ETM+ C1
Level-1 2012/10/28
Landsat 8 OLI/TIRS
C1 Level-1 2017/04/09
Taiyuan-Jinch
eng Landsat 8 OLI/TIRS C1 Level-1 2017/03/02
Nanjing-Zhen jiang-Yangzh ou
Landsat 8 OLI/TIRS
C1 Level-1 2017/11/26
Shenzhen-Hui
zhou Landsat 8 OLI/TIRS C1 Level-1 2017/10/23;2017/11/01;2017/11/01 Xiamen-Zhan
gzhou-Quanz hou
Landsat 8 OLI/TIRS
C1 Level-1 2017/12/21
Wuhan-Ezhou Landsat 8 OLI/TIRS C1 Level-1 2017/10/30;2017/12/10
Chengdu-Dey ang
Landsat 7 ETM+ C1
Level-1 2017/12/19
Contents come from official website of the United States Geological Survey (USGS), and selected by authors.
III. RESULTS A. Point-in-Time
There are three points-in-time during the process of urban integration: the germinate point, the start point, and the grow
point. The germinate point means that the individual city begins to spread to the other side and presents a spatial convergence trend. The start point means that cities all have started to spread toward each other and have begun to cross the administrative boundaries. The point of grow means that the boundaries of the urban areas of the cities have been blurred and have begun to grow in both directions.
In the case of Changsha-Zhuzhou-Xiangtan, the germinate point appeared be-tween 1995 and 2007, the start point was around 2017, and the grow point is still not appeared (Fig. 1). In the case of Guangzhou-Foshan, the germinate point and the start point both began before 2009, and the grow point appeared between 2013 and 2017 (Fig. 2). In the case of Xi’an-Xianyang, the germinate point appeared between 2009 and 2017, and the start point and grow point are still not appeared (Fig. 3). In the case of Shenyang-Fushun, the germinate point appeared between 2012 and 2017, and the start point and grow point are still not appeared (Fig. 4).
Fig. 1. Spatial images of Changsha-Zhuzhou-Xiangtan, in 1995, 2007, and 20173.
Fig. 2. Spatial images of Guangzhou-Foshan, in 2009, 2013, and 2017.
Fig. 3. Spatial images of Xi’an-Xianyang, in 2002, 2009, and 2017.
Fig. 4. Spatial images of Shenyang-Fushun, in 2007, 2012, and 2017.
In summary, when a single city in an urban integration area enters the stage of late industrialization, or all cities enter the stage of mid-industrialization, it means that the urban integration reaches the germinate point. When all cities are in the late stage of industrialization, the start point can only be reached. When individual cities enter the period of post-industrialization, while other cities are also entering the late stage of industrialization, they can reach grow points.
B. Spatial Pattern Characteristics
As a dynamic development process, the whole samples of urban integration are divided into three types according to the characteristics of spatial pattern: concentrated-spread type, multi-group fragmentation type, and halfway-point growth type.
Concentrated-spread type includes 4 samples: Wulumuqi -Changji, Changsha-Zhuzhou-Xiangtan, Xi’an-Xianyang, and Guangzhou-Foshan. They sequentially show the four stages of the process of urban integration, from the initial stage to the later stage, through the wide-spread of concentrated areas (Fig. 5).
Fig. 5. Concentrated-spread type: a. Wulumuqi-Changji, b. Changsha-Zhuzhou-Xiangtan, c. Xi’an-Xianyang, d.Guangzhou-Foshan4.
Fig. 6. Multi-group fragmentation type: a. Shenyang-Fushun, b. Nanjing-Zhenjiang-Yangzhou, c. Xiamen-Zhangzhou-Quanzhou, d.
Shenzhen-HongKong-Huizhou.
Multi-group fragmentation type includes 5 samples: Shenyang-Fushun, Nanjing-Zhenjiang-Yangzhou,
4 The red lines stand for municipal boundaries. Fig. 6-7 are as the same
above.
Xiamen-Zhangzhou-Quanzhou, Shenzhen-Huizhou, and Shenzhen-Hong Kong. There are trends or there have been many scattered urban groups between cities (Fig. 6).
Halfway-point growth type includes 4 areas: Zhengzhou -Kaifeng, Taiyuan-Jincheng, Chengdu-Deyang, and Wuhan -Ezhou. Driven by a relatively independent group between the metropolitan areas of the two cities, and gradually spreads to both sides and connects the cities (Fig. 7).
Fig. 7. Halfway-point growth type: a. Zhengzhou-Kaifeng, b. Taiyuan-Jincheng, c. Chengdu-Deyang, d. Wuhan-Ezhou.
IV. DISCUSSIONS
A. Accompanying the Evolution Process, the Number of Subjects Changes from Multiple to Single, While the Mechanical Direction Changes from Single to Multiple
Based on the character characteristics and dynamic characteristics during the evolution process, range the degree of interaction from low to high are as follow,
Shenyang-Fushun, Xi’an-Xianyang,
Changsha-Zhuzhou-Xiangtan, and Guang-zhou-Foshan. From Shenyang-Fushun to Guangzhou-Foshan, the number of subjects gradually changes from multiple to single. Shenyang-Fushun has one more interactive subject than the two urban subjects. Xi’an-Xianyang and Changsha-Zhuzhou-Xiangtan carry out the interaction between two cities or three cities. Guangzhou-Foshan has produced the effect of two cities as one.
From Shenyang-Fushun to Guangzhou-Foshan, the mechanical direction changes from single to multiple. In the case of Shenyang-Fushun, under the radiation-type mechanical effect emerges a third-party motive powers in addition to the interactive bodies of Shenyang and Fushun, and the two cities are still in their respective centripetal development (Fig. 8). In the case of Xi’an-Xianyang, under the conduction-type mechanical effect, flows of space, population and economy are all oriented from Xianyang to Xi'an (Fig. 8). In the case of Changsha-Zhuzhou-Xiangtan mechanical effect is still conduction-type. However, there is no balanced dynamic direction among them. The comprehensive transmission directions are: from Changsha to Zhuzhou, from Zhuzhou to Xiangtan, and from Xiangtan to Changsha (Fig. 8). In the case of Guangzhou-Foshan, the convection-type mechanical effect shows a vectorized growth trend. The spatial growth appears convection; the population growth transmits from Guangzhou to Foshan; the economic growth from Foshan to Guangzhou.
a b
c d
a
c
b
d
a
c
b
Comprehensively presents the two-way power of Guangzhou and Foshan (Fig. 8).
Fig. 8. Mechanical effect type: a. Shenyang-Fushun, radiation; b. Xi’an-Xianyang, convection; c. Changsha-Zhuzhou-Xiangtan, convection; d.
Guangzhou-Foshan, convection5.
B. Actual Points-in-Time of the Process Depend on the Level of Comprehensive Economic Development; the Balance Between Cities Is Significant.
Actual points-in-time in the process of urban integration depend on the level of comprehensive economic development, not the economic status of any individual city. When a single city enters the stage of late industrialization, or all cities enter the stage of mid-industrialization, the urban integration area reaches the germinate point. When all cities are in the late stage of industrialization, the urban integration area reaches the start point. When a single city enters the stage of post-industrialization, while other cities at least enter the stage of late industrialization, the urban integration area reaches the grow point.
C.The Formation of Spatial Pattern Is Influenced by the Balance of Comprehensive Economic Development Among Cities, Unbalance Leads to the Appearance of New Growth Pole, While It’s Not Affected by the Mechanical Effect, Which Is Different from That of a Single City
According to the conventional thinking and research conclusions, the mechanical effect of a single city affects the formation of its spatial pattern. However, this research found that it isn’t applicable on urban integration. The mechanical effect between the interactive entities has no direct impact on the spatial pattern of the urban integration.
For example, the mechanical effect of Guangzhou-Foshan is convection; while that’s conduction in Xi’an-Xianyang and Changsha-Zhuzhou-Xiangtan is. However, the spatial patterns of the three samples are all concentrated-spread type. The mechanical effect of Shenyang-Fushun is radiation, but it does not form the spatial pattern of halfway-point growth type, but multi-group fragmentation type.
Concentrated-spread type and multi-group fragmentation type mean that there’s a balanced status of economic development and all the cities are probably in the same stage of economic development. However, halfway-point growth type signals an unbalanced status of economic development. For example, Wuhan is in the stage of post-industrial and Ezhou is in the stage of late industrialization, that makes
5 The letters in the circle stand for the corresponding cities. Arrows stand
for vector direction of mechanical effect.
Wuhan-Ezhou develop in the type of halfway-point growth. V. CONCLUSION
This research fills the gaps in the theories about the point-in-time and spatial pattern characteristics on urban integration in China. First of all, the research consolidates and measures 13 all the implementation cases of urban integration areas across the country. Then, the research names three points-in-time during the process of urban integration: the germinate point, the start point, and the grow point. When a single city enters the stage of late industrialization, or all cities enter the stage of mid-industrialization, it means that the area reaches the germinate point. When all cities are in the stage of late industrialization, the start point can only be reached. When an individual city enters the stage of post-industrialization, while other cities at least enter the stage of late industrialization, the area can reach grow point. Thirdly, according to the characteristics of spatial pattern, there are 3 types of urban integration: concentrated-spread type, multi-group fragmentation type, and halfway-point growth type. The first type includes 4 samples; WulumuqiChangji, ChangshaZhuzhouXiangtan, Xi’an -Xianyang, and Guangzhou-Foshan. The second type includes 5 samples; ShenyangFushun, NanjingZhenjiang -Yangzhou, Xiamen-Zhangzhou-Quanzhou, Shenzhe n -Huizhou, and Shenzhen-HongKong. The third type includes 4 samples; Zhengzhou-Kaifeng, Taiyuan-Jincheng, Chengdu -Deyang, and Wuhan-Ezhou. Finally, the research makes 3 depth discussions. First of all, the number of subjects changes from multiple to single, while the mechanical direction changes from single to multiple. Next, actual points-in-time of the process depend on the level of comprehensive economic development; the balance between cities is significant. At last, the formation of spatial pattern is influenced by the balance of comprehensive economic development among cities, unbalance leads to the appearance of new growth pole, while it’s not affected by the mechanical effect, which is different from that of a single city.
This research applies single-point annual data for analysis. For further study, year-by-year data and overlay analysis are supposed to be more comprehensive and meticulous.
ACKNOWLEDGMENT
Pei Chen thanks her tutor, the other author as well, Prof. Ya-ping Huang, for uninterrupted rectification and enlightenment during the lengthy research.
REFERENCES
[1] X. D. Tao, “Regional cross-border governance model and experience of global cities,” Ph.D. dissertation, Dept. Arch. Chn., Southeast University, Nanjing, China, 2014.
[2] Z. Jun and X. F. Wang, Metropolitan Circle Planning, Beijing: China Architecture & Building Press, 2005.
[3] X. Qin, “Discussing the construction of china's metropolitan circle from the development experience of the metropolitan Area,” Journal of
Nanjing University of Technology (Social Science Edition), 2002.
[4] S. M. Yao, “Characteristics, types and spatial layout of urban agglomerations in China,” Urban Problems, 10-15+66, Jan. 2001. [5] Haken and Hermann, Synergetics: The Mysteries of Nature
Composition, Shanghai: Shanghai Translation Publishing House, 2013,
ch.2.
a b
[6] W. Xu, “The phenomenon of the convergence of spatial structure in the metropolitan area of the United States and its theoretical significance in the second half of the 20th century,” World History, 2006.
[7] W. Wei and G. R. Zhao, “A review of the study of the metropolitan region in Japan,” Modern Japan Economy, pp. 40-45, Feb. 2002. [8] W. De and X. Xiao, “Structural evolution of metropolitan areas,” City
Planning Review, pp. 73-76, Feb. 2002.
[9] S. J. Hong, Metropolitan Governance: Theory Evolution and
Operation Mode, Nanjing: Southeast University Press, 2009, ch. 5.
[10] X. J. Wang and J. G. Wang, “Randstad and green heart - Protection and utilization of urban open space in the west of the netherlands,” Planner, pp. 90-93, Oct. 2003.
[11] H. Na, “Geographical analysis of the formation process of Tokyo metropolitan area,” M.S. thesis, Dept. Arch. Chn., Northeast Normal University, Changchun, China, 2006.
[12] Z. Jun, X. H. Wang, Z. Wei, and X. H. Chen, “Planning of Japan's capital circle and its enlightenment,” Urban Planning in Foreign
Countries, pp. 38-40, Jun 2003.
[13] J. Victor, Metropolitan Government, Chicago: University of Chicago Press, 1942.
[14] Shenzhen 2030 Urban Development Strategy, Shenzhen Municipal
People's Congress Standing Committee, Shenzhen Special Zone, CHN, 2006.
[15] T. Charles, “A pure theory of local expenditures,” The Journal of
Political Economy, pp. 416 – 424, May 1956.
[16] H. V. Savitch and R. K. Vogel, “Paths to new regionalism,” State and
Local Govenments Review, pp. 158 – 168, Mar. 2002.
[17] X. Ding, “The development and problems of Seoul metropolitan area in South Korea,” Urban Issues, pp. 13-16, Apr. 2000.
[18] G. H. Cui, “A new trend of regional spatial planning in urban planning,” Urban Planning in Foreign Countries, pp. 11-15, May 2001.
[19] X. P. Wang, “Metropolitan areaization: A new stage of urbanization in China,” Urban Planning Forum, pp. 10-12, Feb. 2012.
[20] Z. Qun, “Research on the same urbanization in the Yangtze river delta from the per-spective of new institutional economics,” Ph.D. dissertation, Dept. Arch. Chn., East China Normal University, Shanghai, China, 2011.
[21] X. Y. Gao and H. B. Wang, “Analysis of the metropolitan economic circle and the problem of urbanization,” Business Economics, pp. 89-91, Aug. 2007.
[22] X. Ming, “Research on urbanization of metropolitan area,” Ph.D. dissertation, Dept. Arch. Chn., Northeast Normal University, Changchun, China, 2011.
[23] J. D. Liu et al., “Analysis of the concept of metropolitan area and the division of the administrative metropolitan area type,” Chinese
Regional, pp. 2-4, Apr. 2003.
[24] Y. M. Ning, “Review of foreign metropolitan area planning review,”
World Geography Research, pp. 36-43, Dec. 2003.
[25] X. W. Hu, “Discussion on some urban and regional concepts in urbanization research,” Urban Planning, 28-32, Sep. 2003.
[26] G. Wei and S. G. Luo, 2006 Metropolitan Area Assessment Report, Shanghai: Shanghai Sanlian Bookstore, 2007.
Pei Chen was born at Hubei, China, in 1989. Pei
Chen got a bachelor of engineering in urban planning and a bachelor of arts in English in 2013. She is pursuing for further study as a Ph.D. student in Faculty of Architecture and Urban Planning, Huazhong University of Science and Technology, Wuhan, China, since Sep. 2015. The research field is regional planning and development. She had an internship in Huazao Architecture Design Co., Ltd, Suzhou, China, from July to September in 2012. She enjoys in social activities and volunteer activities: historical site investigation, Zuiyi, Guizhou province, in May 2018; village planning service of Baizhanghe, Yingshan, Huanggang, Hubei province, worked as the director from January to April in 2014; town planning service of Longping, Baokang, Hubei province, worked as the director in July 2014; town planning service of Chenghe, Xiangyang, Hubei province, worked as the director in July 2012; volunteer at Peizhi Primary School(children with autism), Wuhan, in May 2012; volunteer at Rehabilitation Centre(children with visual or hearing disturbance), Wuhan, in March 2008. She published “Evaluation Methodology on Industry-city Integration Degree of China National High-Tech Industrial Development Zones” Huazhong Architecture, Wuhan, in August 2018. She focuses on the research on urban integration in metropolitan area in China.
Ms. Chen was honored as one of ten best leadership of undergraduate students of HUST in 2015; outstanding graduates of HUST in 2013; provincial outstanding team leader of college student volunteers’ summer practice in 2012.
Ya-ping Huang was born at Hubei, China, on 23rd
Mar. 1964. Ya-Ping Huang is a professor, a doctoral supervisor, the dean of School of Architecture and Urban Planning. Ya-Ping Huang got a bachelor in urban planning in Wuhan University of Technology, Wuhan, in 1984; a master in urban planning in Tongji University, Shanghai, in 1989; a doctor in urban planning in Chongqing University, Chongqing, in 2006. The research field is regional planning and development.