Volume 1, Issue 3 (September 2012) PP: 40-44
Application of Synchronized Phasor Measurement in Real Time
Wide-Area Monitoring
Ms Anupama S. Patil
Assistant Professor, ZES’s DCOER, PuneAbstract––The most important parameter in several monitoring, control, and protection functions in inter-connected electric power networks is phasors representing positive sequence voltages and currents in a power network. There is need to enhance power system congestion and disturbances by wide area monitoring, protection and control. It is useful to improve grid planning, operation and maintenance. The latest advances in Synchronized Measurement technology are used in such systems to monitor, assess and to take control action to prevent or mitigate problems in real time. Time synchronization is not a new concept or a new application in power systems. With the advancement in technology, the time frame of synchronized information has been steadily reduced from minutes to microseconds. This paper stresses the application of phasor technology for power system operations in Real Time Wide-Area Monitoring and Analysis. The real-time monitoring provides the operator on-line knowledge of system conditions to increase the operational efficiency under normal system conditions, and allows the operator to detect, anticipate, and correct problems during abnormal system conditions. A MATLAB simulation has been carried out to demonstrate the monitoring of the multi-machine system using synchronized phasor measurement.
Keywords––DFT, power system stability, synchrophasor, synchrophasor measurement
I.
INTRODUCTION
Time-synchronization provides advantage of directly measuring the system state instead of estimating it. Phasors representing positive sequence voltages and currents in a power network are the most important parameters in inter-connected electric power networks. To get a consistent description of the state of inter-inter-connected electric power networks, it becomes necessary to synchronize the measurement processes. Voltage and current phasors in a three phase power system can be measured from waveform samples. Synchronized phasor measurement technique can be used to determine transient stability of power system.
II.
PHASOR AND SYNCHROPHASOR MEASUREMENT
A phasor is a complex number associated with a sinusoidal wave. The phasor magnitude is the same as the sinusoidal wave magnitude. The phasor phase angle is the phase of the wave at t = 0. Phasors normally are associated with a single frequency. Synchrophasors, or synchronized phasor measurements provide a means for comparing a phasor to an absolute time reference. The availability of high-accuracy satellite-synchronized clocks makes synchronized phasor measurement possible. Through the use of the clock, the phasor measurement unit (PMU) produces a reference sinusoidal wave.[1],[2] This reference wave is a nominal frequency sinusoidal wave for which maximum occurs at the exact start of each second. The measured local voltage or current is then compared to this reference wave. According to the standard, a synchronizing source that provides the common timing reference may be local or global. The synchronizing signal may be distributed by broadcast or direct connection, and shall be referenced to Coordinated Universal Time (UTC). One commonly utilized synchronizing signal is the satellite signal broadcast from the Global Positioning System (GPS). At present Phasor Measurement Units (PMUs) are the most sophisticated time-synchronized tool available to power engineers and system operators for wide-area applications. This tool has been made possible by advancements in computer technology and availability of GPS signals A phasor is a vector consisting of magnitude and angle that corresponds to a sinusoidal waveform. The phasor of a signal can usually be derived based on Fourier transform by utilizing data samples N of the signal within a selected time window. The phasor calculated by DFT is given by:
) 1 0
N k jsinkθ (coskθ x N 2 X Phasor kFor a steady state signal, the magnitude is a constant while the value of the angle depends on the starting point of samples. In other words, the angle is a relative quantity and a time reference has to be selected before it can be calculated. By measuring the difference in phase angle between the Positive Sequence Voltage(PSV) phasor at the output of the generator/s, it is possible to detect transient stability or instability conditions.
III.
POWER SYSTEM STABILITY
Stability is the property of a power system containing two or more synchronous machines. The classical model of a multi machine may be used to study the stability of a power system. [6] Transient stability restores the system after fault clearance. Any unbalance between the generation and load initiates a transients that causes the rotors of the synchronous machines to “swing” because net accelerating torques are exerted on these rotors. When the total load equals total generation, machine speeds are practically equal to synchronous speed. The angular displacements, δ, of machines in a system provide information about the system dynamics. One cannot measure this angular displacement mechanically. By computing the voltage phasor behind the machine transient reactance, one can study the phase angle variations to obtain an image of the machine angular displacement. In practice, machine oscillating modes can be determined by measuring the phase angle of the positive-sequence voltage phasor at the machine terminals. If the oscillatory response of a power system during the transient period following a disturbance is damped and the system settles in a finite time to a new steady operating condition, we say the system is stable. Otherwise the system is considered unstable.
Fig. 1 WSCC 3-machine, 9-bus system
The popular Western System Coordinated Council (WSCC) 3-machine, 9-bus system shown in Fig.1 [7][8] is considered for analysis. The base MVA is 100, and system frequency is 60 Hz. A MATLAB simulation has been carried out on above system for healthy condition, various fault conditions and change in load condition. The results of simulation are observed by PMU.
(a)
(b)
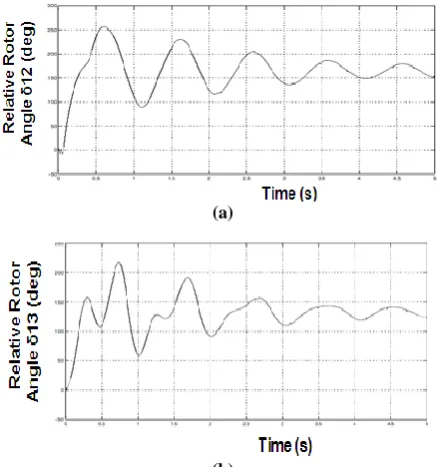
Fig. 3 L-L-L-G fault (a) Relative rotor angle δ12(deg) Vs Time(s) (b) Relative rotor angle δ13(deg) Vs Time(s)
(a)
(b)
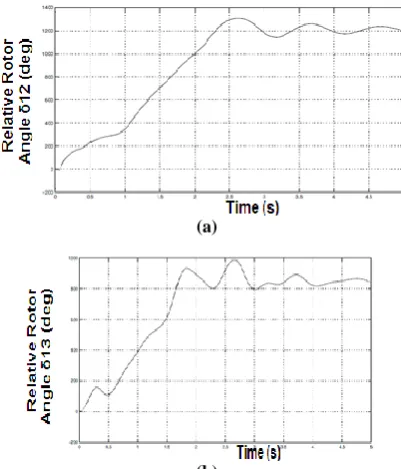
Fig. 4 L-L-G fault (a) Relative rotor angle δ12(deg) Vs Time(s) (b) Relative rotor angle δ13(deg) Vs Time(s)
(b)
Fig. 5 Increase in load (a) Relative rotor angle δ12(deg) Vs Time(s) (b) Relative rotor angle δ13(deg) Vs Time(s)
(a)
(b)
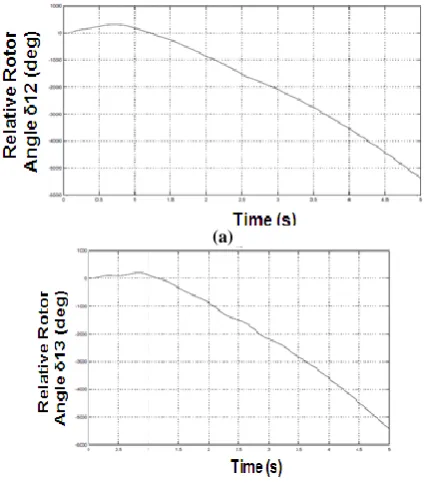
Fig. 6 Increase in load (a) Relative rotor angle δ12(deg) Vs Time(s) (b) Relative rotor angle δ13(deg) Vs Time(s)
IV.
RESULT ANALYSIS
We will demonstrate that by measuring the difference in phase angle between the PSV phasor at the output of the generator2 (Bus 2) and the same phasor at the output of the swing generator1 (Bus 1), and the difference in phase angle between the PSV phasor at the output of the generator3 (Bus 3) and the same phasor at the output of the swing generator1 (Bus 1) it is possible to detect transient stability or instability conditions. Generator 1 is specified as swing generator and inertia is specified very high. As we specify an infinite inertia, the speed and therefore the frequency of the machine are kept constant. Various types of faults and load change condition are applied to check the stability of the system.
Fig. 2 shows the results of the simulation with healthy system. The oscillatory response of a power system during the transient period following a disturbance is damped and the system settles in a finite time to its synchronous value and PSV phasor phase angle difference time waveforms reflect a stable disturbance for a second time. Hence the system is stable. When an L-L-L-G fault is applied at Bus 7-5 for 100 ms; the results are shown in Fig. 3. As the fault duration is greater than the critical clearing fault time, the phase difference increases exponentially with a positive time constant and the machine speed increases linearly. It indicates loss of machine synchronism. Hence the system is unstable.
Similarly when an L-L-G fault is applied at Bus 1 for 300 ms, the results are shown in Fig. 4. When a load applied at bus 5 is increased to 320MW, 95MVAR i.e. three times the original; the results are shown in Fig. 5. As the unbalance between generation load equations, the phase difference increases exponential with a positive time constant. It indicates loss of machine synchronism. Hence the system is unstable.
When a load applied at bus 8 is increased to 320MW, 95MVAR i.e. more than three times the original; the results are shown in Fig. 6. As the phase difference increases exponential with a negative time constant. It indicates loss of machine synchronism. Hence the system is unstable.
phasor measurement, DFT technique is widely used. By measuring the difference in phase angle between the PSV phasor at the output of the generator1 (Bus 4) and the same phasor at the output of the generator2 (Bus 5), it is possible to detect transient stability or instability conditions. When the fault duration is less than the fault clearing time, system remain stable. When the fault duration time is greater than the fault clearing time, system becomes unstable.
REFERENCES
1. Gabriel Benmouyal, E. O. Schweitzer, A. Guzmán , Schweitzer Engineering Laboratories, Inc., Techpaper 6139, Synchronized phasor measurement in protective relays for protection, control, and analysis of electric power systems
2. IEEE Standard 1344-1995. .IEEE Standard for Synchrophasors for Power Systems.
3. J. Z. Yang and C. W. Liu, “A Precise Calculation of Power System Frequency and Phasor” IEEE Transactions on Power Delivery, Vol. 15, No. 2, April 2000.
4. Hadi Sadat, Power System Analysis, Tata McGraw-Hill Book Company, 2002
5. A. G. Phadke and J. S. Thorp, “A New Measurement Technique for Tracking Voltage Phasors, Local System Frequency”, IEEE Transactions on Power Apparatus and System, May 1983.
6. Kundur, P., Power System Stability and Control.,McGraw-Hill, 1994.
7. P. M. Anderson and A. A. Fouad, Power System Control and Stability (Iowa State University Press, Ames, IA, 1977).
8. P. W. Sauer and M. A. Pai, Power System Dynamics and Stability (Prentice Hall, Upper Saddle River, New Jersey, 1998)
9. A. G. Phadke et al., “Synchronized Sampling and Phasor Measurements for Relaying and Control”, IEEE Transactions on Power Delivery, Vol. 9, No. 1, January 1994.
10. P. Bonanomi, “Phase Angle Measurements With Synchronized Clocks. Principle and Applications”. IEEE Transactions on Power Apparatus and Systems, Vol. PAS-100, No. 12, December 1981.