A New Iterated Connected Components Labeling
Algorithm Based on Medical
Segmentation
Yahia S. AL-Halabi
Abstract—Connected Component labeling of a binary image is an important task especially when it is used in medical images for recognition purposes. This research is an advance step for applying a proposed algorithm for allocating connected components labeling of medical images. We explore and simulate iterative method towards the development of an automated system for the purpose of connected components labeling to be applied for constructing such labeling on colored images by repetition labeling on sub- images which are originally segmented from the original image. These sub-images are formed from the whole image segmentation process. The algorithm is a simulation process on colored images for practical medical image. Two process algorithm is applied for labeling. The first process is row-wise from left to right. The second one is column-wise, from top to bottom. One important application is the medical image simulation that shows an interesting topic related to heart failure and heart attack. The efficiency of the proposed algorithm is noticed compared with the conventional algorithms in term of memory space and accuracy as well. For the small size images 128 X 128, the iteration version was acceptable in term of computer time and it is recommended to be used to label specific medical images. We experimented 2 sizes: 128 X 128, 256 X 256 and The speed-up was obtained using 128 X 128 size, using all 8- connected neighbors instead of looking at 4 immediate neighbors, which yields to reduction in the number of iterations required with a little increase in search time.
Index Term— Segmentation, sub-connected component labeling, medical images, threshold image processing.
I. INTRODUCTION
Connected component labeling depends on some conditions related to pixel connectivity and using advanced type of data structure. It is the process of scanning an image and grouping pixels into components, such that all pixels in a connected component share other separate group which has similar pixel intensity values connected with. As a result of grouping these pixels, each pixel is labeled with a gray level or color labeling depending on the assigned component. Connected component labeling is a very important tool used in both pre-processing stages in image analysis and also in post processing stages. Most of the reported studies, connected components labeling algorithms are applied on binary images. This motivated researchers to evaluate and apply the proposed
The author is a Professor in Computer Science, King Hussain School for Computing Sciences, Princess Sumaya University for Technology, Amman-Jordan, ([email protected]), ([email protected]).
connected component labeling algorithms directly on grayscale images without converting it into binary images of correctness and also for generality. This paper emphasizes the need for developing and implementing faster iterated connected component labeling algorithms depending on the sub-segmentation to process grayscale images without converting into binary images. Application of such technique is simulated on medical image. Next section of this paper briefs the latest literature of this subject showing some existing algorithms for connected component labeling. The new iterated algorithm will be presented. Section three will sketch the new strategy of applying such algorithm and shows simulation process including segmentation and data structure. Finally, section four will outlines results and conclusions of applications drawn from our proposal on medical image.
II. LITERATURE REVIEW
algorithm [13], [15], [18], [19], [23]. They represented good
algorithm for connected components labeling and proposed an efficient modeling strategy by means of decision tables. The proposed optimization strategies were to improve connected components labeling algorithms. Initially, a decision tree strategy is employed to minimize the number of neighboring pixels accessed in the scanning phase, and the second strategy was to employ streamlines algorithms to track equivalent labels [13], [14], [15], [16], [18], [19].
Other approaches are related to application of parallel algorithm for connected component labeling of gray-scale images. Researcher [12] proposed parallel version of the label equivalence algorithm using GPUs (introduce a parallel algorithm design model for the GPU architecture). Their algorithm consists of three basic steps: scanning, analysis and labeling. These steps are repeated in a loop until all of the connected components are identified and labeled correctly. Due to the parallel implementation of connected components labeling, this algorithm decreases the execution time quite effectively but it consumes more memory in using the reference array. The same for many other researchers who applied normal [3], [6], [7], [14]. [23] or parallel procedure described above to minimize computer time. Recently, different techniques are published and available in the different scientific journals deal with connected component labeling and they are different in structure but finally yield to the same results. In this research we propose a new iterative method by applying in the first step image segmentation process on the whole image and then applying new iterated connected labeling on the sub-segmented images, and finally, solving such problem iteratively. Simulation process will be performed on medical images.
III. SIMULATION PROCESSS
Image segmentation either in gray or color is an important basic operation for meaningful interpretation and analysis of acquired images. Image segmentation is the process which consists of achieving a compact region-based description of the image scene by decomposing it into meaningful or spatially coherent regions sharing similar attributes [5], [7], [10], [12], [19]. In this contents, researches over the past years convinced that too much work to be done in the field of image segmentation, to end up with best algorithm. In other words, still there is no segmentation technique that can dominate others for all kind of gray images or colored. In this case, the color image segmentation approach, one can depend totally on the definition of a region to be based on being having similar color. Such hypotheses are likely to be accepted by researchers in this topic [11], [19], [15], [23]. For the purpose of our research, we found that the technique of partition models based on the partition of the whole image to smaller
sub-segments is much easier and very useful for the parallel process of solving the problem of connected components of each generated sub-segmented image and finally to merge such labeling in a representative form with minimal computer time. For this purpose, we will apply the proposed method which has successfully been applied by [17], [18] for segmentation which has a contribution of using several different color spaces based on the K-means clustering technique to fusion information. It is reported "in the different researches and experimental results", illustrate the potential of this approach compared to the state-of-the-art segmentation methods recently proposed in the literature. We will use such technique to generate segmentation process to be applied for the next part of our research related to connected components labeling and its applications. Detailed information about this method for segmentation is available in reference [13], [14], [15], [19]. Segmentation is defined as a process which subdivides an image into its constituent regions. It is the process of grouping pixels which have similar attributes. Additionally, it is the process of partitioning an image into non-intersecting regions [14]. Each of such is also homogeneous and the union of any no two adjacent regions is homogeneous. In the field of recognition, segmentation is considered as the first phase of a pattern recognition process and usually referred as object isolation. In this content, one has to separate out the regions of the image corresponding to interesting objects, from the regions of the image that correspond to background. It is well known that the use of Thresholding [T] provides an easy and convenient way to perform segmentation process [22] . This step is important and can be used for this purpose on the basis of the different intensities or colors in the foreground and background regions of an image. Additionally, by using Thresholding [22] , one is able to see the areas of an image which consist of pixel’s values lie within a specified range [10], [11], [13]. So, user is able to choose exactly what these ranges are and select his band of colors. In our case, we can fix for all sub-segments to have the same band which are the maximum band for all sub-segments. In case of binary images, simple threshold can be specified, so that a band of intensity values f(x, y) can be set to white, while everything else is set to black. In the case of color images, one can set different thresholds for each color channel, and select just those pixels within a specified RGB space (or for not losing) to be set to black for all those pixels corresponding to background, and leave foreground pixels at their original color/intensity so that information is not lost. Grayscale or color image is the input to Thresholding process [22]. In the simplest implementation, the output is a binary image representing the segmentation. Black pixels correspond to background and white pixels correspond to foreground (or
vice versa). If the pixel's intensity f(xi, yi) of an image [G] is
higher than the threshold T, the pixel at g(xi, yi) is set to white in the output. If it is less than the threshold, it is set to black.
For color or multi-spectral images, it is possible to set different Thresholds for each of selected color vector channel [ C→ ] and select those pixels within a specified cubic area in RGB [ Red Green Blue ] space or possibly set to black all those pixels corresponding to background, but leave foreground pixels at their original color/intensity so that information is not lost.
g(xi, yi) = 1 if d(xi, yi) < = dmax ……(2)
0 if d(xi, yi) > dmax where
d(xi, yi) = [ [ f(xi, yi) –R0 ] 2 + [f(xi, yi) – G0] 2 + [f(xi, yi)- B0] 2 ] 1/2
…… (3)
By using the above, each pixel in the image can be declared virtually as in multi-dimensional array G with indices:
G[ i, j,g(i,j),c(i, j),sub- seg(i,j),Loc(i,j,sub-seg(,i,j))]
or as sub arrays of partial link lists according to the user requirements, where: sub-seg(i,j) will be the sub-segment number of the image, Loc(i,j,sub-seg(i,j)) is the connected component of the sub-seg(i,j), c(i,j) is the selected color of the pixel at location (i,j), constructed by using a fixed vector arrayassigned from the different thresholds used by the user for color or multi-spectral images, which is described above to set different thresholds for each color vector channel [ C
→ ] of size m, and the values of sub-seg(i,j) goes from 1 to k where k is the total number of sub-segments obtained in segmentation process. Such base information is the fundamental of the inputs and outputs for the next research step.
The data structure of this algorithm is the same as that implemented by the author [21] which is based on stack and Pop and Push operations.
IV. ITTERATIVE CONNECTED COMPONENT LABELING PROCESS.
Connected component labeling of an image is equivalent to classify an image and find the class to which pixel of the image belongs. In our case, one has to power points that the class in which set of pixels belongs which makes the objects having the same label are the colors. Additionally, the connected components labeling will be performed on each sub-segment, individually in parallel, and not performed on the whole image. Such colors are the ones selected in segmentation process which can be either the actual color of the pixel or the ones generated according to the selection criteria set from the different Thresholds for each color vector channel [ C→ ].
This first step of implementing in this research is based on searching around black color operations of an image. The proposed labeling connected components algorithm walks around black to identify their boundaries. A one-dimensional array used to keep label equivalences. It is used for the purpose of uniting equivalent labels successively during the operations in the different directions. The boundaries of the object are the most interesting parts to be identified. The algorithm applies two processes of labeling, one is row-wise from left to right and one is column-wise, from top to bottom at initial zero iteration. Following the algorithm of the author [21], a sub image I[i,j] p+1 (I is a sub-set of G) , is defined after each labeling allocation. It is generated by subtracting the iterative labeling obtained at I [i, j]p row-wise and labeling obtained at I[i,j]p column-wise. The new image for next iteration I[i,j]p+1= I[i,j] p - (labeling obtained from image I[i,j]p row-wise ∩ labeling obtained from image I[i,j]p column-wise) where (p) is the iteration number . Such proposed algorithm is very useful in different areas of image processing such as, medical imaging which focus on accuracy than other important measurements as well. The data structure used is the stack and the stack operations are its main engine. The data pushed or popped to or from the stack, presents the directions to be taken in consideration for searching, in order to determine the boundary pixels, to detect the connected components iteratively. Follow-up such process is very important for selecting a suitable data structure. For simplicity, assume that the sub-seg [i,j] is generated as described before using the proposed technique or any segmentations algorithm, then its pixels are subsets of all pixels in the whole image (I). Also, the union of all pixels in the sub-segments are equivalent to the pixels in the whole image (I), and finally, the intersections of all pixels in sub-segments is empty [ϴ]. When dead-end is reached, DBoundaries (Delete Boundary) function will be executed. It will POP the coordinates (x,y), the color of the pixel ( ColorPixel function), and return back iteratively to scan for boundaries again, as shown in the pseudo code. It is possible to use either 4-neighbor or 8-neighbor of pixel p(x, y) as shown in Figure 1.
Fig. 1 . The 4-neighbors and 8-neighbors of pixel p(x, y), are [p2, p4, p6 and p8], and the 8-neighbors of pixel p(x, y) are [p1,p2,p3,p4,p6,p7,p8 and p9].
For a pixel p(x, y), we define the neighborhoods:
N4(p) = N4(x, y) ={(x, y), (x + 1, y), (x − 1, y), (x, y + 1), (x, y − 1)}, and
p2
p4 p(x,y) p6
p8
p1 p2 p3
p4 p(x,y) p6
N8(p) = N8(x, y) = {(x′, y′) | x′ = x − 1, x, x + 1, y′ = y − 1, y,
y + 1}.
In graph theory, two white pixels p and q are called 4-connected (resp., 8-4-connected) if there exists a sequence of white pixels (p = p0, p1. . . pk = q),such that:
pi+1 ε N4(pi) (resp., pi+1 ε N8(pi))
for every i = 0, 1, . . . , k − 1.
The Pseudo code data structure for generating connected components is as follows:
Main Functions [Row or column process]:
// for each sub-segment (sub-seg), perform the following: {
ScanBoundaries(int Col, int Row,int Np) {
// Check for boundary Pixel ( Col and Row for pixels in sub-segment selected):
if (Boundary(Col,Row,Np) ) Perform: PUSH(Col,Row,Np); ……… . . }
DBoundaries( ); { Fix the coordinates ; Perform: POP();
Perform: ColorPixel (x,y,Color); Repeat iteratively:
Scan-boundaries(x,y,);}
// PUSH (x, y, NP); NP is the number of pixels in the sub-seg;
// Generate Link Array: Update the link; then increase stack pointer by one;
// Increase: Counter ++; increase stack counter by one; // Increase Array Location:
Pointer =Pointer +2; As follows: PUSH(int x, int y,int NP) ; {
PutPixel(x,y,Color); Arr[t]=x;
Arr[t+1]=y;
t=t +2; StackCount+=1;
}
// Pointer =Pointer-2;
// decrement stack pointer by 2 ; // Counter - -;
// decrement stack counter by one; // Move NULL;
// make the last pointer NULL;
POP ( ) {
Col=Arr[t-2]; R=Arr[t-1];
t-=2;
StackCount-=1; }
}
It is worth mentioning that (for each sub-seg after completing the scan), the equivalent label pairs are sorted into equivalence classes and a unique label is assigned to each class. As a final step, a second scan is made through the sub-segment, during which each label is replaced by the label assigned to its equivalence classes. For binary image, regions of adjacent pixels which share the same set of intensity set value equal to 1 , while in a gray level image intensity will take on a range of values between “0 to 255”, as an example. User must be careful in building special link lists for the pixels of each sub-segment and its properties, because of the irregular structure for each pixel. It is possible to build matrices for each sub-segments of size n x n leaving a value 0 for each location of pixel in the sub-segment which has no reference. To find the location of pixel in sub-segment, define link list array called Arr and apply the rules and functions as follows:
Arr [i]←
x_coordinate [min I [locx[i],locy[i]]] I Ɛ Np(4 or 8)-(x,y) , I [locx[i],locy[i]] = 1
Arr [i+ 1] ←
y_coordinate [min I[locx[i],locy[i]]] I Ɛ Np(4 or 8)-(x,y) , I [locx[i],locy[i]] = 1
Arr [StackCount] ←
y_coordinate I [locx[i],locy[i]] If ∃i Ɛ Np(4 or 8)-(x,y) ,I [locx[i],locy[i]] = 1
Arr [Stackpointer+ 1] ←
y_coordinate I [locx[i],locy[i]] If ∃i Ɛ Np(4 or 8)-(x,y) ,I [ locx[i],locy[i]] = 1
Otherwise:
Arr [i]= Arr[i+1]=Null if I [locx [i], locy [i]] = 0 and Arr[i+1]= Null if I [locx [i], locy[i]] = 0
V. RESULTS and CONCLUSIONS
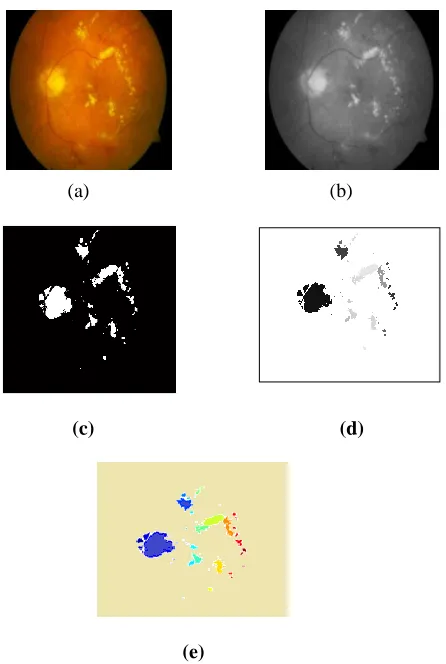
The regions discriminated by the connected component depend on the definition of neighborhood as defined in the proposed algorithm. Several definitions of neighborhood exist, commonly used is 8-connected. The algorithm we proposed is 8-connected components as show in Figure 1 and it assigns new labels to the first pixel of each component and attempt to propagate these labels through the neighbors as defined above. The proposed algorithm makes two passes through the image. The first pass assigns and propagates labels, while at the same time it creates an equivalence class table. The second pass re-assigns the labels that belong to the same class using the equivalence class table, where all equivalence is assigned with a unique label. The final image has its connected components indexed with a unique label. The most recent algorithm proposed, for connected component analysis, attempt to overcome the fundamental problems of either being too slow or requiring a large amount of computer memory. Different medical images are used to show the characteristics of such algorithm. One of the medical applications is called Diabetic Retinopathy which affects the new eye and led to partial or even complete loss of vision and possibly cause of blindness. A change in the blood vessels of the retina is caused by Diabetic Retinopathy. Medically, it is found that blood vessels of the eye leak fluid or blood vessels grow on the surface of the retina. The application of the proposed algorithm for connected components of the image for an eye of a patient with Diabetic Retinopathy is shown in Figure 2. Original input image used is the same used by [20] for an application of
ABNORMALITY DETECTION USING IMAGE
SUBSTRACTION algorithm in medical information. More medical information can be obtained by applying the proposed connected components of the patient image in Figure 2 - (c)-(e) in black and white scale, Gray scale and in automatic color image.
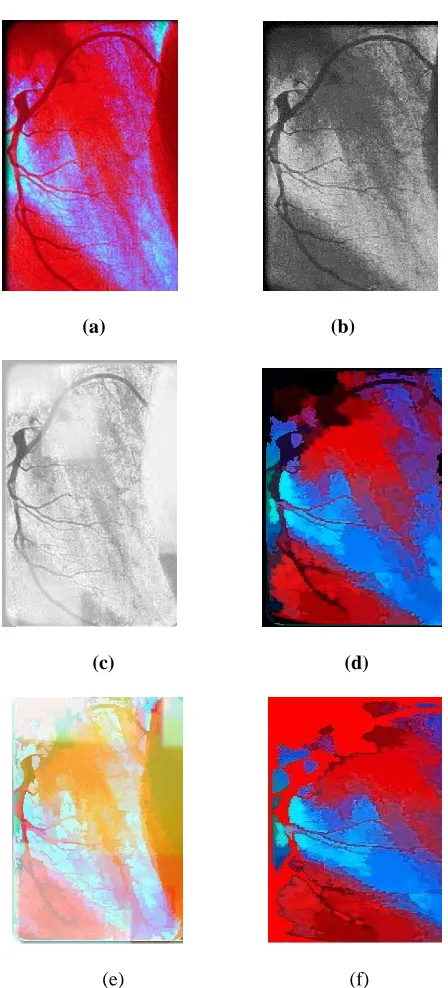
An interesting result for heart medical image is shown in Figure 3. It is expected by using this technique for labeling connected components to answer medically a lot of questions about the geometry of these tissues, their shape, boundaries, initial densities and mechanical properties. By using connected components technique, one can use the computer simulation for the proposed algorithm to predict the influence of different factors on the vascular network structure, the exact location of blood clots that block the supply of blood to the heart muscle, causing a heart attack.
(a) (b)
(c) (d)
(e)
Fig. 2. (a) Original input image. (b) Gray level input image. (c) Thresholding process after intensity conversion. (c) Black and white scale Diabetic Retinopathy labeling image. (d) Gray level Diabetic Retinopathy image after labeling. (e) Diabetic Retinopathy image after filling color,
(a) (b)
(c) (d)
(e)
Fig. 3. (a) Original input image. (b) Thresholding, Segmented and boundary detection using Black and white scale. (c) Thresholding, Segmented connected components labeling and boundary detection using gray scale. (d) gray scale final process, boundary detection, coloring technique for specific regions labeling connected components using limited selective colors. (e) The result or final filling colors, coloring technique for regions labeling connected components using 12 selective colors which shows the exact location of blood clots that block the supply of blood to the heart muscle, causing a heart attack.
By continuous imaging of the heart vascular and continuous control and size measure of the thickness of the vascular network heart muscle that loses its blood supply which starts to suffer injury, will yield to save patient by applying easy process of connected component labeling technique. This simple and easy connected labeling technique will help doctors and patients to determine how much damage occurs as
a function of time, depending on the result size of the area that is supplied by the obtained blocked artery in the image of the
(a) (b)
(c) (d)
(e) (f)
Fig. 4. (a) Original input image. (b) 16 bit color scale image. (c) Thresholding, Segmented connected components labeling (d) gray scale final
process, , coloring technique for specific regions labeling connected components using limited selective colors. (e) The result or final filling colors, coloring technique for regions labeling connected components using
12 selective colors which shows the exact location of blood clots that block the supply of blood to the heart muscle, causing a heart attack. (f) Final filling
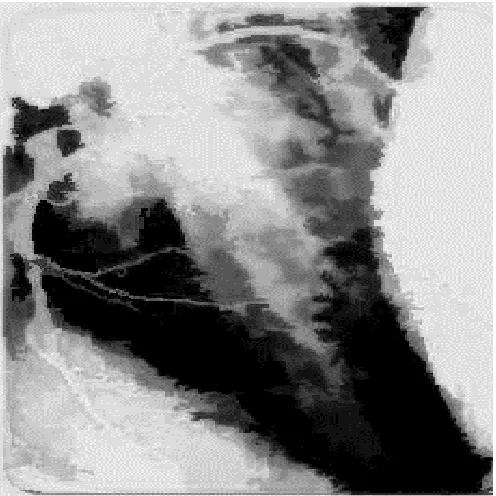
Figure 5. Enlarged gray level image for the previous heart image shows the exact the exact location of blood clots that block the supply of blood to the
heart muscle, causing a heart attack after segmentation and labelig.
connected component labeling , as well as possibly, the lapse in time between injury and treatment or with the right treatment and lifestyle changes and accurate continuous investigation of connected component labeling process, where further damage can be prevented or limited. Additionally, doctor can tell, when checking the data coming from connected labeling image, whether the patient has had a heart attack recently, or even earlier or not related at all depending on continuous revision of previous images and the previous connected component labeling as shown in Figure (3)-(a) - (e), Figure (4)-(a)-(f) and Figure (5) which give the exact connected labeling for the image of a heart affected with a heart attack and shows the boundary detection of the whole vascular heart network together with the final connected component labeling image filled with 12 color and gray level. Connected component labeling algorithm based on segmentation iterative methodology is proved to be an essential technique on general and medical images. The process of iteration for implementation of the sub-segments to generate connected components labeling is also shows the ability of its accuracy and simplicity. The definition of basic segmentation and basic iteration procedures were introduced in this research to explain the algorithm clearly. Feasibility and efficiency of the algorithm were verified with experiments as shown in the simulation process. This algorithm and its implementation prove that it performs well in labeling the set of connected components for images and mainly those apply for medical images labeling as well. Moreover, the proposed algorithm labeling possesses a desirable characteristic that will facilitate the subsequent processing of complicated three dimensional images for future implementation.
The proposed algorithm is implemented in iterative framework to reduce execution time. Difference between normal implementation and iterative implementation were clearly noticed during running and execution of the proposed practical modules. The pre-processing techniques such as image filtering and image registration play an important role in enhancing the accuracy of image analysis. User can modify such iterative algorithm to be implemented in a parallel fashion in the future. We proposed our iterative algorithm based on 8-directional label selection and showed that the proposed method is practical for the various tests of medical images. From our experiments, it is noticed that the maximum and minimum number of iterations for the sub-segments generated from the image (G) 210 and 26 respectively. For the small size images 128 X 128, the iteration version was acceptable in term of computer time and it is recommended to be used to label specific medical images. We experimented 2 sizes: 128 X 128, 256 X 256 and the speed-up was obtained using 128 X 128 size, looking at all 8- connected neighbors instead of looking at 4 immediate neighbors, which yields to reduction in the number of iterations required with a little increase in search time. Such minor problem can be solved completely in the future, by applying parallel processing for our algorithm.
REFERENCES
[1] A. Hashizume, R. Suzuki, H. Yolouchi, “An Algorithm of Automated RBC Classification and its Evaluation”, Bio Medical Engineering, vol. 28(1), p. 25-32, 1990.
[2] A. Michael, A. Wirth, “ A Non-rigid Approach to Medical Image Registration: Matching Images of the Breast", Ph.D. Thesis, 2000, RMIT University, Melbourne, Australia.
[3] A. Rosenfeld A., J. Pfaltz., “Sequential Operations in Digital Processing”, Journal of ACM, Vol. 13, 471-494, 1966.
[4] B. Ramasubramanian, G. Anitha. “An efficient approach for detection of new vessels in Diabetic Retinopathy images”, IGEIT, vol.2, issue.3, September 2012.
[5] C. Fiorio, and J. Gustedt,” Two Linear Time Union-Find Strategies for Image Processing”, Theoretical Computer Science, Vol 154(2), p 165-181, 1996.
[6] I. Christoyianni, E. Dermatas, Kokkinakis, G. “Automatic Detection of Abnormal Tissue in Mammography”, In Proc. International Conference on Image Processing, Volume 2, p 877-880, 2001.
[7] F. Chang and C. Chen, "A component-labeling algorithm using contour tracing technique," in Proc. Int. Conf. Document Anal. Recog., 2003, 741-745.
[8] K . Suzuki., I. Horiba, N. Sugie, “Linear-time connected-component labeling based on sequential local operations”,
Computer Vision and Image Understanding, www.elsevier.com/locate/cviu, 89 (2003) 1–2
[9] K . Suzuki., L. He; C. Yuyan . “Two Efficient Label-Equivalence-Based Connected-Component Labeling Algorithms for 3-D Binary Images”, IEEE Transactions on Image Processing
(August 2011), 20 (8), pg. 2122-2134.
[10] K. Wu, E. Otoo, and A. Shoshani, "Optimizing connected component labeling algorithms," in Proc. SPIE Conf. Med. Imag., 2005, 5747: 1965-1976
[12] L. He, Y. Chao, K. Suzuki, T. Nakamura, and H. Itoh: “A
label-equivalence-based one-scan labeling algorithm”. Journal of Information Processing Society of Japan 50, pp. 1660-1667,2009. [13] L. He, C.Yuyan , K. Suzuki, and K. Wu, "Fast
connected-component labeling," Pattern Recognition, 2009, 42(9):1977-1987. [14] 16-L. He, C. Yuyan , and K Suzuki, "An efficient first-scan
method for label-equivalence-based labeling algorithms," Pattern Recognition Letters, 2010, 31(1): 28-35.
[15] M. Kavitha and S.Palani,”Retinal blood vessel segmentation algorithm for diabetic retinopathy and abnormality classification by supervised machine learning”, International Journal of Neural Networks and Applications.vol.5, no.1,Jan-June 2012. ISSN 0974-6048.
[16] R., Gonzalez and Richard. Woods, Digital Image Processing, (Second Ed), Prentice Hall, 2002
[17] R., Haralick., Some Neighborhood Operations, Real Time/Parallel Computing Image Analysis , Plenum Press, New York, p 11-35, 1981.
[18] Rafael C. Gonzalez, Richard E. Woods,.“Digital Image Processing” ISBN 978-81-317-2695-2,seventh impression 2012. [19] S. Askarpour , S. Anari M.2 , A. Brumandnia and M Javidi , “The
Analysis of Connected Components and Clustering in Segmentation of Persian Texts” International Journal of Advanced Research in Electrical, Electronics and Instrumentation EngineeringVol. 2, Issue 4, April 2013, pages 1547-1553. [20] W. Thomas, K. Jean-Claude ,M. Pascale and E. Ali , ”A
Contribution of image processing to the diagnosis of diabetic retinopathy detection of exudates in color fundus images of the human retina”, IEEE Transaction on medical imaging,vol.21,no.10, October 2002.
[21] Y. Halabi, “New Algorithm - Simulation Connected Components Labelling for Binary Images”. International Journal of Emerging Technology and Advanced Engineering, (ISSN 2250-2459, ISO 9001:2008 Certified Journal), Vol. 3, Issue 12, Dec. 2013. [22] http://homepages.inf.ed.ac.uk/rbf/HIPR2/threshld.htm
[23] http://www.ukessays.com/essays/psychology/fast-connected-components-labeling-algorithm-psychology-essay.php
ProfessorYahia AL-Halabi
Professor Yahia AL-Halabi received his PhD degree in Mathematics and Computer Sciene from Clarkson University, USA in 1982. He joined the University of Jordan, Amman-Jordan, as an assistant professor in 1982, and was promoted to associate professor in 1987 and to the rank of full professor in 1994. During the period 1982 upto 2001, he was appointed as academic professor at the University of Jordan-in addition to be in different administrative positions such as: Director of Computer Center (for a period of 4 years), Chairman of computer Science (for a period of 6 years) and Dean of Faculty of Science and Art at Amman private University ( for a period of 3 years), visitng professor at Princes Sumaya University for Technology (for a period of one year), member of board of trustees of the University and member of different scientific and administrative committees in different Universities and ministries in Jordan and abroad. From 2001 until 2005, he jointed the new established University "Arab Open University" in Kuwait - headquarter office and served as Dean of the Faculty of Computer Studies for a period of 4 years. In Sept., 2005, he jointed Princes Sumaya University of Technology (PSUT) as professor of Computer Science - Faculty of King Hussain, Computer Science Department and Dean of fuculty of King Hussain of Technology, for the period between 15/9/2008 to 19/9/2010. Recently, he is