e-ISSN: 2278-7461, p-ISSN: 2319-6491
Volume 5 Issue 8 [Sep. 2016] PP: 01-12
A Sustainability Monitoring Tool For Computers In Learning
Institutions In Kenya
Dr. Karume S. M.
1Department of mathematics and computer science Laikipia UniversityP.O Box 1100-20300,Nyahururu, Kenya
Abstract:The upsurge of electronic waste (e-waste) in developing nations has prompted some governments to ban importation of refurbished computers. This action compromises the effort to bridge the digital gap by providing affordable computers to learning institutions. This paper presents the findings of a research whose aim was to provide a solution for sustainable management of electronic waste by monitoring sustainability of low cost computers for learning. Provision of low cost computers for learning so as to bridge the digital gap was found to significantly contribute to surging e-waste amounts. The proposed model aims at providing a solution for monitoring sustainability of affordable computers for learning so as to manage e-waste sustainably without depriving deserving children of access to technology education. The study embraced behavioral and design science to develop the model. A mixed research design was employed to establish the causes of decommissioning computers in learning institutions and the factors contributing to these causes thus affecting computer longevity and sustainability. Sustainable computing mechanisms for controlling decommissioning rate of computers were investigated alongside end of life management practices for reducing e-waste amounts in the institutions. The findings were used to develop a tool that incorporated a decommissioning metric to assess sustainability of low cost computers for learning.
Key words: end of life management, e-waste threat, obsolescence, sustainable computing, sustainability assessment
I.
INTRODUCTION
The digital gap brings with it a danger of isolating certain people from information access [1]. In an effort to bridge this gap, many programs have been launched to provide computers to educational institutions in Africa, ranging from refurbishing second hand computers to designing low cost new computers [2]. Given the potential impact of ICT use on social and economic development, countries strive towards making the benefits of ICT available to all people. Despite the indisputable benefits of ICTs, The speedy increase of electronic waste brought about by exponential consumer growth and the rapid obsolescence of electronic equipment is posing a major challenge to the environment. In absence of standard methods and infrastructure to handle e-waste in developing countries, the ever growing electronic waste stream is clearly unsustainable [3]. According to UNEP [4], the increase in future e-waste flows from PCs varies from country to country. In Uganda where PC penetration is still very low, quantities of e-waste generated will increase by a factor of 6 to 8 by 2020. Similar results were found for Senegal, where present flows of e-waste from PCs will be multiplied by 4 to 8 by 2020, depending on different growth scenarios.
II.
GOAL
OF
THE
STUDY
The purpose of the study was to develop a sustainability assessment model that would aid in managing e-waste from low cost computers for learning in developing nations. To attain this goal the following specific objectives were set:
i. Establish the strategies employed to provide low priced computers for learning in Kenya
ii. Determine the factors that affect the longevity and hence sustainability of low-cost computers for learning in Kenya
iii. Establish the methods used to manage decommissioned computers in learning institutions.
iv. Develop a sustainable computing assessment model that may be used to manage the amount of e-waste from low-cost computers for learning.
III.
METHODOLOGY
were sampled using the Cochran’s categorical sample size formula (n0 = t2 * (p * q) / d2). The institutions were sampled from computers for schools Kenya (CFSK) projects databases of the Government of Kenya, Computers for Schools, Kenya and NComputing Kenya. The response rate was 72.5%.Table 1 provides a summary of respondents. Data in the column named other was obtained through chain referral sampling
Table 1: Summary of respondents
Category of
institution
Data source
Governm
ent of
Kenya DB
CFS
K
N-computin
g
Other
Total
Secondary
schools
28
56
1
33
118
TIVET
0
7
0
6
13
University/ot
her
0
2
14
0
16
TOTAL
28
65
15
39
147
Source: Author
IV.
THE
GENESIS
OF
LOW-COST
COMPUTERS
FOR
LEARNING
The ICT boom of mid 1990s resulted to rapid transfer of information benefits to those with access to ICTs. These resulted to a digital gap between those people with effective access to information technology and those without access to it. The ensuing gap often referred to as “digital divide” encompass the imbalances in physical access to technology as well as the imbalances in resources and skills needed to effectively participate as a digital citizen [6].
The cost implications involved in acquisition of computers can be a justifiable hindrance to the provision of computers to schools. To bridge the digital divide amidst constrained economy James, 2002 [7] notes that costs of computers used in developing countries can be reduced in the ways discussed in sections 4.1, 4.2 and 4.3;
4.1
Reducing Cost by Extending the lives of Existing Computer Models
According to Gartner (2003) [8], the current industry life cycle standard for a new desktop computer in a corporate environment is 3-5 years while SchoolNet Africa, (2004) [9] notes that the average lifespan of a new PC is seven years. This means that once a computer outlives its usefulness in a corporate environment, it can be refurbished and given to low end users for an extra 2 to 4 years.
4.2
Reducing Cost by Designing Entirely New Products
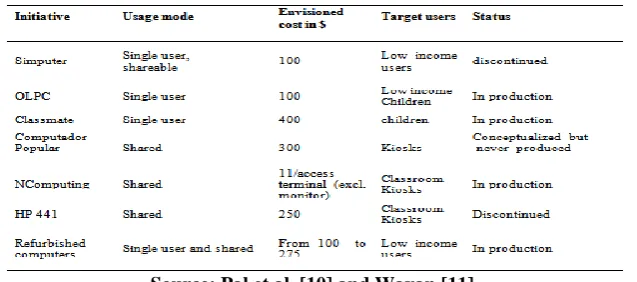
In an attempt to improve access to technology for underserved population different strategies to provide inexpensive computers to schools in developing nations have been employed [10]. Low-cost computing initiatives adopt various strategies to reduce the capital cost of hardware. However a common tactic employed by most of them is to ride on the computer industry’s exponential trends of increasing integration and performance. They either downgrade the final product e.g. use low end processors or remove certain components to achieve a low-cost device [10]. Table 2 presents a summary of some representative low-cost computing initiatives gathered from pal et al., 2009 [10] and Wayan 2010 [11].
Table 2: Summary of representative low-cost computing initiatives
4.3
Reducing Cost through Virtualization/Sharing
Virtualization entails pooling and sharing information technology resources including hardware and software. It provides a viable cost cutting strategy for institutions of learning which require many computers to offer computer education. As noted by [12] , technology sharing provides a viable means of reaching the poor than advocating for one laptop per child as is the case with the OLPC project.
V.
FACTORS
AFFECTING
LONGEVITY
AND
SUSTAINABILITY
OF
COMPUTERS
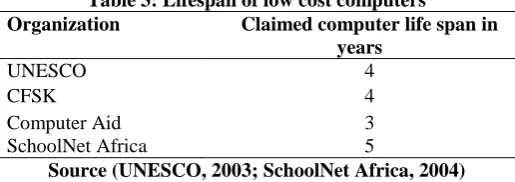
This section discusses the factors that affect the longevity and sustainability of computers. The oxford dictionary defines longevity as long life [20]. In respect of this, product longevity encompasses the life of a product from design to the end-of-life phase. On the other hand Sustainability addresses long term survival of resources amidst pursuant of flourishing lives. Product lifecycle impacts on sustainability since a product with long life entail less environmental pollution because of its inherent longevity and optimum utilization of material and energy in a limited resource scenario [3]. Table 3 presents the lifespan of low-cost computers as presented by several organizations
Table 3: Lifespan of low cost computers
Organization Claimed computer life span in years
UNESCO 4
CFSK 4
Computer Aid 3
SchoolNet Africa 5
Source (UNESCO, 2003; SchoolNet Africa, 2004)
From this data, 4 was used as the expected mean lifespan of low-cost computers i.e. 3+5 divided by 2 where 3 is the minimum claim and 5 is the maximum claimed lifespan. The factors that affect this lifespan are presented in sections 5.1 to 5.4.
5.1
Obsolescence
The oxford dictionary describes obsolescence as the state of an asset losing its utility even though it may still be in good working condition due to the development of improved or superior equipment, but not due to physical deterioration [13]. Consumers change their computers before mechanical or electrical failure due to increased versatility and improved functionality of personal computer devices [14]. This leads to thousands of tons of usable devices being abandoned every year resulting to increased concerns about hazards associated with electronic waste. The concept of software bloat in particular is rendering hardware obsolete before its actual end of life [15]. According to Plepys [16] the growing consumption and rapid obsolescence of electronic products are the main contributing factors for their increasing environmental impacts. This observation further reinforces the fact that obsolescence contributes significantly to reducing product longevity
5.2
Physical Failure
Desktop PCs have a 7-9% failure rate in the first year, increasing to 10-15% over several years [17]. A similar view is held by Tsunami Networks, an importer of refurbished and off-lease computers in Namibia, which maintains that it is a common known factor that the failure rate of second-hand equipment is similar to the failure rate of new equipment, which is estimated to be at 10% [18]. However, only 0.5% of new HP (A-Brand) PCs develop a fault in the first year. Notably HP offers a one-year warranty on its refurbished A-Brand PCs but refuses to warranty B-Brands PCs and reports a 4% failure rate in the first year of the refurbished PCs lifespan. The Shuttleworth Foundation states a figure of 6% failure for its refurbished PCs in a thin client environment. SchoolNet Africa reports a 20% failure rate for low quality imported PCs [12], providing a potential estimate of failure rates for B-Brand refurbished PCs in year four of their lifespan. Similar estimates of failure rates were reported by organizations in Swaziland [20].
5.3
Sustainable Computing
pollution prevention by extending IT equipment longevity thus reducing the amount of e-waste generated at any given time. Transitioning to sustainable computing has resulted to employment of a number of strategies such as virtualization so as to optimize the efficiency of computing systems in order to lower costs and to lessen the impact of computing on the environment by extending IT equipment life cycle [23].
5.4
End of Life Management for Decommissioned Computers:
Issues relating to sustainability of electrical and electronic equipment arise at various stages including material extraction, production, consumption and disposal at the end of useful life [3]. Sahni et al. [14] notes that thousands of tons of usable computers are abandoned every year due to increased versatility and improved functionality of personal computer devices which cause consumers to change their devices before they mechanically fail this has increased concerns about hazards associated with electronic waste. According to the US EPA land filling is much more common than both recycling and incineration of personal computer devices. However, the most common end-of-life option for desktop computers, laptops, and computer monitors is either reuse or storage; close to 65% of computer monitors undergo reuse or storage after their end of life. According to Reyes et al. [24], once it is established that ICT equipment has become waste, it should be liberated and directed to environmentally sound subsequent treatment processes where it is de-polluted by removing hazardous substances and storing them safely while components/materials that may be reused or recycled are refurbished for reuse or are directed to efficient recovery processes.
VI.
THE
MISSING
LINK
IN
SUSTAINABILITY
ASSESSMENT
IN
THE
IT
SECTOR
One of the least analyzed functions in the IT infrastructure lifecycle is hardware end of-life or retirement. Hardware decommissioning has long been relegated to an afterthought, with very little or no planning to incorporate sound economic or good environmental practices [25] (Doud, 2008). Doud further states that although sustainable IT debate has been going on for some time, the reality is that no single company has yet achieved a strategy that could be identified as a "best practice." Instead, several leading companies have managed to deploy pockets of excellence in approaching sustainability through greener IT. The entire IT asset lifecycle should be taken into consideration in order to enhance a company’s sustainability objectives (Murugesan, 2011). This implies that a good sustainability assessment tool in the IT sector should take into consideration the cradle to grave view point. The designed model seeks to achieve this.
VII.
CONCEPTUAL
FRAMEWORK
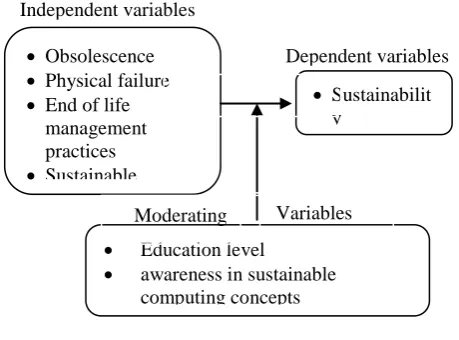
The conceptual framework that formed the basis of designing the sustainability assessment model for low cost computers is shown in Figure 1
Figure 1: Conceptual framework (Source: Author )
VIII.
RESULTS
AND
DISCUSSION
This section presents the findings of the study that formed the basis for the model design
8.1
Strategies Used to Provide Low-Cost Computers for Learning in Developing Nations
A survey of institutions offering computer studies was conducted to ascertain the type of low cost computers in use. The results summarized in Table 4 suggest that refurbished computers were the dominant
low-Dependent variables Independent variables
Obsolescence
Physical failure
End of life management practices
Sustainable computing techniques
Sustainabilit y
e-waste
threat Education level
awareness in sustainable computing concepts
Affects
cost computers at 70% followed by clone computers at 14%, Ncomputing model at 11% and second hand non-refurbished computers at 5%.
Table 4: Number of institutions categorized by the type of low priced computers for learning owned Source: Author
8.2
Frequency of decommissioned computers
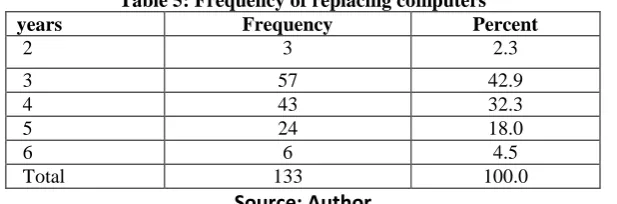
On a scale of 1 to 6 years, the interviewees were asked to indicate how often they replaced computers. The results are summarized in Table 5.
Table 5: Frequency of replacing computers
years Frequency Percent
2 3 2.3
3 57 42.9
4 43 32.3
5 24 18.0
6 6 4.5
Total 133 100.0
Source: Author
A one sample t-test for replacement mean was performed at 95% confidence level based on the following hypothesis:
H0: µ= 4, H1: µ< 4 (Degree of freedom = 132).
The results yielded a p-value of 0.012 which is less than 0.05 (the level of significance used for the test). From these findings sustainability of low-cost computers for learning is questionable since sustainability is concerned with long term survival of resources and is directly proportional to longevity.
8.3
Causes of Decommissioning Computers for Learning:
The total population of computers under investigation from participating institutions was 5820. Out of these 1922 computers were decommissioned from the 133 institutions giving an overall mean decommissioning rate of 14.45. The total number of computers decommissioned due to physical failure from 99 participating institutions was 1344 giving a mean decommissioning rate due to physical failure of 13.58. Total number of computers decommissioned due to obsolescence from 34 participating institutions was 583 giving a mean decommissioning rate due to obsolescence of 16.99. One sample t tests analysis for decommissioning mean due to physical failure and obsolescence was done using the overall decommissioning mean as the test value. The p-value from the t-test analysis was 0.367 and 0.277 for physical failure and obsolescence respectively. This suggest that both physical failure and obsolescence contribute significantly to increasing e-waste from the computers under investigation since the p-values are less than 0.05
8.4
End of Life Management of Decommissioned Computers
The study endeavored to find out what they did with computers that are decommissioned from their institutions. The results are presented in Table 6.
Table 6: What users do with decommissioned computers Number of
respondents
Percentage %
Store in own premises 67 51
Sell them off as spare parts 5 4
Throw them away with general waste in dumpsite
0 0
Category of computers
Number of Secondary schools
Number of Colleges and
universities Tot
al
Percenta ge (%)
Refurbished 90 13 103 7
Clone 19 2 21 14
Second hand non refurbished
08 0 8 5
Ncomputing 1 14 15 11
0.367
0.2770.
264E-waste threat Obsolescence
End of life management Physical depreciation
Give them to a recycler 13 10
Disassembled to reuse some parts 43 32
Donate to family, schools, employees, friends, etc.
4 3
Return to the seller on a buy-back arrangement
0 0
Other (please specify) 0 0
TOTAL 133 100
Source: Author
From the findings, application of recommended end of life management practices was found to be detrimental resulting to un-recycled computers from 51% of the institutions contributing significantly to e-waste threat. One sample t-test for un-recycled computers was done based on the following hypothesis:
H0: µunrecycled < µtotal_Dcommissioned H1: µunrecycled = µtotal_Decommissioned
The t-test yielded a p-value of 0.264 which is greater than 0.05 implying that mean of un-recycled computers is statically similar to mean of total number of computers decommissioned..The null hypothesis was therefore rejected and the alternative hypothesis accepted. This suggests that on the overall the end of life management practice for
decommissioned computers is wanting and it contributes to e-waste threat.
IX.
DESIGN
OF
THE
SUSTAINABILITY
ASSESSMENT
MODEL
This section describes the design process of the model which was achieved in three stages. Stage one involved the: design of an e-waste threat assessment model that would help quantify the e-waste threat and stage two involved design of a sustainability assessment model for low-cost computers to moderate the e-waste threat. The third stage involved the design of an overall sustainability assessment model that combined the e-waste threat assessment model and the sustainability assessment model for low-cost computers.
9.1
E-waste Threat Assessment Model
The design of this model was informed by the results presented in section V. the results indicated that physical failure and obsolescence contribute significantly to the rate of decommissioning low-cost computers for learning, thus resulting to increased e-waste amounts. One sample t-test statistics for physical failure and obsolescence were found to be 0.367 and 0.277. These results suggest that decommissioning mean due to physical failure and decommissioning mean due to obsolescence are similar to overall mean decommissioning rate of the computer population. Hence both contribute significantly to e-waste threat. Further application of recommended end of life management practices was found to be detrimental resulting to un-recycled computers contributing significantly to e-waste threat. One sample t-test statistics for un-recycled computers was found to be 0.264. This implies that mean of un-recycled computers is statically similar to mean of total number of computers decommissioned. From these findings, the researcher visualized the model as shown in figure 2:
Figure 2: E-waste threat assessment model Source: Author
G1 To reduce the amount of e-waste left idle in the institutions of learning (reduce e-waste threat) Q 1.1 How can the e-waste index of an organization (EWI) be determined?
M 1.1.1 Percentage of devices decommissioned over a specified time Q1.2 How can the e-waste management index (EWMI) of an organization be determined?
M 1.2.1 Percentage of decommissioned devices recycled and/or reused over a specified time
Q1.3 How can the e-waste threat index of an organization (EWTI) be determined?
M 1.3.1 Percentage of decommissioned devices left idle in the environment over a specified time (negative impact thus preceded by negative sign)
The working formula to attain the stated goal is:
(1) EWTI = EWI – EWMI: i.e. e-waste threat index (EWTI) is equal to total e-waste generated (E-Waste Index - EWI) minus e-waste recycled or reused (E-Waste Management Index – EWMI ). From this to achieve the goal of reducing e-waste threat we ought to focus on reducing the e-waste threat index. Applying the identified metrics the model formula becomes:
i). EWI = obc+bdc ii). EWMI = rrc
iii). EWTI = - (obc + bdc) + rrc Where:
obc = percentage of obsolete computers
bdc = percentage of broken down computers
rrc = percentage of recycled and reused computers.
The negative sign before (obc+bdc) in the formulae of EWTI indicates that this value has an overall negative effect due to addition of e-waste in the environment. The positive sign on recycled and reused means removal of e-waste has positive effect on environment
Therefore EWTI = rrc-(obc+bdc).
Ideal case EWI - EWMI = 0 i.e. all e-waste generated in properly managed.
Worst case EWI = -100% = -1 and EWMI = 0 i.e total negative effect on environment all e-waste is left in the environment.
The scale of assessment for e-waste management system is therefore -1 to 0 as depicted in figure 3
Figure 3: Scale of the e-waste threat assessment model Source: Author
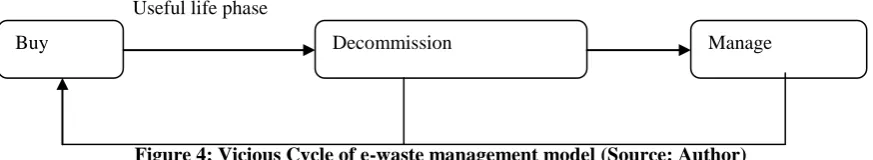
The need for sustainability of the e-waste management model emanate from the fact that the best case scenario only considers if all e-waste produced is managed in an eco-friendly manner. This essentially means that no matter how short the useful life of a computer or no matter how soon a computer becomes e-waste so long as the e-waste is managed in an eco-friendly manner the system is efficient. This is not economically viable to any institution. Considering that after decommissioning and management the institution needs to purchase other equipment for business continuity, the process amount to a vicious cycle as depicted in Figure 4.
Figure 4: Vicious Cycle of e-waste management model (Source: Author)
For sustainability this system needs to be moderated by putting in place mechanisms to optimize equipment performance and lengthening their useful life so as to reap maximum benefit from them before they are decommissioned.. the model to moderate the e-waste management model is presented next.
.
Range of e-waste management practices Worst case scenario
0
-1
Best case scenario
Buy Decommission Manage
9.2
The Sustainability Assessment Model
The design of this model commenced by investigating factors that contribute to physical failure and obsolesce both of which were found to have a significant contribution to decommissioning of computers. The factors were categorized into:
a. Obsolescence management factors (obm) b. Physical failure management factors (pfm).
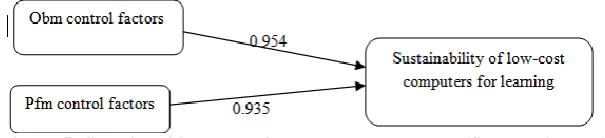
To obtain the overall correlation coefficient for obsolescence and physical failure management factors, the average spearman’s rho correlation coefficient for the factors that were found to be significant for at least two low-cost computer models was computed. Green procurement factors were considered to contribute to both obsolescence management (obm) and physical failure managemet (pfm). After computation the correlation coefficient for Obsolescence management (obm) and physical failure management (pfm) factors were found to
be 0.954 and 0.935 respectively. From these computations the model was visualized as shown in Figure 5
Figure 5: Sustainability model for low-cost computers (Source: Author)
Goal question metric (GQM) approach was then used as enumerated below to identify relevant metrics for the model.
G1 To reduce e-waste threat by controlling physical failure
Q 1.1 How can we assess the extent to which physical failure is controlled? M 1.1.1 Percentage of computers procured using a standardized green specification list M 1.1.2 Percentage of devices virtualized
M 1.1.3 Percentage of devices with power backups.
M 1.1.4 Percentage of computers protected against dust with dust covers M 1.1.5 Percentage of computers repairable maintainable by local experts G2 To reduce e-waste threat by controlling obsolescence
Q 2.1 How can we assess the extent to which obsolescence is controlled?
M 2.1.1 Percentage of computers procured using a standardized green specification list M 2.1.2 Percentage of devices virtualized
M 2.1.3 Percentage of devices on minimum 1 year warranty
M 2.1.4 Percentage age of computers purchased from a franchised local reseller/ assembler
M 2.1.5 Percentage of computers repairable maintainable by local experts
An issue based frame work was then designed to help organize the indicators/metrics around specific and relevant key sustainability issues in e-waste management. As noted by Olalla-Tárraga (2006) [ ] in an issue based frame work, Indicators are organized around specific and relevant key sustainability issues. The key sustainability issues therefore were obsolescence and physical failure since they are the issues leading to increasing e-waste. Table 7 represents the issue-based framework designed.
Table 7: Issue based framework for sustainability assessment
Issues Addressed
Target control factor obsolescen
ce
Physical failure
Green procurement factors % age of computers procured using a standardized green spec list ( %G )
X X
Virtualization Percentage of computers virtualized ( % V )
X X
Power surge %age of computers connected to uninterruptible power supply ( % PB )
X
Dust %age of computers protected against dust with dust covers (%D)
X
Expected life span % age of computers with minimum warranty of 1 year (% W )
Source: Author
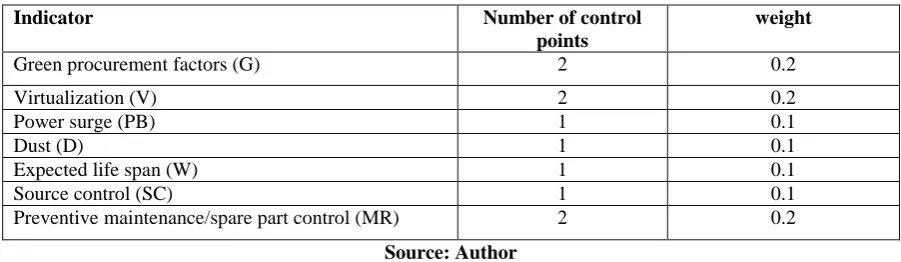
Each metric was classified according to the target issue it affects using an X symbol as shown. This classification helped to determine the weight to be assigned to each metric based on the number of target issues it affects. Taking the total number of control pints i.e. counting total numbers of X the contributing weight of each metric was determined by dividing the number of control points the metric affects (number of X’s against the metric) by 10. The weight computation for each indicator is summarized in Table 8.
Table 8: Indicator weights
Source: Author
To obtain the indicator weights we divide the number of issues the metric affect by the total number of control points (total number of X symbol) e.g. Virtualization control both physical failure and obsolescence so its contribution to e-waste threat control factors is 2 total number of control points is 10 so weight of Virtualization is 2/10 = 0.2. From this the Low-cost computers for learning Sustainability index (LCCSI) was computed as:
(2) LCCSI = (0.2 x G) + (0.2 x V) + (0.1 x PB) + (0.1 x D) + (0.1 x W) + (0.1 x SC) + (0.2 x MR) The assessment scale for this model is 0 to 1 i.e. For worst case scenario if an organization ignores all control factors and hence all percentages are zero:
(3) LCCSI = (0.2 x 0) + (0.2 x 0) + (0.1 x 0) + (0.1 x 0) + (0.1 x 0) + (0.1 x 0) + (0.2 x 0) = 0.
For best case scenario if an organization is perfect in putting in place all sustainable computing control measures hence all percentage measures are 100%
(4) LCCSI = (0.2 x 1) + (0.2 x 1) + (0.1 x 1) + (0.1 x 1) + (0.1 x 1) + (0.1 x 1) + (0.2 x 1) = 0.2 + 0.2 + 0.1 + 0.1 + 0.1 + 0.1 + 0.2 = 1
The resulting scale is presented in Figure 6
Figure 6: Assessment scale for sustainability model for low-cost computers (Source: Author)
9.3
Sustainable E-waste Threat Assessment Model for Low-cost Computers
The third stage involved combining the two models to design sustainable e-waste threat assessment model for computing sustainable e-waste management index (SWMI). The visual summary of this model is summarized in Figure 7
Source control % age of computers from a franchised local reseller/ assembler (% SC)
X
Preventive maintenance and spare part control
% age of computers maintainable and repairable by local experts(% MR)
X X
Indicator Number of control
points
weight
Green procurement factors (G) 2 0.2
Virtualization (V) 2 0.2
Power surge (PB) 1 0.1
Dust (D) 1 0.1
Expected life span (W) 1 0.1
Source control (SC) 1 0.1
Preventive maintenance/spare part control (MR) 2 0.2
Range of application of sustainable computing best practices
Worst case scenario
1
0
The final index termed sustainable e-waste management index (SEWMI) is computed as follows:
(5) SEWMI = LCCSI + EWTI Where:
EWTI = EWI-EWMI (from formula no. 1 of e-waste threat model)
LCCSI = LCCSI = (0.2 x G) + (0.2 x V) + (0.1 x PB) + (0.1 x D) + (0.1 x W) + (0.1 x SC) + (0.2 x MR) (from formula no. 2 of sustainability model)
Table 9 shows how the scales of the two models were combined to determine the sustainability assessment scale of SEWMI.
Table 9: Scale Derivation for SEWMI
Source: Author (2014)
The Assessment scale therefore for the SEWMI is -1 to 1 as depicted in Figure 8 bellow
Figure 8: SEWMI assessment scale( source Author)
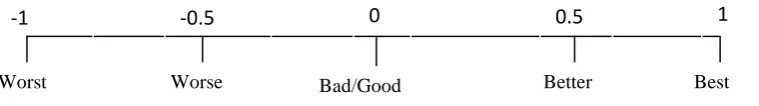
To aid in interpretation of the results for the sustainable and un-stainable regions the scale was transformed into a likert scale as presented in Figure 9.
Figure
9: Likert Scale for interpreting result from institutions (Source: Author)The 0 score is described as bad/good because it is obtained where an institution is doing very well in one aspect but doing worst in another aspect there are two causes of this as stipulated below
LCCSI = 1(best) and EWTI = -1 (worst) from this SEWMI = 1 – 1= 0.
LCCSI = 0 (worst) and EWTI = 0 (best) from this SEWMI = 0 + 0 = 0
LCCSI
EWTI
SEWMI
Maximum (best case scenario or Ideal
situation)
1
0
1+0 = 1
Minimum (worst case scenario)
0
-1
0 -1 = -1
Unsustainable region Sustainable region
0
-1
1
Better Bad/Good
Worst Worse Best
Case (i) means an institution applies the best sustainable computing techniques to control decommissioning rate of computers but it is totally oblivious of e-waste threat and therefore any decommissioned computer is kept in the institution or thrown away in dumpsites. Case (ii) means an institution is very conscious about e-waste threat and applies the best e-waste management techniques available but it is very oblivious about sustainable
X.
SUSTAINABILITY ASSESSMENT MODEL IMPLEMENTATION
The model was implemented as an online tool using client server architecture. The tool is available at:
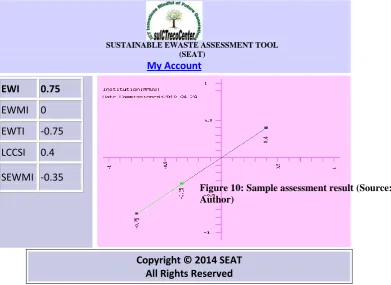
http://www.sustainableictforafrica.org/. Upon access, the user is presented with a login/registration page where they are required to register if they are first time users or login if already registered. Once logged in the user is presented with the home page from where they can register the institution from which the computers are being assessed by clicking on the institutions menu. After institution registration the user then proceeds with device assessment by clicking on the devices menu to enter the required data. After entering the required data the user may proceed with the assessment using the SEWMI menu. The assessment results will be presented as shown in figure 10
Figure 10: Sample assessment result (Source: Author)
From this sample assessment result, the institution has an e-waste index of 0.75, e-waste management index is 0, e-waste threat index is -0.75, low-cost computers sustainability index is 0.4 and the overall sustainable e-waste management index is -0.35. The institution has an overall unsustainable index due to poor e-waste management practice and poor application of sustainable computing techniques.
XI.
CONCLUSION
The proposed tool may help institutions to manage e-waste right from procurement to decommissioning of computers for learning. This is achieved by use of green standards at procurement, failure rate control during operation and green disposal practices at decommissioning stage. The metrics used by the tool can be expanded by doing more work to identifying metrics for assessing sustainability in the IT sector.
REFERENCES
[1] Karaborni, N. (2005). For an Inclusive, People-Centered, Development Oriented and Knowledgeable Information Society for All, NGO / Civil Society (A Survey Report). United Nations Department of
Economic and Social Affairs. Retrieved from
http://unpan1.un.org/intradoc/groups/public/documents/un/unpan022256.pdf
[2] Farrell G. & Shafika I. (2007). Survey of ICT and Education in Africa (A World Bank Report). Washington, DC: infoDev / World Bank. Retrieved from http://www.infodev.org/en/Publication.353.html
SUSTAINABLE EWASTE ASSESSMENT TOOL (SEAT)
My Account
EWI
0.75
EWMI 0
EWTI
-0.75
LCCSI
0.4
SEWMI -0.35
[3] Christian, G., E. (2012). Legal working paper series on legal empowerment for sustainable development: End of Life management of waste electrical and electronic equipment for sustainable development. Canada: centre for international sustainable development law, faculty of law McGill University.
[4] UNEP. (2009). Recycling – from E-Waste to Resources (UNEP Report). Retrieved from http://www.unep.org/PDF/PressReleases/E-Waste_publication_screen_FINALVERSION-sml.pdf [5] Miles, M. B., & Huberman, A. M. (1993). Qualitative Data Analysis: a Sourcebook for New Methods.
Newbury Park, CA.: SAGE publications Inc.
[6] Odongo, J., R. (2010). Beneath the Bandwidth: Exploring Africa’s Information Divide. 11th DIS Annual Conference 2010, 2nd – 3rd September, Richardsbay, University of Zululand, South Africa
[7] James, J. (2002). Low-cost information technology in developing countries: current opportunities and emerging possibilities. Habitat International Volume 26, Issue 1, January 2002, Pages 21-31
[8] Gartner, (2003). Extending the life cycle of desktop PCs won't necessarily save money on total cost of ownership. Media release, 16 September, 2003. Gartner Group. Retrieved from www.gartner.com [9] SchoolNet Africa, (2004). Treat refurbs and Africa with respect, Towards a framework on refurbished
computers for African schools(A workshop Report). Retrieved http://schoolnetafrica.org/fileadmin/resources/Refurbished_computers_ExecSum.pdf
[10] Pal J. Patra R. Nedevschi S. Plauche M. Pawar U.(2009), The Case of the Occasionally Cheap Computer: Low-cost Devices and Classrooms in the Developing World Information Technologies and International Development, Volume 5, Number 1.
[11] Wayan, V. (2010). Updated Quick Guide to Low-Cost ICT Devices for Educational Systems in the Developing World. An infoDev briefing sheet. Washington, DC: infoDev / World Bank. Retrieved from http://www.infodev.org/infodev-files/resource/InfodevDocuments_891.pdf
[12] James, J. (2010). New Technology in Developing Countries: A Critique of the One-Laptop-Per-Child Program. Journal of Social Science Computer Review (SSCR), 28(3) 381-390
[13] Burgess, A., (2013). The Oxford Dictionary (online version). Retrieved from oxforddictionaries.com/definition/english/. Oxford University Press
[14] Sahni, S., Boustani, A., Gutowski, T., G., Graves, S., C. (2010). Reusing Personal Computer Devices - Good or Bad for the Environment? Sustainable Systems and Technology (ISSST), 2010 IEEE International conference
[15] Swann, P. (2010). E-waste and software corner-cutting, Nottingham University Business School, 2010. [16] Plepys, Andrius (2004). Environmental Implications of Product Servicising (doctoral dissertation).
International Institute for Industrial Environmental Economics Lund, Lund University
[17] Gartner, (2003). Extending the life cycle of desktop PCs won't necessarily save money on total cost of ownership. Media release, 16 September, 2003. Gartner Group. Retrieved from www.gartner.com [18] Bessinger (2004). How to set up and operate a successful computer refurbishment centre in Africa – (A
planning and management guide). UK Department for International Development (DFID).
[19] SchoolNet Africa, (2004). Treat refurbs and Africa with respect, Towards a framework on refurbished computers for African schools(A workshop Report). Retrieved http://schoolnetafrica.org/fileadmin/resources/Refurbished_computers_ExecSum.pdf
[20] Open Research. (2004). Paying the price? A Total Cost of Ownership comparison between new and refurbished PCs in the small business, NGO and school in Africa (TCO Study). Retrieved from http://www.openresearch.co.za
[21] Cornell University. (2005). Sustainable Computing Definition. Retrieved from http://computing.fs.cornell.edu/Sustainable/fsit_definition.cfm
[22] Misra, K. B. (2011). Role of Performance Engineering in Sustainable Development. Principles of Sustainable Development Volume 3, Encyclopedia of Life Support Systems pg 129. Reliability Engineering Center, Indian Institute of Technology, Kharagpur, India.
[23] Harmon R. R., and Auseklis N. (2009). Sustainable IT services: Assessing the impact of green computing practices. International Conference on Management of Engineering Technology, page 1707--1717.