Abstract—With the higher amount of buildings and infrastructures in Bangkok, Thailand, the number of construction and demolition (C&D) waste is increasing continuously. These wastes, if not completely recycled, will create the environmental problems. This research paper concentrates on the use of a system dynamics modeling technique to develop a C&D waste recycling model. Data and related relationships were generated to develop the simulated equations to simulate the model to reflect real practices of the construction industry in Bangkok, Thailand. The simulation results reveal the improved C&D waste recycled over time.
Index Terms—Construction and demolition waste, recycling,
system dynamics modeling
I. INTRODUCTION
Since higher amount of building and infrastructure has been constructed in Bangkok, Thailand, the number of construction and demolition (C&D) waste is increasing continuously [1]. The C&D wastes, comprising of concrete, brick, metal, ceramics, roofing, gypsum, and wood, can be classified into two categories: recyclable (70%) and non-recyclable (30%) wastes [2]. It is, however, found that not all the recyclable wastes are yet recycled, and are dumped into landfills. The improvement of C&D waste management, thus, helps reducing the amount of C&D wastes and landfill requirement [3].
Reference [2] mentioned an increasing trend of C&D waste generation of 26% from 2003-2006, following the increasing populations in Bangkok, Thailand. As C&D waste is one of the main solid waste generators in Bangkok, its impact on the environment has become an imperative issue to the stakeholders [4]. Past research has mainly focused on the separate aspects of waste management, such as waste reduction, reuse, and recycle [5]. In this research paper, a dynamic simulation model is developed, based on system dynamics methodology, to strategically plan the C&D waste management in Bangkok. The relationships between major factors inherently involved in C&D waste management, such as labors, machines, and related costs are considered. It is expected that the dynamic model assists decision makers to better understand and make decisions regarding the C&D waste recycling program.
Manuscript received April 15, 2013; revised June 14, 2013.
T. Chinda is with the School of Management Technology, Sirindhorn International Institute of Technology, Thammasat University, 131 Tiwanont Rd. Bangkadi, Muang, Pathumthani 12000, Thailand (e-mail: [email protected]).
II.THE DEVELOPMENT OF CONSTRUCTION AND DEMOLITION
WASTE DYNAMIC MODEL
In this paper, the system dynamics modeling is used to develop the C&D waste recycling model. The model consists of four sectors, namely “Cost”, “Recycled Waste”, “Labor and Machine”, and “Leftover of C&D Waste” sectors. Details of each sector are as following.
A. The Cost Sector
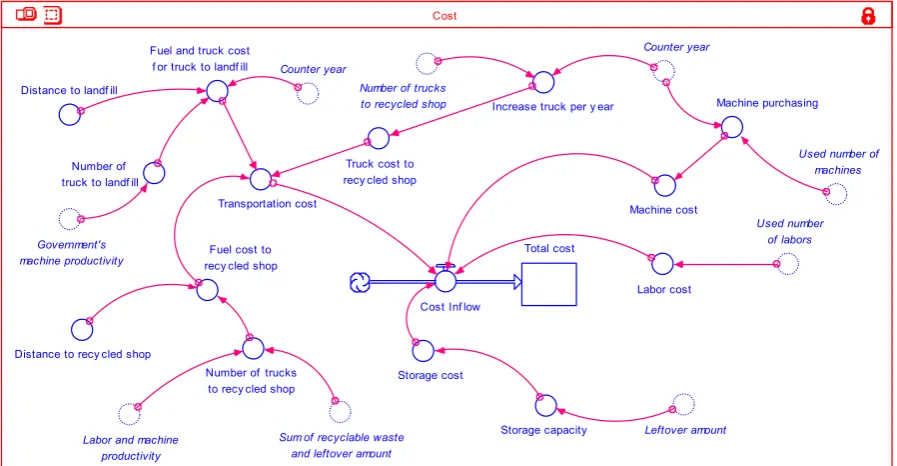
Fig. 1 shows the “Cost” sector model. The “total cost” is a function of the “cost inflow”, which is the summation of the “transportation cost”, the “labor cost”, the “machine cost”, and the “storage cost”.
The “transportation cost”, as in (1), is based on the amount of trucks with their fuel costs. The “labor cost” depends mainly on the amount of labors used in the sorting and recycling processes, see (2). The “machine cost”, as in (3), in the same way, increases as the number of machine used in the sorting process increases. The “storage cost” refers to the cost the company pays to store the C&D waste before transferring to the next recycling steps, see (4).
Transportation cost = Fuel_cost_to_recycle_shop+ Truck_cost_to_recycle_shop+Fuel_and_truck_cost_for_ truck_to_landfill (1) Labor cost = Exact_used_number_of_labor*300*250 (2) Machine cost = ((MEAN(28620,39725))*30)*
Machine_ purchasing (3) Storage cost = DELAY(Storage_capacity*(150*12),1,0) (4)
B. The Labor and Machine Productivity Sector
The “Labor and Machine Productivity” sector (as shown in Fig. 2) describes the labors and machines used in the sorting and recycling processes. The number of labors and machines are increasing as the recycling program proceeds, see (5), (6). These amount of labors and machines dictate the labor and machine costs the company spends. They are, however, constant when the total labor and machine productivity exceeds the amount of C&D wastes to be recycled, or when the “cost inflow” exceeds the “environmental budget”, see (7)-(9).
This environmental budget is the upper bound of budget the company could spend to implement the C&D waste recyling program. Based on references [6], [7], 1.8 percent of total budget is used to determine the upper bound, which is 40 billion Baht in this case.
The Development of the Construction and Demolition
Waste Dynamic Model
Used number of labors
Fuel and truck cost f or truck to landf ill
Used number of machines
Total cost
Cost Inf low Transportation cost
Number of trucks to recy cled shop Fuel cost to recy cled shop
Distance to recy cled shop Distance to landf ill
Machine cost Number of
truck to landf ill
Sum of recyclable waste and leftover amount Government's
machine productivity
Labor and machine productivity
Machine purchasing
Labor cost
Leftover amount
Increase truck per y ear
Number of trucks to recycled shop
Storage cost
Storage capacity
Counter year
Truck cost to recy cled shop
Counter year
Cost
Fig. 1. The cost model.
Maximum labor productiv ity
Used number of labors
Maximum number of machines purchased
Counter year
Env ironmental budget
Actual labor productiv ity
Budget
Maximum number of labors hired Maximum machine
productiv ity Leftover amount
Actual machine productiv ity
Limited budget f or machine
Maximum number of labor hired f or large sized company
Maximum number of labor hired f or medium sized company
Counter y ear
Cost Inflow
Limited budget f or labor
Actual total productiv ity Net amount of
recyclable waste
Used number of machines Actual number
of labor Number of labor with
upper bound budget
Counter machine Lef tov er amount
each y ear
Used number of machines
Labor and machine productiv ity
Sum of recy clable waste and lef tov er amount Used machines
productiv ity
Amount of waste f or labor sorting
Comparison in number of labors
Number of machine with upper bound budget
Actual number of machine
Labor and machine
Fig. 2. The labor and machine productivity model.
Number of labor = MAX(history(Number_of_labor_ with_upper_bound_budget,Counter_year),HISTORY (Number_of_labor_with_upper_bound_budget,
Counter_year-1)) (5) Number of machine = MAX(history(Number_of_
machine_with_upper_bound_budget,Counter_year), HISTORY(Number_of_machine_with_upper_bound_ budget,Counter_year-1),HISTORY(Number_of_
machine_with_upper_bound_budget,Counter_year-2)) (6) Actual labor productivity = Actual_number_of_labor*
(0.026*250) (7)
Actual machine productivity = Actual_number_of_
machine*(0.508×8×250) (8) Actual total productivity = Actual_labor__productivity+ Actual_machine_productivity (9)
C. The Leftover Sector
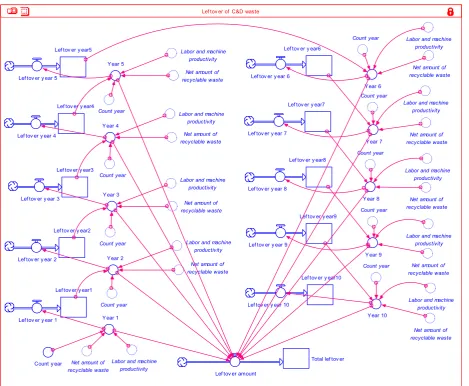
Leftover model. The leftover amounts at the end of each year are calculated from the total amount of C&D wastes and the labor and machine productivity, see (10). The difference between the amount of wastes and the labor and machine productivities is the leftover of year 1, see (11). If the leftover amount in year 1, together with the amount of wastes generated in year 2, can be managed by labors and machines in year 2, then the leftover in year 2 is zero. This is vice versa if the labor and machine productivity is less than the amount of wastes to be sorted, as in (12).
Labor and machine productivity = Maximum_labor_
productivity+Maximum_machine_productivity (10) Leftover year 1 = IF(Count_year=1)THEN(Net_amount_ of_recyclable_waste-(Labor_and_machine_productivity)) ELSE (0) (11) Leftover year 2 = IF(Count_year=2)THEN IF(Net_
amount_of_recyclable_waste+Leftover_year1<Labor_ and_machine_productivity)THEN(0)ELSE(Net_amount_ of_recyclable_waste+Leftover_year1-Labor_and_
machine_productivity)ELSE(0) (12)
Lef tov er y ear3
Labor and machine productivity Year 1 Lef tov er y ear 3
Lef tov er y ear10
Lef tov er y ear 10 Lef tov er y ear4
Labor and machine productivity Labor and machine
productivity Labor and machine
productivity Labor and machine
productivity
Labor and machine productivity
Labor and machine productivity
Labor and machine productivity
Labor and machine productivity
Labor and machine productivity
Net amount of recyclable waste
Year 2
Net amount of recyclable waste
Lef tov er y ear1
Net amount of recyclable waste
Net amount of recyclable waste
Total lef tov er
Lef tov er amount Y ear 3
Net amount of recyclable waste
Net amount of recyclable waste
Net amount of recyclable waste Lef tov er y ear 4
Lef tov er y ear5
Count y ear Lef tov er y ear 1
Lef tov er y ear2
Lef tov er y ear 2 Lef tov er y ear 5
Lef tov er y ear6
Lef tov er y ear 6
Lef tov er y ear7
Lef tov er y ear 7
Lef tov er y ear8
Lef tov er y ear 8
Lef tov er y ear9
Lef tov er y ear 9 Year 4
Year 5
Year 6
Year 7
Year 8
Year 9
Year 10
Net amount of recyclable waste
Net amount of recyclable waste
Net amount of recyclable waste Count year
Count year Count year
Count year Count year
Count year
Count year
Count year
Count year
Lef tov er of C&D waste
Fig. 3. The Leftover model.
D.The Recycled Waste Sector
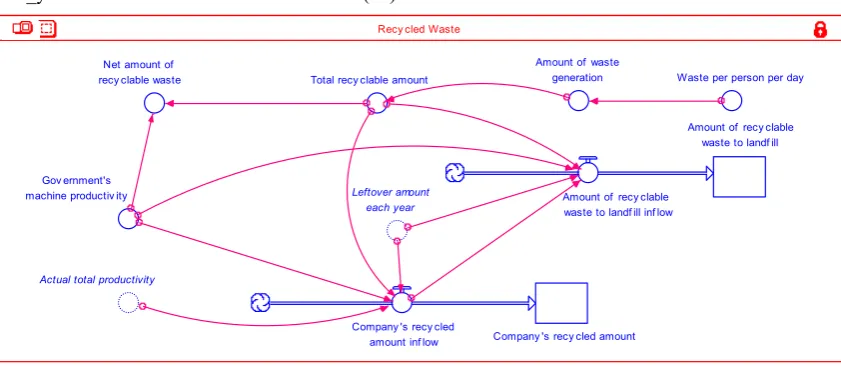
Fig. 4 illustrates the relationships between the recycled waste and landfill. The “company’s recycled amount” or CRA is a function of the “actual total productivity”, the “leftover amount each year”, the “government’s machine productivity”, and the “total recyclable amount”, see (13)-(16). The amount of wastes recycled depends mainly on the company’s total productivity. Once all the C&D wastes are recycled, the total productivity remains constant, and the recyclable wastes to landfill becomes zero, as in (17). CRA = IF((Total_recyclable_amount-Government's_ machine_productivity+Leftover_amount_each_year) <Actual_total_productivity)THEN((Total_recyclable_
amount-Government's_machine_productivity+Leftover_ amount_each_year)ELSE(Actual_total_productivity) (13) Actual total productivity = Actual_labor_productivity+ Actual_machine_productivity (14) Leftover amount each year = DELAY(Leftover_
amount,1,0) (15)
Total recyclable amount = Amount_of_waste_ generation×0.7
(16) Amount of recyclable waste to landfill = (Total_
amount_each_year (17)
Gov ernment's machine productiv ity
Net amount of recy clable waste
Amount of waste generation
Total recy clable amount Waste per person per day
Company 's recy cled amount Company 's recy cled
amount inf low Actual total productivity
Leftover amount each year
Amount of recy clable waste to landf ill
Amount of recy clable waste to landf ill inf low
Recy cled Waste
Fig. 4. The Recycled Waste model.
III. THE DYNAMICS SIMULATION RESULTS
The dynamic model of C&D waste is simulated with the STELLA program. The simulation results, as illustrated in Fig. 5 and Table I, show that the amount of recycled waste increases as time increases. This is due to the increases of labors and machines.
Fig. 5. The graphical results of the C&D waste dynamic model.
TABLEI:THE DYNAMIC SIMULATION RESULTS
The company is capable of sorting all the recyclable waste (amount of waste initiated in a year plus the leftover) in nine years. This requires 3,060 labors and 240 machines (see Table I). The amount of recycled waste sorted in year 10 then drops to 197,103.50 tons to cover only the amount of waste initiated in that year (with the leftover amount of zero).
It is investigated that the labor and machine productivities are constant after year 9, without further hiring and purchasing, respectively. The total cost after year nine is, therefore, kept constant (see Table II). From year 10 onwards, some labors are, consequently, transferred from the sorting and recycling activities to other related activities (due to
decrease total waste to be sorted).
TABLEII:THE LABOR,MACHINE,AND TOTAL COSTS
IV. CONCLUSION
The dynamic model of C&D waste is developed using the system dynamics modeling technique. The simulation results reveal the increase amount of recycled wastes over time, implying the decrease amount of waste to landfills. It must, however, be noted that the successful of C&D waste recycling program comes from the cooperation between the government and the construction industry.
There are limitations in this study. Factors used in the dynamic model, such as are the inflation and the employment rates; derive from data in Bangkok, Thailand. Different data may affect to simulation results. The developed model, however, can be adapted in different environments by adjusting data accordingly to the specific situations.
ACKNOWLEDGMENT
The authors would like to thank the Office of Research Administration, Thammasat University, for the support of this study.
REFERENCES
[1] Pollution Control Department of Thailand. (December 2010). Solid waste generation in Thailand. [Online]. Available: http://www.pcd.go.th/info_serv/waste_wastethai48_53.html.
[2] K. Sorpimai, “Estimation of construction and demolition waste: Case of Bangkok metropolitan region,” M.Sc. thesis, Asian Institute of Technology, Thailand, 2008.
[3] J. L. Hao and D. Scott, “A simulation model for construction joint venture projects in China,” Journal of Construction Research, vol. 2, no. 1, pp. 103-107, 2001.
Construction and Architectural Management, vol. 17, no. 5, pp. 476-492, 2010.
[5] N. Lawson, I. Douglas, S. Garvin, C. McGrath, D. Manning, and J. Vetterlein, “Recycling construction and demolition wastes – A UK perspective,” Environmental Management and Health, vol. 12, no. 2, pp. 146-157, 2001.
[6] Bureau of the Budget. (March 2011). Thailand’s budget in brief fiscal
year 2011. [Online]. Available: http://www.bb.go.th/FILEROOM/CABBBIWEBFORMENG/DRAW
ER14/GENERAL/DATA0000/00000025.PDF.
[7] Strategy and Evaluation Department. (March 2012). Bangkok 12 year development plan phase 2 (B.E. 2556-2559). [Online]. Available: http://office.bangkok.go.th/pipd/02_Plan%20BMA/01_Plan%20Deve lopment%20BMA/plan%20development%2012%20year%20time%20 2%20(%202556-2559).pdf.
Thanwadee Chinda was born in Ratchaburi, Thailand
on 31st March 1978. She has received her Ph.D. in
engineering management from Griffith University, Gold Coast, Australia in 2008.
She has currently worked as a lecturer at Sirindhorn International Institute of Technology, Thammasat University, Pathumthani, Thailand. She has published a number of journal papers in the International Journal of Occupational Safety and Ergonomics, Engineering Management Journal, and Songklanakarin International Journal of Science and Technology.