474 Abstract— Nowadays numerical and Artificial Neural Networks (ANN) methods are widely used for both modeling and optimizing the performance of the manufacturing technologies. Optimum machining parameters are of great concern in manufacturing environments, where economy of machining operation plays a key role in competitiveness in the market.
In this paper, the selection of optimal machining parameters (i.e., spindle speed, depth of cut and feed rate) for face milling operations was investigated in order to minimize the surface roughness and to maximize the material removal rate. Effects of selected parameters on process variables (i.e., surface roughness and material removal rate) were investigated using Response Surface Methodology (RSM) and artificial neural networks. Optimum machining parameters were carried out using RSM and compared to the experimental results. The obtained results indicate the appropriate ability of RSM and ANN methods for milling process modeling and optimization.
Index Terms: Milling operations, Optimization, Modeling, Response Surface Methodology, Artificial Neural Network
I. INTRODUCTION
The selection of efficient machining parameters is of great concern in manufacturing industries, where economy of machining operations plays a key role in the competitive market. Many researchers have dealt with the optimization of machining parameters.
The RSM is a dynamic and foremost important tool of Design of Experiment (DOE) where in the relationship between process output(s) and its input decision variables, it is mapped to achieve the objective of maximization or minimization of the output properties. RSM was successfully applied for prediction and optimization of cutting parameters [1,2]. M.S. Shunmugam et al, investigated selection of optimal conditions in multi-pass face-milling using a genetic algorithm [1]. Dae Kyun Baek et al, investigated optimization of feed rate in a face milling operation using a surface roughness model [4]. Prediction of surface roughness in CNC face milling using neural networks and Taguchi’s design of experiments were investigated by P.G. Benardos et al[5]. Jae-Seob Kwak used Taguchi and RSM for geometric error in surface grinding process [6]. The influence of feed rate and cutting speed on cutting forces, surface roughness and tool–chip contact length during face milling were investigated by I. Korkut et al. [7]. Multidisciplinary optimization of a car component under NVH and weight constraints using RSM was investigated by M. Azadi et al. [8].
In this study, based on experimental data in milling process,
Response surface methodology and artificial neural network were employed to develop prediction models for surface roughness (Ra) and material removal rate (MRR).Then, the results were compared. Response surface methodology is used to find the optimal cutting parameters. To evaluate the accuracy of results, several experiments were conducted and obtained results were investigated.
II. EXPERIMENTAL PROCEDURES
To investigate how process parameters affect on process state variables (i.e., Ra and MRR), several experiments were conducted. A central composite design including three levels of factors for finishing and rough machining operations was used. The feed rate, spindle speed and depth of cut considered as independent input variables. Linear and second order polynomials were fitted to the experimental data for obtaining the regression equations. The lack of fit test, variance test and other adequacy measures were used in selecting optimum models.
The experiments have been carried out on a Hurco 5HP CNC vertical milling center equipped with a φ 60 mm four-flute face-milling cutter with grade 1C28M40 inserts. The workpiece material used in these tests was 6061-T6 Aluminum. Table 1 shows milling machine input variables and experiment levels.
All specimens in this experiment were conducted using Sunoco Sunicut 151 cutting fluid.
TABLE1:PROCESS VARIABLE AND EXPERIMENTAL LEVELS
Modeling and Optimization of Milling Process
by using RSM and ANN Methods
M.R. SOLEYMANI YAZDI, A. KHORRAM
Process parameters
Milling operations
Feed rate, F, (mm/min)
Spindle speed, S,
(rpm)
Depth D, (mm)
Finishing
500 4000 0.25
1000 6000 0.5
2000 8000 1
Roughing
3000 4000 2
4250 6000 3
475 III. PROCESS MODELING AND DISCUSSION
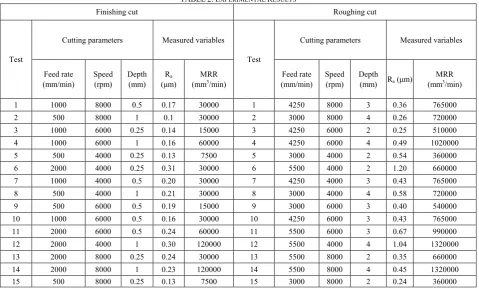
Once the cutting operations are accomplished, the surface roughness, Ra , is measured. Ra was measured using a portable Mitutoyo Surftest Profilometer with a roughness cut-off of 0.8 mm. Material removal rate calculated with equation 1. The experimental results for finishing and rough machining are shown in Table 2.
MRR = × ×F d D (1) where F, d and D are respectively the feed rate, the depth of cut and the tool diameter.
In this section, by using RSM and ANN methods, the analysis of experimental results which obtained during rough machining and finishing are carried out and the results are compared.
A. Modeling by Using Rsm
By using "T" test, significance of each parameter effects and their interactions on the process were studied. Response surface method was used to fit linear and second order polynominals on experimental data [9].
TABLE2:EXPERIMENTAL RESULTS
1) Rough machining case
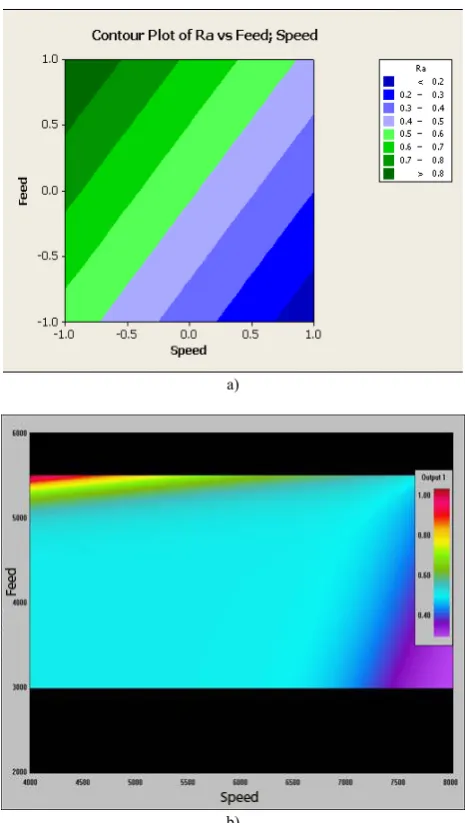
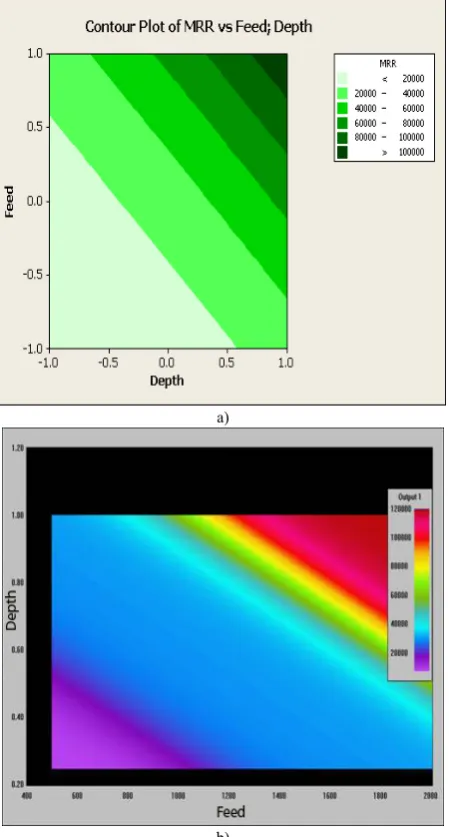
Considering surface roughness model, statistical analysis shows that the spindle speed and feed rate are the significant model terms. Fig. 1a shows that the increased speed and decreased feed rate lead to decrease Ra. Also, statistical analysis for MRR model indicates the feed rate, depth of cut and interaction of them are significant factors. Fig. 2a indicates that the increased depth of cut and feed rate result in increase MRR.
The final developed models in terms of significant coded factors are shown below:
0.5127+0.6190 F- 0.02130 S
Ra
=
(2)765000+225000 F +225000 D +75000 F D
MRR
=
×
×
× ×
(3)2) Finishing case
Fig. 3a shows the effect of process parameters on the Ra. Statistical analysis for MRR model shows that the feed rate, depth of cut, second order effect of feed rate, second order effect of depth of cut and the interaction of feed rate and depth of cut are the most important terms of the obtained model. Fig. 4a shows that the increased feed rate and depth of cut result in an increase in the MRR.
The final developed models in terms of significant coded factors are shown below:
0.19400+0.5600 F- 0.02800 S
Ra
=
(4) 2 229571+27000 F +27000 D +8571 F 8571 D 16875 F D
MRR
=
×
×
× + × +
× ×
(5)3) Validation of proposed models
Figs 5 and 6 show the residual distribution diagrams for finishing and rough machining. The residuals are distributed around normal line. Therefore, the developed mathematical models are appropriate models for predicting and investigating parameters effect.
Finishing cut Roughing cut
Test
Cutting parameters Measured variables
Test
Cutting parameters Measured variables
Feed rate (mm/min) Speed (rpm) Depth (mm) Ra
(μm)
MRR (mm3/min)
Feed rate (mm/min)
Speed (rpm)
Depth
(mm) Ra (μm)
MRR (mm3/min)
1 1000 8000 0.5 0.17 30000 1 4250 8000 3 0.36 765000
2 500 8000 1 0.1 30000 2 3000 8000 4 0.26 720000
3 1000 6000 0.25 0.14 15000 3 4250 6000 2 0.25 510000
4 1000 6000 1 0.16 60000 4 4250 6000 4 0.49 1020000
5 500 4000 0.25 0.13 7500 5 3000 4000 2 0.54 360000
6 2000 4000 0.25 0.31 30000 6 5500 4000 2 1.20 660000
7 1000 4000 0.5 0.20 30000 7 4250 4000 3 0.43 765000
8 500 4000 1 0.21 30000 8 3000 4000 4 0.58 720000
9 500 6000 0.5 0.19 15000 9 3000 6000 3 0.40 540000
10 1000 6000 0.5 0.16 30000 10 4250 6000 3 0.43 765000
11 2000 6000 0.5 0.24 60000 11 5500 6000 3 0.67 990000
12 2000 4000 1 0.30 120000 12 5500 4000 4 1.04 1320000
13 2000 8000 0.25 0.24 30000 13 5500 8000 2 0.35 660000
14 2000 8000 1 0.23 120000 14 5500 8000 4 0.45 1320000
476 a)
b)
Fig. 1: Effects of feed rate and speed on the Ra (rough machining). a) via
RSM, b) via ANN
a)
b)
Fig. 2: Effects of feed rate and depth of cut on the MRR (rough machining). a) via RSM, b) via ANN
a)
b)
Fig. 3: Effects of feed rate and speed on the Ra (finishing). a) via RSM, b)
477 a)
b)
Fig. 4: Effects of feed rate and depth of cut on the MRR (finishing). a) via RSM, b) via ANN
Fig. 5- a: Residual distribution of Ra (finishing)
Fig. 5-b: Residual distribution of MRR (finishing)
Fig. 6-a: Residual distribution of Ra (rough machining)
478
B. Modeling by Using Ann
Neural networks are one of the most proper tools in artificial intelligence which are widely used in industry applications. Fifteen experimental data are used for modeling. The feed rate, speed and depth of cut were three parameters considered as network inputs. To have an accurate and reliable model, surface roughness and material removal rate are separately estimated by using a Perceptron neural network. Several network architectures, which are not presented in this study, are tested. The appropriate architecture with one hidden layer is selected, 3×2×1. Results are presented and discussed in the following sections.
1) Rough machining case
The obtained results of ANN for Ra model are shown in Fig. 1b. An increase in speed and a decrease in feed rate lead to a decrease in Ra. As shown in Fig. 2b, the MRR is increased by multiplying the values of feed rate and depth of cut.
2) Finishing case
Fig. 3b shows the effects of process parameters on the Ra. The obtained results of ANN for the MRR are shown in Fig. 4b. Results indicate that an increase in the depth of cut and feed rate leads to an increase in the MRR.
3) Validation of proposed models
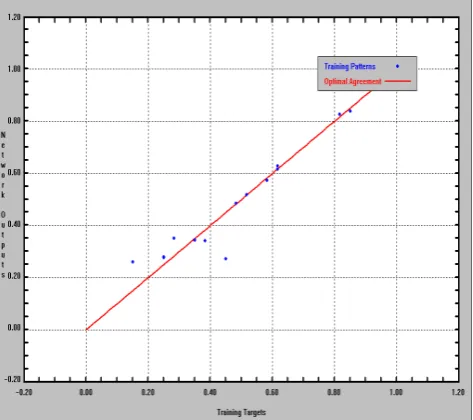
Many tools are available for testing the modeling capacity. In this study, Targets/Network outputs plot are used for checking the performance of the proposed models.
Figs 7 and 8 show Targets/Network outputs plot of the proposed neural models, (i.e., the material removal rate and surface roughness).
As shown in Figs 7 and 8, the residuals are appropriately distributed around “X=Y” line .The closer the points fall to the “X=Y” line, the stronger the model
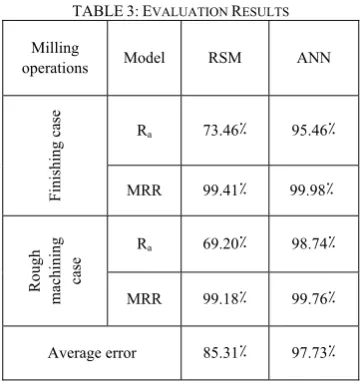
The results of RSM are very like to those of ANN. However, the data coverage of the proposed ANN is more. It indicates the better accuracy of the proposed neural model than the RSM one. The results are presented in Table 3.
Fig.7-a: Targets/Network Outputs plot of Ra(finishing)
Fig.7-b: Targets/Network Outputs plot of MRR (finishing)
Fig.8-a: Targets/Network Outputs plot of Ra (rough machining)
479 TABLE3:EVALUATION RESULTS
Milling
operations Model RSM ANN
Finishing case
Ra 73.46٪ 95.46٪
MRR 99.41٪ 99.98 ٪
Rough
machining
case
Ra 69.20٪ 98.74٪
MRR 99.18٪ 99.76٪
Average error 85.31٪ 97.73٪
IV. PROCESS OPTIMIZATION
Response surface methodology indicates areas in the design region where the process is likely to give desirable results. Simultaneous consideration of multiple responses involves first building an appropriate response surface model for each response and then trying to find a set of operating conditions that in some sense optimizes all response or at least keeps them in desired ranges [10].
In this study, process optimization was carried out for both rough machining and finishing simultaneously by using RSM method. Then, the obtained results were evaluated experimentally.
A. Rough Machining Case
In optimization of rough machining case, the material removal rate is attended more than surface roughness. Fig. 9a shows optimum parameters as coded. The maximum material removal rate (up to1320000 mm3/min) and the surface
roughness equal 0.89 µm are obtained with 99% confidence coefficient (see Table 4).
TABLE4:OBTAINED OPTIMIZATION VALUES OF RSM
B. Finishing Case
For minimizing surface roughness, Ra is considered to be more important than MRR. Fig. 9b shows optimum parameters as coded.
The optimum machining parameters and the
corresponding state variables are shown in Table 4.
Furthermore, to evaluate the modeling capacity of the proposed models, several experiments were conducted.
Table 5 shows the experimental data and the validation test. The obtained results have shown the appropriate ability of the RSM for process optimization.
TABLE5:OBTAINED OPTIMIZATION VALUES OF RSM
Error ( )٪ Estimated data with RSM Experimental data Operation 14 0 Ra=0.8947
MRR=132×104
Ra=1.04
MRR=132×104 Rough machining case 0 0.6 Ra=0.11
MRR=29800 Ra=0.11
MRR=30000 Finishing case
a)
b)
Fig. 9: Optimization parameters (coded) a) Rough machining case, b) Finishing case
MRR (mm3/min)
Ra
(μm) Depth (mm) Speed (rpm) Feed rate (mm/min) Operation 1320000 0.89 4 4000 5000 Rough machining case 29800 0.11 1 8000 500
480 V. CONCLUSION
Based on the conducted experiments and accomplished analysis, the following conclusions can be made:
1) The speed and feed rate are the most significant factors in surface roughness model.
2) The depth of cut and feed rate and their interaction are significant factors in the material removal rate model. 3) The MLP network and RSM provide a very good
process modeling. In addition, the former provided the better data coverage value.
4) The excellent accuracy (nearly null error) of the RSM optimization procedure is observed during rough machining and finishing.
REFERENCES
[1] P.G. Benardos, G.-C. Vosniakos, " Predicting surface roughness in machining: a review ", International Journal of Machine Tools & Manufacture 43 (2003) 833–844.
[2] Indrajit Mukherjee, Pradip Kumar Ray, "A review of optimization techniques in metal cutting processes ", Computers & Industrial Engineering 50 (2006) 15–34.
[3] M.S. Shunmugam , S.V. Bhaskara Reddy, T.T. Narendran," Selection of optimal conditions in multi-pass face-milling using a genetic algorithm ", International Journal of Machine Tools & Manufacture 40 (2000) 401–414
[4] Dae Kyun Baek, Tae Jo Ko, Hee Sool Kim, " Optimization of feedrate in a face milling operation using a surface roughness model ", International Journal of Machine Tools & Manufacture 41 (2001) 451–462.
[5] P.G. Benardos, G.C. Vosniakos," Prediction of surface roughness in CNC face milling using neural networks and Taguchi’s design of experiments ", Robotics and Computer Integrated Manufacturing 18 (2002) 343–354
[6] Jae-Seob Kwak, " Application of Taguchi and response surface methodologies for geometric error in surface grinding process ", International Journal of Machine Tools & Manufacture 45 (2005) 327–334
[7] I. Korkut, M.A.Donertas, " The influence of feed rate and cutting speed on the cutting forces, surface roughness and tool–chip contact length during face milling ", Materials and Design 28 (2007) 308–312 [8] M. Azadi, Sh. Azadi, M. Moradi and F. Zahedi," Multidisciplinary
optimization of a car component under NVH and weight constraints using RSM", Accepted in International Journal of Vehicle Noise and Vibration, Volume 5, No.4, July 2009
[9] A.I. Khuri, J.A. Cornell, Response Surfaces Design and Analysis, 2nd ed., Marcel Dekker, New York, 1996.
[10] Myers RH, Monotgormery D.C.,”Response Surface Methodology”, J.Wiley & Sons Interscience Publication,(2002)
Dr. Mohammad Reza Soleymani Yazdi, Assistant Professor at Imam Hussein University, Tehran, Iran. He fulfilled his PhD and MSc in mechanical engineering at Laval University, Quebec, Canada. (Email: [email protected]).