Abstract—This paper presents the validation of two daylight dynamic predictive metrics, obtained through simulation with DaySim 3.2 tool: Daylight Autonomy (DA) and Continuous Daylight Autonomy (DAC). To that effect, a validation protocol is developed, in which the annual results of the predictive simulation model are compared to the illuminance values measured during a whole year into an existing test cell, located in Seville (Spain), which is used as a reference. After trials it was found that, for three illuminance thresholds of 100, 250 and 500 lux, the mean difference of daylight autonomy between measurements and dynamic simulations is lower of 2% with a standard deviation of 6.8%, and the mean difference for continuous daylight autonomy is 1.0% with a standard deviation of 4.9%. It is concluded that the use of these two metrics by calculation with DaySim tool is adequate for small-sized rooms with one window, located in the Mediterranean area. The exposed methodology allows to validate the use of these indicators in rooms with variable size, window size and location, so further investigation is required.
Index Terms—Daylight autonomy, field experiments, energy saving, useful daylight illuminance, window.
I. INTRODUCTION
Currently, energy saving is one of the main objectives in building construction and civil engineering. In this way, electric lighting is the responsible of between 15 and 30% of the energy consumption in buildings [1]-[3], so the improvement in LED lamps or lighting smart controls, in order to make better use of daylight [4], can reduce the impact on the environment [5].
To optimize the use of daylight, there are different metrics; and despite Daylight factor (DF) is the simplest and most common metric to quantify the daylight allowed by a window [6]-[10] for a better design, Daylight autonomy (DA) [11], developed by Reinhart et al., is one of the most important existing metrics which evaluate dynamic aspects of daylight, being usually applied for annual calculations and allowing to predict the efficiency of lighting smart controls.
At present, lighting simulation programs allow the calculation of daylight autonomy with greater accuracy than empirical methods [12], [13], making them extremely useful
Manuscript received January 30, 2018; revised May 1, 2018. This work was supported by the research and development projects „Energy Rehabilitation of tertiary buildings in Mediterranean climate by optimizing Solar Protection Systems‟ (ref BIA2014-53949-R) and „Efficient design for biodynamic lighting to promote the circadian rhythm in offices buildings‟ (ref BIA2017-86997-R), as well as the TEP-130 Research group.
M. A. Campano, I. Acosta, A. L. León and C. Calama are with the Department of Building Construction I, Universidad de Sevilla, Spain (e-mail: [email protected], [email protected], [email protected] and [email protected]).
tools in the field of natural lighting.
Nevertheless, a computational simulation process is not reliable until it has been validated by comparison, preferably with real models. Since both the DA and the DAC metrics are based in dynamic annual calculations and they have a recent development, there are still no studies that address the validation of such metrics.
In this way, the use of test cells, rooms with controlled conditions and equipped with a set of sensors with data storage system, can allow to generate a reliable point of comparison of the obtained simulation results.
II.OBJECTIVES
The main objective of this research is the validation of two daylight dynamic predictive metrics, obtained through simulation with DaySim tool:
– Daylight Autonomy (DA)
– Continuous Daylight Autonomy (DAC)
To that effect, a validation protocol is developed, in which the DA and DAC annual results of the predictive simulation model are compared to those calculated with the illuminance values measured into an existing test cell, which is used as a reference.
III. METHODOLOGY
For the purposes of this metrics validation study, it is necessary to define a study sample for being used as a comparison element, also selecting the objective parameters that will be measured and used as reference. After selecting the calculation tool, the simulation model is performed and the comparative analysis methodology is defined and applied.
A. Calculation Metrics to Be Validated
Two dynamic metrics were under study in this work. The first of these is daylight autonomy (DA), a concept conceived by the Association Suisse des Electriciens [14] and redefined by Reinhart et al. [6]. This metric is defined as the percentage of the year when a minimum illuminance threshold is met by daylight alone so that the higher the daylight autonomy, the lower the energy consumption in electric lighting. This metric can be defined as equation (1):
DA=
∑i wfi·ti
Є [0,1] wfi=
1 if ED ≥ EL
(1)
∑i ti 0 if ED < EL
where ti is the occupied time in a year, wfi is the weighting
Validation Study for Daylight Dynamic Metrics by Using
Test Cells in Mediterranean Area
factor which depends on the illuminance threshold, ED is the
daylight illuminance measured at a given point, and EL is the
illuminance threshold.
The second dynamic metric is continuous daylight autonomy (DAC) which represents the percentage of the year when a minimum illuminance threshold is met by daylight alone, considering a partial credit linearly to values below the threshold defined [15]. Therefore, this metric can be expressed as equation (2):
DAC= ∑i wfi·ti Є [0,1] wfi=
1 if ED ≥ EL
(2)
∑i ti ED/EL if ED < EL
According to the previous formulae, the dynamic metrics are calculated depending on the weather conditions which define daylight illuminance, the illuminance threshold and the occupancy time, using a typical year.
B. Test Cells
The room model selected for this validation study is one of the test cells of TEP-130 research group [16], designed for the optimization of vertical building envelope solutions for the retrofit of buildings in a Mediterranean area, both for opaque elements and for windows (Fig. 1).
Fig. 1. External appearance of the test modules.
The test cells are located in an outdoor area of a building at the University of Seville, in Seville (Spain), with a N-S longitudinal axis and with no obstacles to sun or to the significant influence of wind flows in the surroundings, as can be seen in Fig. 2.
Fig. 2. Solar influence study (autumn equinox, 9:00 a.m. to 4:00 p.m.).
These four test cells are disposed in two independent
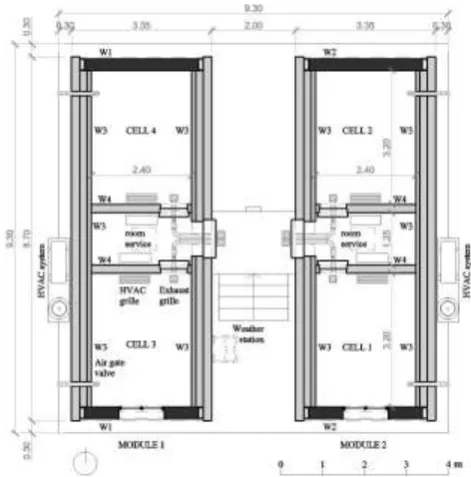
modules off the ground and separated by an access area. Each module is composed of two test cells, one facing north and the other facing south, and separated by a service room for control, measurement and HVAC systems. Each cell is 2.40 m wide, 3.20 m deep, and 2.70 m high (Fig. 3). In this way, two different essays can be evaluated simultaneously for the same cardinal direction.
Fig. 3. Floor plans with the spatial organization of the test cells. Dimensions are in metres.
The enclosure, consisting of the vertical envelope, the floor, and the roof, is made of a series of high density sandwich panels with a combined thickness of 460 mm, coloured in white and screwed to a steel frame structure. Its thermal transmittance (U-values) is 0.05 W/ m2 K. For the flooring solution, 3 mm of non-slip black rubber covering is used. Cells 1 and 3, facing south, have a window aperture of 116 × 108 cm with aluminium sliding carpentry, 4.8.4 double glazing (UO = 3.3 W/m2·K, solar factor of 0.75), and Polyvinyl Chloride (PVC) slatted shutters.
The interior monitoring system controls ambient conditions of interior air quality, lighting, consumption, and energy efficiency. A weather station placed over one of the experimental modules is used to monitor the exterior parameters.
The protocol established in EN ISO 7726:2001 [17] has been followed in the installation process for this system, considering a 5 min time interval for the reading of monitored data and recording historic tendencies. Table I shows the accuracy, rank and quantity of test cells lighting sensors.
TABLEI:LIGHTING PROBES IN THE TEST CELLS
Device # Location Unit Rank Accuracy Lux meter 8 Interior
(matrix) lux 20-2000
±3.0%
Lux meter 1 Exterior
(horizontal) lux 0-200000
±3.0%
Pyranometer 6 Exterior (N/S/E/
C.Calculation Model
The calculation model, which generates the predictive results for DA and DAC, is defined from the facing south test cell characteristics, as a room 2.40 m wide by 3.20 m deep by 2.70 m high with a window of 116 × 108 cm centred in its south façade. The double-leaf window has 0.05 m thick joinery and double glazing which produces a solar factor of 0.75, using a conservation factor of 0.8. The reflectance of the inner surfaces of the calculation model is 0.22 for floor and 0.72 for walls and ceilings. These inner surfaces are diffuse reflectors and the Lambertian reflection of daylight is therefore directly proportional to the cosine of the angle between the observer's line of sight and the surface normal. All variables of the calculation model are shown in Fig. 4.
Fig. 4. Calculation model with illuminance control points.
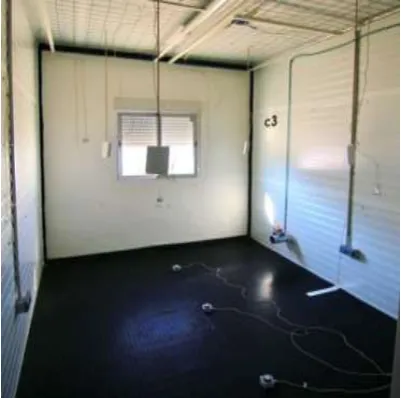
The measurement of illuminance values for DA and DAC indicators is performed on the axis of symmetry of the calculation model with a spacing of 0.40 m and a height above ground of 0.10 m, as can be seen in Fig. 4 and Fig. 5.
Fig. 5. Inner view of the test cell with lux meter distribution.
D.Program
The analysis of the daylight autonomy was carried out
using simulation program DaySim 3.2, which calculates luminous distribution using the ray-tracing process. Several studies have confirmed the correct behavior of this calculation program [18], determining their accuracy by applying the CIE test cases [12]. The calculation parameters used in this program are shown in Table II:
TABLEII:RADIANCE CALCULATION PARAMETERS OF DAYSIM 3.2 Parameter Value Parameter Value Ambient Bounces 7 Specular Jitter 1.0000 Ambient Divisions 1500 Limit Weight 0.0040 Ambient Super-samples 100 Direct Jitter 0.0000 Ambient Resolution 300 Direct Sampling 0.2000 Ambient Accuracy 0.05 Direct Relays 2 Limit Reflection 10 Direct Pretest Density 512 Specular Threshold 0.0000
E. Sky Conditions
The weather conditions correspond to the city of Seville, located at Latitude 37.42º and Longitude 5.40º, with mainly clear skies. The weather data for computational computations is obtained from Energy Plus [19], considering direct normal and diffuse horizontal irradiances, as well as from the sky model developed by Perez et al. [20] and accepted by CIE [21]. Measurements in test cells were performed throughout all the year of 2017, from January to December.
F. Calculation and Measurement Conditions
The calculation of daylight autonomy and useful daylight illuminance, both for computer simulation and measurements, have been developed considering an occupancy hours from 8:00 am to 5:00 pm, with no break to lunch.
Given that DA and DAC entirely depends on indoor illuminance values, the illuminance threshold for the calculation is a variable which has three values:
– 100 lux. – 250 lux. – 500 lux.
These three illuminance threshold are chosen because they contain the average illuminance range recommended in most common uses of architectural spaces.
IV. ANALYSIS OF RESULTS
According to the methodology described, the daylight autonomy (DA) and the continuous daylight autonomy (DAC) are calculated in the study points represented in Fig. 4 and Fig. 5, both for computer simulations and annual measurements. These values obtained can show the independence of artificial lighting in the room and therefore the relative energy saving in power consumption, if the value of daylight autonomy is located between 50 and 100%.
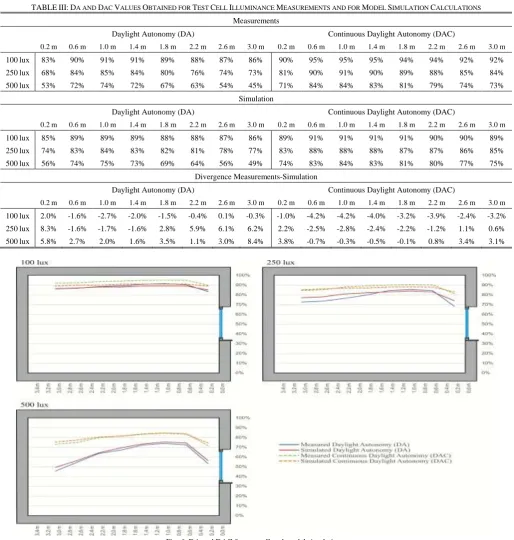
Table III and Fig. 6 show the daylight dynamic metrics measured at the study points, both from annual measurements and dynamic simulations, for the defined illuminance thresholds of 100, 250 and 500 lux.
TABLEIII:DA AND DAC VALUES OBTAINED FOR TEST CELL ILLUMINANCE MEASUREMENTS AND FOR MODEL SIMULATION CALCULATIONS
Measurements
Daylight Autonomy (DA) Continuous Daylight Autonomy (DAC)
0.2 m 0.6 m 1.0 m 1.4 m 1.8 m 2.2 m 2.6 m 3.0 m 0.2 m 0.6 m 1.0 m 1.4 m 1.8 m 2.2 m 2.6 m 3.0 m 100 lux 83% 90% 91% 91% 89% 88% 87% 86% 90% 95% 95% 95% 94% 94% 92% 92% 250 lux 68% 84% 85% 84% 80% 76% 74% 73% 81% 90% 91% 90% 89% 88% 85% 84% 500 lux 53% 72% 74% 72% 67% 63% 54% 45% 71% 84% 84% 83% 81% 79% 74% 73%
Simulation
Daylight Autonomy (DA) Continuous Daylight Autonomy (DAC)
0.2 m 0.6 m 1.0 m 1.4 m 1.8 m 2.2 m 2.6 m 3.0 m 0.2 m 0.6 m 1.0 m 1.4 m 1.8 m 2.2 m 2.6 m 3.0 m 100 lux 85% 89% 89% 89% 88% 88% 87% 86% 89% 91% 91% 91% 91% 90% 90% 89% 250 lux 74% 83% 84% 83% 82% 81% 78% 77% 83% 88% 88% 88% 87% 87% 86% 85% 500 lux 56% 74% 75% 73% 69% 64% 56% 49% 74% 83% 84% 83% 81% 80% 77% 75%
Divergence Measurements-Simulation
Daylight Autonomy (DA) Continuous Daylight Autonomy (DAC)
0.2 m 0.6 m 1.0 m 1.4 m 1.8 m 2.2 m 2.6 m 3.0 m 0.2 m 0.6 m 1.0 m 1.4 m 1.8 m 2.2 m 2.6 m 3.0 m 100 lux 2.0% -1.6% -2.7% -2.0% -1.5% -0.4% 0.1% -0.3% -1.0% -4.2% -4.2% -4.0% -3.2% -3.9% -2.4% -3.2% 250 lux 8.3% -1.6% -1.7% -1.6% 2.8% 5.9% 6.1% 6.2% 2.2% -2.5% -2.8% -2.4% -2.2% -1.2% 1.1% 0.6% 500 lux 5.8% 2.7% 2.0% 1.6% 3.5% 1.1% 3.0% 8.4% 3.8% -0.7% -0.3% -0.5% -0.1% 0.8% 3.4% 3.1%
Fig. 6. DA and DAC for test cell and model simulations.
As can be deducted from Fig. 6, daylight autonomy (DA) values in measurements are close to those observed in simulations, especially in the half part of the room which is closest to the window (0.6 to 1.8 m), with a maximum deviation of 3.5% for 500 lux. However, there are a slightly bigger divergence for values measured both at 0.2 m from the window and at the bottom of the room, from 2.4 to 3.2 m, with a maximum deviation of 8.3% for 250 lux and 8.4% for 500 lux, respectively. These differences show a small and progressive divergence between measurements and simulations regarding to depth, but they can be considered as acceptable due to the low values for all the illuminance thresholds.
In the case of continuous daylight autonomy (DAC) values,
case of DA, with a maximum deviation of 4.2% for 100 lux, being more coincident for higher illuminance thresholds.
Calculation of the bias error for both metrics shows a value of 1.9% for DA and 1.0% for DAC, with a standard deviation (95% reliability) of 6.8% and 4.9%, respectively. In both cases, these divergences are under 10% and, therefore, are acceptable.
Mediterranean area.
V. CONCLUSIONS
At present, new lighting designs must aim to minimize energy consumption, and as exposed in the introduction, daylight dynamic metrics are one of the most remarkable tools in order to predict and evaluate the behaviour of smart lighting control systems. Nevertheless, a computational simulation process is not reliable until it has been validated by comparison, preferably with real models, so this research develops a validation protocol, in which the dynamic metrics annual results of a predictive simulation model are compared to those calculated with the illuminance values measured into an existing test cell, which is used as a reference. The analysis of the trials results shows that, for three illuminance thresholds of 100, 250 and 500 lux, the mean difference of daylight autonomy between measurements and dynamic simulations is lower of 2% with a standard deviation of 6.8%, and the mean difference for continuous daylight autonomy is 1.0% with a standard deviation of 4.9%. It is concluded that the use of these two metrics by calculation with DaySim tool is adequate for small-sized rooms with one window, located in the Mediterranean area. In this way, the use of test cells provided tangible and precise information to validate dynamic simulations. The exposed methodology also allows to validate the use of these indicators in rooms with variable size, window size and location, so further investigation is required.
ACKNOWLEDGMENT
The results presented were funded by the government of Spain through the research and development projects „Energy Rehabilitation of tertiary buildings in Mediterranean climate by optimizing Solar Protection Systems‟ (ref BIA2014-53949-R) and „Efficient design for biodynamic lighting to promote the circadian rhythm in shift work centers‟ (ref BIA2017-86997-R). The authors wish to express their gratitude for all the technical and financial support provided.
REFERENCES
[1] J.C. Lam, D. H. W. Li, and S. O. Cheung, “An analysis of electricity end-use in air-conditioned office buildings in Hong Kong,” Building
and Environment, vol. 38, no. 3, 2003, pp. 493-498.
[2] N. Armaroli and V. Balzani, “Towards an electricity-powered world,”
Energy & Environmental Science, vol. 4, 2011, pp. 3193-3222.
[3] W. Ryckaert, C. Lootens, J. Geldof, and P. Hanselaer, “Criteria for energy efficient lighting in buildings,” Energy and Buildings, vol. 42, no. 3, 2010, pp. 341-347.
[4] I. Acosta, C. Munoz, M. A. Campano, and J. Navarro, “Analysis of daylight factors and energy saving allowed by windows under overcast sky conditions,” Renewable Energy, vol. 77, 2015, pp. 194-207. [5] M.A. Haq, M.Y. Hassan, H. Abdullah, H.A. Rahman, M. P. Abdullah,
F. Hussin, and D. M. Said, “A review on lighting control technologies in commercial buildings, their performance and affecting factors,”
Renewable and Sustainable Energy Reviews, vol. 33, 2014, pp.
268-279.
[6] D. H. W. Li, “A review of daylight illuminance determinations and energy implications,” Applied Energy, vol. 87, 2010, pp. 2109-2118. [7] S. Treado, G. Gillette, and T. Kusuda, “Daylighting with windows,
skylights, and clerestories,” Energy and Buildings, vol. 6, 1984, pp. 319- 330.
[8] H. H. Alzoubi and A. H. A. Zoubi, “Assessment of building façade performance in terms of daylighting and the associated energy consumption in architectural spaces: Vertical and horizontal shading devices for southern exposure facades,” Energy Conversion and
Management, vol. 51, 2010, pp. 1592-1599.
[9] I. Acosta, C. Munoz, M. A. Campano, and J. Navarro, “Analysis of daylight factors and energy saving allowed by windows under overcast sky conditions,” Renewable Energy, vol. 77, 2015, pp. 194-207. [10] CIE, “International lighting vocabulary,” Commission Internationale
de l’Éclairage, 2011.
[11] C. F. Reinhart, J. Mardaljevic, and Z. Rogers, “Dynamic daylight performance metrics for sustainable building design,” Leukos, vol. 3, no. 1, 2006, pp. 7-31.
[12] CIE, “Test cases to assess the accuracy of lighting computer programs,” Commission Internationale de l’Éclairage, 2006. [13] M. Maamari and N. F. Adra, “Application of the CIE test cases to
assess the accuracy of lighting computer programs,” Energy and Buildings, vol. 38, 2006, pp. 869-877.
[14] Association Suisse des Electriciens, Éclairage intérieur par la lumière du jour, Association Suisse Des Electriciens, Swiss Norm SN 418911, 1989.
[15] A. Galatioto and M. Beccali, “Aspects and issues of daylighting assessment: A review study,” Renewable and Sustainable Energy
Reviews, vol. 66, 2016, pp. 852-860.
[16] A. L. León, R. Suárez, P. Bustamante, M. A. Campano, and D. Moreno, “Design and performance of test cells as an energy evaluation model of facades in a Mediterranean building area,” Energies, vol. 10, no. 11, 1816, 2017, pp. 1-16.
[17] Ergonomics of the Thermal Environment. Instruments for Measuring
Physical Quantities, ISO Standard 7726-2002.
[18] C. F. Reinhart and P. F. Breton, “Experimental validation of Autodesk (r) 3Ds Max (r) Design 2009 and Daysim 3.0,” 2009, pp. 7-35. [19] U. S. Department of Energy, “Energy plus energy simulation
software”.
[20] R. Perez, R. Seals, and J. Michalsky, “All-weather model for sky luminance distribution-preliminary configuration and validation,”
Solar Energy, vol. 50, no. 3, 1993, pp. 235-245.
[21] CIE, “Spatial distribution of daylight - CIE standard general sky,”
Commission Internationale de l’Éclairage, 2003.
M. A. Campano is a professor at the Department of Building Construction I, University of Seville, Spain. He is a member of the research group TEP-130, which is focused on sustainability, energy efficiency, lighting, acoustics and optics related to building design and heritage refurbishment.