Effect of Wall Thickness on Thermal Behaviors of RC Walls Under Fire
Conditions
Jiyeon Kang
1), Hyunah Yoon
1), Woosuk Kim
2), Venkatesh Kodur
3), Yeongsoo Shin
1),
and Heesun Kim
1),*
(Received March 22, 2016, Accepted July 11, 2016, Published online August 2, 2016)
Abstract: The objective of this paper is to investigate the effect of thickness and moisture on temperature distributions of reinforced concrete walls under fire conditions. Toward this goal, the first three wall specimens having different thicknesses are heated for 2 h according to ISO standard heating curve and the temperature distribution through the wall thickness is measured. Since the thermal behavior of the tested walls is influenced by thickness, as well as moisture content, three additional walls are prepared and preheated to reduce moisture content and then tested under fire exposure. The experimental results clearly show the temperatures measured close to the fire exposed surface of the thickest wall with 250 mm thickness is the highest in the temperatures measured at the same location of the thinner wall with 150 mm thickness because of the moisture clog that is formed inside the wall with 250 mm of thickness. This prevents heat being transferred to the opposite side of the heated surface. This is also confirmed by the thermal behavior of the preheated walls, showing that the temperature is well distributed in the preheated walls as compared to that in non-preheated walls. Finite element models including moisture clog zone are generated to simulate fire tests with consideration of moisture clog effect. The temperature distributions of the models predicted from the transient heat analyses are compared with experimental results and show good agreements. In addition, parametric studies are performed with various moisture contents in order to investigate effect of moisture contents on the thermal behaviors of the concrete walls.
Keywords:normal strength concrete wall, moisture content, wall thickness, fire test, heat transfer analysis.
1. Introduction
Reinforced concrete wall structures are widely used in Korea, especially for residential buildings. It is important to study the fire resistance of reinforced concrete walls, because the number of fire accidents in residential buildings is increasing every year. In Korea, concrete walls must be designed according to Korean building code specifications to meet required fire resistance ratings, which is determined by occupancy of the building and number of floors (Regulation for refuge and prevention of fire in building2015). The fire resistance rating determines required length of time period that a structural member or system is able to function properly under fire. To design the structural members to resist fire, engineers choose a section for structural member
from tables that can satisfy the required length of time per-iod. The US and Europe provide guidelines similar to Kor-ean building code in ACI 318-11 (2011) and Eurocode 2 (2006), respectively. Specifically, ACI 318-11 (2011) pro-vides the chart for determining the fire resistance rating of concrete walls based on thickness and concrete type. Euro-code 2 provides a chart of minimum thickness of walls and cover based on the required fire resistance rating, which is determined by the number of exposure surface and loading condition.
However, quantitative evidence supporting the relation-ships between the thickness of a concrete wall and the resistance to fire has not been reported. In addition, a limited number of studies have been performed on struc-tural walls, especially normal strength concrete walls, compared to other structural members such as columns and beams. Recent studies on reinforced concrete wall under fire conditions have focused on spalling in high strength concrete walls (O’Meagher and Bennetts1991; Crozier and Sanjayan 2000; Ngo et al. 2013; Lee and Lee 2013). O’Meagher and Bennetts (1991) developed a theoretical computer-based model for analyzing the behavior of con-crete walls under fire exposure. From their theoretical study, they concluded that the behavior of a reinforced concrete wall in one-sided fire exposure could be signifi-cantly influenced by the height to thickness ratio of the wall, the location of steel reinforcement, associated cover 1)
Department of Architectural Engineering, Ewha Womans University, Seoul 03760, Korea.
*Corresponding Author; E-mail: hskim3@ewha.ac.kr
2)School of Architecture, Kumoh National Institute of
Technology, Gumi-si 39177, Korea.
3)Department of Civil and Environmental Engineering,
Michigan State University, East Lansing, MI 48824, USA.
CopyrightÓThe Author(s) 2016. This article is published with open access at Springerlink.com
International Journal of Concrete Structures and Materials Volume 10, Number 3 Supplement, pp.S19–S31, September 2016 DOI 10.1007/s40069-016-0164-5
thickness, and end restraints. Crozier and Sanjayan (2000) focused on the behavior of slender high strength concrete walls subjected to standard fire conditions under combined eccentric axial and lateral loads to investigate the in-plane load capacity. According to their test results, slender walls subjected to low in-plane loads show that the in-plane loads made little difference on the behavior of the walls exposed to fire. Their study showed that concrete strength seems to have little influence on the in-plane load capacity of walls subjected to fire exposure on one surface. Ngo et al. (2013) found the differences in thermal behavior between normal and high strength concrete walls for ISO 834 standard fire testing. Specifically, it was observed that a hydrocarbon fire creates a significant increase in tem-perature in the initial period of the fire as compared to that specified by the ISO 834 standard. In addition, high strength concrete walls suffered severe damage due to spalling than normal strength concrete walls. Therefore, the hydrocarbon heating caused more explosive and earlier spalling in the high strength concrete walls than heating according to ISO 834 standard fire exposure. (Lee and Lee 2013) conducted experimental and numerical studies of the fire resistance of concrete walls exposed to fire on both sides. They tested eight walls with various height-to-thickness ratios, concrete strengths, and axial load levels. Test results showed that wall thickness and load level have a major effect on the performance of concrete walls in a fire. They proposed numerical methods for predicting the fire resistance of concrete walls. In their studies, the fire resistance of concrete walls was predicted based on the experimental observations of columns exposed to elevated temperatures.
The above review indicates that the behavior of concrete walls under fire exposure is affected by the wall thickness, magnitude of in-plane and lateral loads, concrete strength, and reinforcement ratio. However, no studies are reported on the quantitative relationship between the wall thickness and fire performance of concrete walls.
Therefore, the aim of this paper is to investigate the thermal behaviors of load bearing normal strength concrete walls with various thicknesses when one surface exposed to fire. In addition, the effect of preheating on the thermal behavior of concrete walls is investigated to evaluate the effect of moisture content on the performance of the walls.
Toward this goal, fire tests are performed on concrete walls having different thicknesses and amounts of moisture. In the experiments, temperature distributions through the thickness of the wall specimens are measured. In addition, finite element models are developed to simulate fire tests and the results from the models are compared with experimental results.
2. Experimental Program
2.1 Test Specimens and Variables
Six wall specimens are fabricated to investigate the effects of wall thickness and moisture content on the thermal
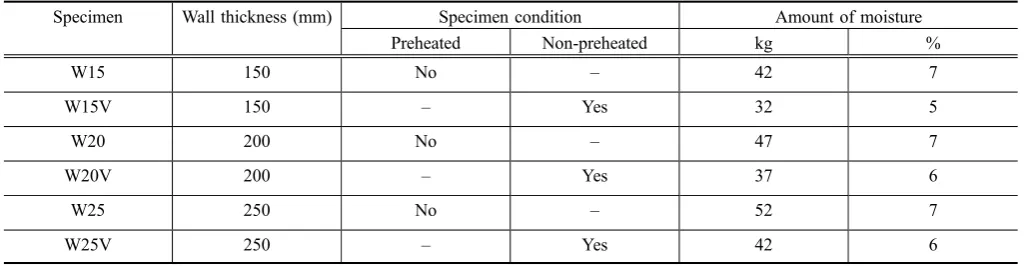
Table 1 Summary of test conditions of walls.
Specimen Wall thickness (mm) Specimen condition Amount of moisture
Preheated Non-preheated kg %
W15 150 No – 42 7
W15V 150 – Yes 32 5
W20 200 No – 47 7
W20V 200 – Yes 37 6
W25 250 No – 52 7
W25V 250 – Yes 42 6
behavior of normal strength walls under fire. The test specimens are listed in Table1. The wall thicknesses are varied as 150, 200, and 250 mm, according to the general range of wall thicknesses in residential buildings in Korea.
To investigate the effect of moisture content in the walls, wall specimens W15V, W20V, and W25V are preheated at 200°C for 4 h in a fire chamber, as shown in Fig.1. During the preheating, the temperature at the center of the wall thickness in W15V reaches 113°C after 4 h of heating. However, the center of the wall thicknesses in W20V and W25V did not reach 100°C, even after 4 h of preheating due to their relatively large thickness. Amount of moisture of
the concrete walls can be estimated from water content of the concrete mixture. When the wall is preheated, weight loss of 10 kg is measured, which can be assumed as loss of mois-ture. Therefore, the amount of moisture of the preheated specimens is calculated considering the water content of the concrete mixture and weight loss due to preheating. In this manner, the amount of moisture in the tested specimens is estimated as listed in Table1.
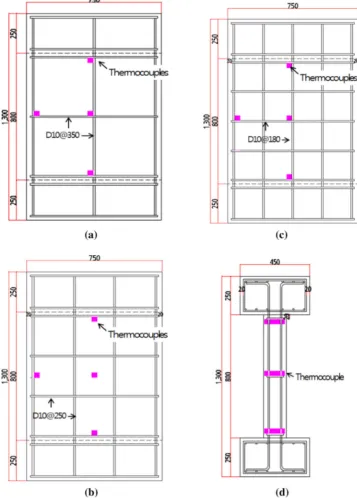
The dimensions of the wall specimens are 750 mm (width) and 1,300 mm (height). The height of the walls is deter-mined in order to avoid the buckling effect of walls. The thermocouples are placed on 4 different locations inside the
walls to measure the temperature distributions during the fire test. Details of the test specimens and the location of ther-mocouples are shown in Fig.2. The wall specimens are designed in accordance with the Korean Concrete Institute (KCI) design recommendations (2012). The vertical and horizontal reinforcement ratios are constant at 0.0038 and 0.0020, respectively, which satisfy the minimum vertical and horizontal reinforcement ratios for a bearing wall. For rein-forcing steel bars, D10 bars are used.
2.2 Materials
The mix proportion used in the fabrication of concrete walls is presented in Table2. Specimens are cured for 5 months at room temperature and the 28-day compressive strength of concrete is 30 MPa. The yield strength and elastic modulus of reinforcing steel bars are 439 MPa and 156GPa, respectively.
2.3 Test Set-up and Data Measurement
Fire tests are performed in the fire furnace as shown in Fig.3. The specimens are heated for 2 h according to the ISO standard heating curve. Figure4 illustrates the ISO standard heating curve and a time of 2 h is chosen for heating because the bearing walls in apartment buildings over 5 stories must be designed to resist fire for 2 h according to Korean regulation (Regulation for refuge and
prevention of fire in building 2015). The temperatures in the specimens are measured using three thermocouples at the locations of C, M, T, and B, as shown in Fig.5. At each location, the temperatures are measured through the fol-lowing thicknesses: 30 mm from the exposure surface (C1), midpoint of the wall thickness (C2), and 30 mm from the non-exposure surface (C3). In addition, total 10 thermo-couples are used for temperature measurement in the heating furnace.
Fig. 3 Fire test set-up of specimens in the fire chamber.aCross-sectional view.b Lengthwise sectional view.cPhotograph of sections to exposed.dPhotograph of sections to unexposed.
Table 2 Mix proportions of concrete. Specified concrete
strength (MPa)
W/C (%) Cement (kg/m3) Water (kg/m3) Sands (kg/m3) Gravels (kg/m3) Admixture (%)
24 52 312 162 846 934 1.68
This study uses the deflection failure criterion suggested in ISO 834-2012 (2012) for the structures exposed to high temperatures. According to ISO-834, failure is determined when the axial deformation of the compression member reaches h/100 mm or the rate of deformation reaches 3h/ 1000 mm/min within 2 h of fire, wherehdenotes the initial height of the specimen before the fire. For the walls in this study, the deflection failure limit is 6 mm.
3. Results and Discussion
3.1 Experimental Results
3.1.1 Wall Specimens Having Various Thicknesses
After about 20 min of heating, moisture in the concrete of W15 specimen begins to evaporate and steam starts to seep out through the unexposed surface. A similar phenomenon is
Fig. 5 Thermocouples location.
Fig. 6 Photographs of specimens after fire test for 2 h.aW15 (leftexposed surface,rightunexposed surface).bW20 (leftexposed surface,rightunexposed surface).cW25 (leftexposed surface,rightunexposed surface).dW15V (leftexposed surface,
rightunexposed surface). eW20V (leftexposed surface, rightunexposed surface). fW25V (left exposed surface,right
observed with the thicker specimens, W20 and W25, but the moisture evaporation starts much later than after 20 min of heating. In addition, the largest amount of moisture flow is observed in W15 because it is easier for the moisture to migrate through lower thickness of W15 than through thicker walls W20 and W25.
After 2 h of fire tests, a fire induced spalling or a signif-icant deformation is not observed from the tested specimens, as shown in Figs.6a to 6f. For all the specimens, it is common that the surfaces exposed to fire are discolored and fine cracks are developed. On the unexposed surfaces, a relatively small number of cracks and white stains caused by
dehydration are observed. No significant differences of cracks, discoloration, and deformations between the speci-mens are found.
Figure7 illustrates time–temperature curves measured at various locations from thermocouples placed in the speci-mens and heating furnace. As shown in Fig.7a, tempera-tures measured at a distance of 30 mm from the surface exposed to fire are much higher than temperatures measured at the center and 30 mm from the unexposed surface. In addition, temperature increase is sustained for 5 min or more due to moisture evaporation when it reaches around 100°C. The difference in the time taken to sustain 100°C at dif-ferent depths of the specimen is affected by the amount of moisture present in the wall. The preheated specimens, W15V, W20V, and W25V show a similar trend, as shown in Fig.7b.
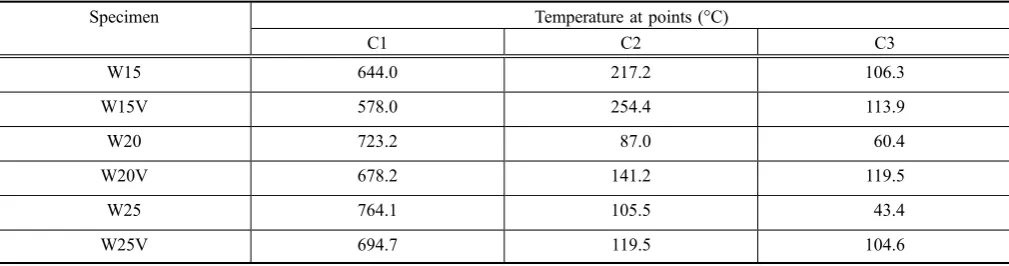
Table3 presents temperatures at different locations after 120 min of heating. While the furnace temperature is 1051°C, the temperatures at a distance of 30 mm from the surface exposed to fire (C1) reach 644, 723, and 764°C for W15, W20, and W25, respectively. It is interesting to note that a higher temperature is attained in wall W25 than other walls and a similar tendency is also found with the preheated wall specimens. Temperatures at a distance of 30 mm from the wall surface exposed to fire (C1) are 578, 678, and 695°C in walls W15V, W20V, and W25 V, respectively. Temperatures at the center of the wall thickness (C2) are 217, 87, and 105°C, for walls W15, W20, and W25, respectively. Lastly, the temperatures at a distance of 30 mm from the surface not exposed to fire (C3) reach 106, 60, and 43°C for the W15, W20, and W25 specimens, respectively. The thicker walls with 200 mm and 250 mm of thickness experience larger temperature difference between C1 and C3. In other words, these walls with 150 mm of thickness propagate heat better than wall with 200 mm of thickness and over.
As shown in Figs.8a to8c, it is common that temperatures change through the thicknesses of W15, W20, and W25 specimens (at locations of 1, 2, and 3). However, very little temperature differences between the center, left, upper, and lower parts of the walls (C, M, T, and B) are observed as long as the thermocouples are located at the same distance from the wall surface. Therefore, one-dimensional heat propagation though the thickness can be considered for thermal behaviors of the tested walls.
Fig. 7 Time-temperature relationship as wall thickness. aNon-preheated specimens.bPreheated specimens.
Table 3 Temperatures at C1 after heating for 2 h.
Specimen Temperature at points (°C)
C1 C2 C3
W15 644.0 217.2 106.3
W15V 578.0 254.4 113.9
W20 723.2 87.0 60.4
W20V 678.2 141.2 119.5
W25 764.1 105.5 43.4
Table4shows the times taken for the location C1 to reach various temperature levels. As time passes, rate of temper-ature rise decreases gradually in all specimens. It takes a shorter time for C1 to reach 100°C, as compared to other temperature levels because of the higher thermal conduc-tivity. Among the specimens, W25 shows the highest tem-perature rise rate in every level.
3.1.2 Preheated and Non-Preheated Wall Specimens
Figures 9a to9c illustrate the time–temperature curves of preheated and non-preheated specimens with various wall thicknesses along with temperatures of heating furnace. The temperatures measured at a distance of 30 mm from the surface exposed to fire are lower in the preheated specimens, W15V, W20V, and W25V than those in the non-preheated specimens, W15, W20, and W25. Unlike non-preheated specimens that show a sustained temperature increase at around 100°C, the preheated specimens show a temperature increase without having a region of sustained temperature increase.
However, temperatures at locations C2 and C3 of the preheated specimens are higher than those of non-preheated specimens. This is because heat is prevented from being transferred from the fire toward the opposite surface due to moisture clog inside the walls when the specimens are not preheated. In other words, preheated walls have little or no moisture clog, which leads to a better heat transfer through the thickness of the walls.
The effect of moisture on heat transfer is also shown in Fig.10. Temperature distribution along the thickness of non-preheated specimens shows that the temperature at 30 mm from the fire is higher than those of the preheated specimens. However, the temperature at some distance from the fire of the non-preheated specimens is lower than those of the preheated specimens. In other words, a large temperature difference between the C1 and C3 locations is observed in the non-preheated specimens, compared to preheated speci-mens, which becomes more obvious in wall specimens with 200 mm and 250 mm of thickness.
3.2 Discussion
As noted above, the thickest wall having 250 mm thick-ness experiences the highest temperature measured at the surface exposed to fire and the shortest time to reach any temperature level, especially when the concrete has greater moisture content. The reason could be due to the moisture movement in concrete wall when exposed to one side fire.
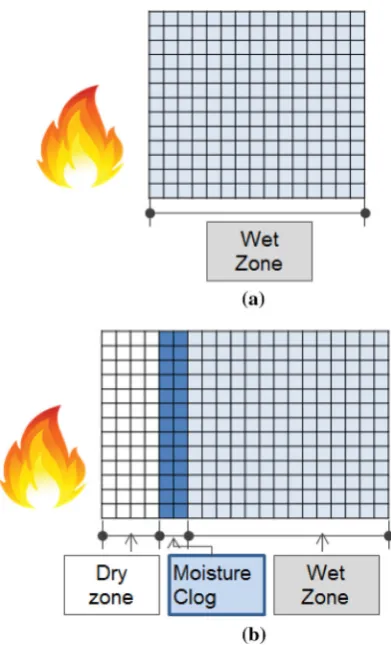
As the temperature increases, the moisture in the heated part move towards the relatively cooler part of the wall. Therefore, a moisture zone is formed at a certain distance from the surface exposed to fire (NIST1997; Ko et al.2007; Lee2009; Consolazio et al.1998). If the wall is thin enough such as wall thickness 150 mm, moisture easily escapes through the unexposed surface without forming a moisture zone in the middle of the wall. However, it is relatively difficult for the moisture to move through the thicker walls such as wall thickness 200 or 250 mm, as illustrated in Fig.11, and a moisture clog (Hamarthy 1965) is formed inside the concrete wall. In previous studies, a moisture clog is usually mentioned in high strength concrete walls under fire and is considered as a cause of spalling; however, it can also exist in normal strength concrete due to the high water-cement ratio and can prevents heat propagation. Therefore, in order to support this phenomenon, the following section presents analytical studies showing the effect of moisture
Fig. 9 Time-temperature relationship as amount of moisture. aSpecimens W15 and W15V.bSpecimens W20 and W20V.cSpecimens W25 and W25V.
Fig. 10 Temperature distribution in specimens. a W15 and W15V.bW20 and W20V.cW25 and W25V.
Table 4 Times taken for thermocouple C1 to reach various temperature levels.
Specimen Increasing time to reach at various temperature level (min)
100°C 200°C 300°C 400°C 500°C 600°C 700°C
W15 9.0 13.7 10.1 13.0 18.7 27.0 –
W20 6.8 10.2 8.3 10.0 15.0 23.3 35.9
clog on the thermal behavior of walls. The analytical model includes finite element simulation of moisture clog working as a thermal barrier, which leads to an increase in the tem-perature close to the exposed surface of the wall to prevent heat transfer toward the opposite unexposed surface.
3.2.1 Analytical Approach
The moisture content in concrete has a significant influ-ence on thermal properties such as thermal conductivity and specific heat of normal strength concrete (Kodur 2014; Kodur et al.2008; Szoke2006). Therefore, it is important to consider the moisture effect in predicting thermal behavior of concrete structures under fire.
Only a few researches using numerical analysis or experimental studies on moisture migration and pore pres-sure development have been carried out, and they are mostly related to the spalling of high strength concrete (Beyea et al. 1998; Consolazio et al.1998; Bazant and Thonguthai1979; Khoylou1997; Selih et al. 1994; Dwaikat and Kodur2009; Kodur and Phan2007). A practical modeling technique for predicting temperature distributions of concrete walls under fire considering movement of moisture has not been fully developed.
In this study, 3D finite element models of all the speci-mens are generated to simulate fire experiments using
Fig. 11 Sequence of moisture movement according to the concrete wall thickness.a The concrete wall thick-ness 150 mm. b The concrete wall thickness 200/250 mm.
Fig. 12 Divided regions for moisture movement. aThe con-crete wall thickness 150 mm. b The concrete wall thickness 200/250 mm.
ABAQUS 6.10-3 (Theory Manual 2010). The model uses 8-node linear brick elements for the concrete walls and the reinforcing bars. Even though the experimental results show one-dimensional heat propagation through the thickness, the 3D models are generated in order to use the temperature distributions predicted from the transient heat analysis for the further studies of mechanical analysis of the fire dam-aged walls. In the model, temperature-dependent thermal properties such as effective specific heats and conductivities of concrete are adopted from Eurocode 2 (EN 1992-1-2). Time dependent temperatures of ISO standard heating curve are prescribed to one surface of each wall model, while initial temperature is given as 20°C for all the surfaces. Detailed modeling methods can also be found from the previous study of Choi et al. (2012).
Since the accurate modeling of moisture movement was very complicated, a simplified approach for considering moisture movement in the concrete wall is proposed. Instead of modeling wall elements having moisture gradually changing through the depth, the model is idealized by defining three different zones as illustrated in Fig.12: moisture clog, dry, and wet zones. For the models having 200 and 250 mm of thickness, the section for the moisture clog is defined where heat transfer is interrupted by the moisture clog. According to National Institute of Standards
and Technology (NIST 1997), it is recommended to have moisture clog section at a distance between 50 and 60 mm from the surface exposed to fire for the case of thick walls with 200 and 250 mm of thickness, while a thin wall with 150 mm of thickness does not have a moisture clog sec-tion. Because the temperatures measured at C1 location (30 mm from the exposure surface) of these two walls are higher than the temperature at C1 of the wall with 150 mm. In addition, the heat is not propagated well in the walls with 200 and 250 mm thicknesses, compared to the wall with 150 mm thickness.
When the temperature dependent thermal properties from Eurocode 2 are adopted, the analytical result (temperatures) of the W15V model matches well with the measured experimental results, as shown in Fig.13a. For the other models of walls W15, W20, W20V, W25, and W25V, the specific heat of dry and wet zones is adopted from Eurocode 2, the wet zone of the non-preheated wall models uses values of specific heat having a moisture content of 7 % while the preheated wall models use 6 %. Possibly, the dry zone uses the specific heat of the concrete having a moisture content of 3 % for non-preheated and heated wall models, while the moisture clog section uses 15 % moisture content based on both experimental data and the relative saturation distribu-tion as given by Ko et al. (2007) and Lee (2009).
Fig. 14 Time-temperature comparison of analysis and exper-imental results in wall thickness 200 mm. aW20 V. bW20.
For preheated walls having 200 and 250 mm under 300°C, the thermal conductivity of moisture clog is deter-mined as 50 % of the conductivity for plain concrete because moisture is actively evaporated under 300°C and delays heat transfer when the concrete reaches over 300°C. Conductivity is increased by 60 and 20 % for W20V and W25V, respectively. For the W15 model, the thermal con-ductivity of the moisture clog is 50 % of the concon-ductivity for plain concrete regardless of temperatures in order to change the temperature from that of W15 V beyond 300°C.
3.2.2 Analysis Results
Figures13,14and 15show the results of time–tempera-ture curves predicted from the analyses, compared with the experiments. As seen, the analytical results are in good agreements with the experimental results, especially for the temperatures obtained at 30 mm from the heated surface.
In the Figs.13a and13b, analytical results of temperature distributions for the case of walls having 150 mm thickness are compared with experimental results. In the W15 V model, it is assumed that the moisture clog is not formulated due to moisture evaporation during preheating process, while the W15 model includes moisture clog zone. The
assumption is supported by the experimental results showing that the heat passes relatively easily in the preheated wall than the non-preheated wall. Since the temperature distri-butions predicted from the non-preheated and preheated models having thickness of 150 mm are well matched with the experimental results, the assumption can be considered as acceptable. Figures14and15show the time–temperature curves of walls having thicknesses of 200 and 250 mm, respectively. In these models, it is assumed that the moisture clog zones are formulated for the preheated walls as well as the non-preheated walls. This assumption is made because the experimental results show that the moisture of the pre-heated walls is not fully evaporated during preheating when the specimens have thicknesses of 200 or 250 mm. Because moisture clog zone delays heat propagation, the predicted temperatures in the dry zone increase rapidly during heating, while temperatures behind the moisture clog zone are not increased effectively. Such delay in heat propagation becomes significant in the models of W25 and W25V, as moisture content increases with wall thickness. The analyt-ical results of the W20, W20V, W25, and W25V models having the moisture clog zone are in good agreements with the experimental results and justify the assumption.
In order to investigate the effect of moisture contents in the moisture clog zone on temperature distribution of the walls, parametric studies are performed with various moisture contents. The moisture contents of the wall models are varied as 5, 6, 7, and 8 %, while other parameters such as wall thickness and heating condition are fixed as 250 mm and 2-h heating with ISO standard heating curve, respec-tively. In the moisture clog zone, moisture dependent specific heat and conductivity of concrete are adopted based on the studies by Ko et al. (2007), Lee (2009), Schneider (1982), and Jansson (2004). Figure16a illustrates analytical results of temperature distributions through the wall thick-ness predicted from the wall models with and without con-sidering moisture clog. The analytical results show that temperature distribution changes when the wall model includes moisture zone, such that the higher temperature is observed from the front part of the moisture zone in com-parison to the model without having moisture clog zone. In addition, as the moisture content increases, the temperature difference between the front and rear part of moisture zone increases, as illustrated in Fig.16b. The further studies are needed to validate accuracy of the prediction and to quantify the relationship between the moisture content and the effi-ciency of heat propagation.
4. Conclusions
To investigate the effects of wall thickness and moisture content in concrete on the temperature distribution, six walls are heated on one side according to the ISO 834 standard fire curve. The wall thicknesses are varied as 150, 200, and 250 mm and half of the fabricated walls are preheated before the fire tests to reduce the amount of moisture. Cross sec-tional temperatures are measured at three different locations
through the wall thickness during heating. The experimental results clearly show the temperature measured close to exposed surface is higher in the thicker walls than the temperature measured at the same location of the thinner wall. This is because the moisture clog inside thick walls with 200 and 250 mm thicknesses prevents heat being transferred and this acts as insulation. This is also confirmed by the experimental results of temperature distribution of the preheated walls, showing that better heat transfer occur from the preheated walls as compared to non-preheated walls. Finite element models are developed to simulate fire tests and the results from the model are compared with experi-mental results.
The proposed analytical modeling technique having moisture clog zone is able to predict thermal behavior of normal strength concrete walls under fire with consideration of moisture contents. However, accuracy from the model can be increased when the better information on the moisture clog zone and moisture dependent thermal properties of concrete are included the model. Therefore, further studies are needed to investigate the position of moisture clog zone in the real sized structural members and to see how the zone moves as heating time passes.
Acknowledgments
This research was supported by the Basic Science Research Program through the National Research Foundation of Korea (NRF) funded by the Ministry of Education, Science and Technology (No.2-2013-3322-001-1). The research was also supported by Korea Agency for Infrastructure Technol-ogy Advancement (KAIA)—16AUDP-B100356-02.
Open Access
This article is distributed under the terms of the Creative Commons Attribution 4.0 International License (http://creativecommons.org/licenses/by/4.0/), which per-mits unrestricted use, distribution, and reproduction in any medium, provided you give appropriate credit to the original author(s) and the source, provide a link to the Creative Commons license, and indicate if changes were made.
References
ABAQUS. (2010).Theory manual version 6.10-3. Providence, RI: Dassault Systemes Simulia Corp.
ACI committee 318-11. (2011).Building code requirements for structural concrete (ACI 318-11). Farmington Hills, MI: American Concrete Institute.
Bazant, Z. P., & Thonguthai, W. (1979). Pore pressure in heated concrete walls: theoretical prediction. Magazine of Con-crete Research, 31(107), 67–76.
Beyea, S. D., Balcom, B. J., Bremner, T. W., Prado, P. J., Green, D. P., Armstrong, R. L., & Grattan-Bellew, P. E. (1998). Magnetic resonance imaging and moisture content profiles of drying concrete.Cement and Concrete Research, 28(3), 453–463.
Choi, J., Haj-Ali, R., & Kim, H. (2012). Integrated fire dynamic and thermomechanical modeling of a bridge under fire.
Structural Engineering and Mechanics, 42(6), 815–829. Consolazio, G. R., McVay, M. C., Rish, I. I. I., & J. W., (1998).
Measurement and prediction of pore pressures in saturated cement mortar subjected to radiant heating.ACI Structural Journal, 95(5), 525–536.
Crozier, D. A., & Sanjayan, J. G. (2000). Test of load-bearing slender reinforced concrete walls in fire. ACI Structural Journal, 97(2), 243–253.
Dwaikat, M. B., & Kodur, V. K. R. (2009). Hydrothermal model for predicting fire-induced spalling in concrete structural systems.Fire Safety Journal, 44(3), 425–434.
Eurocode 2. (2006). Design of concrete structure-part 1-2: General rules-structural fire design. BS EN 1992-1-2:2006. Hamarthy, T. A. (1965).Effect of moisture on the fire endurance
of building elements. West Conshohocken, PA: ASTM
Publication STP 385, American Society of Testing and Materials.
ISO 834–2012. (2012). ISO fire resistance test-elements of building construction, International Organization of Stan-dardization, Geneva, Switzerland.
Jansson, R. (2004). Measurement of thermal properties at ele-vated temperatures-Brandforsk project 328-031, SP Swed-ish National Testing and Research Institute.
KCI design recommendations. (2012). Concrete design code and commentary. Seoul, Korea: Korea Concrete Institute. (in Korean)
Khoylou, N. (1997). Modeling of moisture migration and spalling behavior in non-uniformly heated concrete, Ph.D. Thesis, Imperial College, UK.
Ko, J. W., Ryu, D. W., Lee, M. H., & Lee, S. H. (2007). Study on the behavior of microstructure and spalling mechanism by heat and moisture movement in concrete under fire environment.Journal of the Architectural Institute of Korea Structure & Construction, 23(12), 107–116. (in Korean) Kodur, V. K. R. (2014). Properties of concrete at elevated
temperatures, ISRN Civil engineering.
Kodur, V. K. R., Dwaikat, M. M. S., & Dwaikat, M. B. (2008). High-temperature properties of concrete for fire resistance modeling of structures. ACI Materials Journal, 105(5), 517–527.
Kodur, V. K. R., & Phan, L. (2007). Critical factors governing the fire performance of high strength concrete systems.Fire Safety Journal, 42(6), 482–488.
Lee, T.-G. (2009). Prediction of moisture migration of concrete including internal vaporization in fire. Journal of Korean Institute of Fire Science & Engineering, 13(5), 17–23. Lee, S., & Lee, C. (2013). Fire resistance of reinforced concrete
bearing walls subjected to all-sided fire exposure.Materials and Structures, 46(6), 943–957.
standard and hydrocarbon fires. ACI Structural Journal, 110(3), 503–510.
NIST. (1997). Spalling phenomena of HPC and OC.
O’Meagher, A. J., & Bennetts, I. D. (1991). Modeling of con-crete walls in fire.Fire Safety Journal, 17(4), 315–335. Regulation for refuge and prevention of fire in building, Korea
ministry of land, infrastructure and transport, 2015. (in Korean)
Schneider, U. (1982).Behaviour of concrete at high
tempera-tures, German committee for reinforced concrete (pp.
1–122). Berlin, Germany: Heft 377, Verlag, W. Ernst and Sohn.
Selih, J., Sousa, A. C. M., & Bremner, T. W. (1994). Moisture and heat flow in concrete walls exposed to fire. ASCE Journal of Engineering Mechanics, 120(10), 2028–2043. Szoke, S. S. (2006).Resistance to fire and high temperature(pp.