https://doi.org/10.5194/jsss-7-161-2018
© Author(s) 2018. This work is distributed under the Creative Commons Attribution 4.0 License.
In situ high-temperature gas sensors: continuous
monitoring of the combustion quality of different
wood combustion systems and optimization
of combustion process
Heinz Kohler1, Binayak Ojha1, Navas Illyaskutty1, Ingo Hartmann2, Christian Thiel2, Konrad Eisinger2, and Markus Dambacher3
1Institute for Sensor and Information Systems (ISIS), Hochschule Karlsruhe – Technik und Wirtschaft,
Moltkestr. 30, 76133 Karlsruhe, Germany
2DBFZ Deutsches Biomasseforschungszentrum gemeinnützige GmbH, Torgauer Straße 116,
04347 Leipzig, Germany
3Sick AG, Erwin-Sick-Straße 1, 79183 Waldkirch, Germany
Correspondence:Heinz Kohler (heinz.kohler@hs-karlsruhe.de)
Received: 29 September 2017 – Revised: 12 January 2018 – Accepted: 20 January 2018 – Published: 22 March 2018
Abstract. The sensing characteristics and long-term stability of different kinds of CO/HC gas sensors (non-Nernstian mixed potential type) during in situ operation in flue gas from different types of low-power combustion systems (wood-log- and wood-chip-fuelled) were investigated. The sensors showed representative but individual sensing behaviour with respect to characteristically varying flue gas composition over the combustion process. The long-term sensor signal stability evaluated by repeated exposure to CO/H2/N2/synthetic air mixtures showed no sensitivity loss after operation in the flue gas. Particularly for one of the sensors (Heraeus GmbH), this high signal stability was observed in a field test experiment even during continuous operation in the flue gas of the wood-chip firing system over 4 months. Furthermore, it was experimentally shown that the signals of these CO/HC sensing elements yield important additional information about the wood combustion process. This was demonstrated by the adaptation of an advanced combustion airstream control algorithm on a wood-log-fed fireplace and by the development of a combustion quality monitoring system for wood-chip-fed central heaters.
1 Introduction
Small-scale furnaces operated in domestic households, espe-cially wood-log-fuelled heating systems and also wood-chip-or pellet-fuelled central heaters, are well known to contribute considerably to air pollution with toxic emissions of un-combusted and/or partly un-combusted exhaust gas components (CO/HC) and particulate matter (PM) loaded with organics. Particularly in densely populated cities, villages and places where the exchange of environmental air is hindered by land-scape profile (e.g. location in a valley) or by temporary inver-sion situations in wintertime, these emisinver-sions might
accumu-late and can create high risk for human health (Tapanainen et al., 2011; Meyer, 2012).
val-ues in the last 5 years. From this point of view, it is obvi-ous that the emissions of low-power wood combustion sys-tems must be further reduced due to their significant con-tributions to environmental pollution. Our previous studies (Butschbach et al., 2009; Kohler et al., 2013a, b) have shown that firing process control can be further improved by op-timization of the airstream control algorithms based on the additional introduction of an in situ gas sensor operated in the flue gas for continuous measurement of CO/HC com-ponents like carbon monoxide (CO) or hydrocarbons like formaldehyde or methane (HC); this is called a CO/HC sen-sor. This results in a tremendous reduction of toxic gas emis-sions from wood-log-fuelled single-room fireplaces by up to 80 % (Ojha et al., 2017) compared to the emissions of hand-operated (conventional) single-room furnaces.
In addition, there is a high demand to monitor the combus-tion quality of automatically fed wood-chip-fuelled furnaces. The gaseous emissions of these furnaces are comparably low as long as the system is operated under optimized conditions. However, the continuous deposition of combustion residuals (ashes, soot, etc.) on the walls of the combustion chambers and heat exchanger tubes is known to have a negative influ-ence on the combustion process during long-term operation and can correspondingly seriously reduce combustion qual-ity (completeness of combustion) and efficiency (quotient of heat output to fuel heat input). This results in increased toxic gas and PM emissions. In this context, appropriate and re-liable CO/HC sensing will allow us to monitor the qual-ity of combustion (QC) continuously and will enable routine cleaning and maintenance actions on demand. Service on de-mand will reduce costs and emissions and will increase the utilization ratio, provided that appropriate and long-term sta-ble CO/HC sensor elements are available.
In this paper both aspects, improved process control of wood-log-fuelledfiring and continuous monitoring of wood-chip-fuelledheaters with respect to their QC by introduction of CO/HC sensors, are reported. In addition, the question of CO/HC sensor stability is discussed by comparing the sig-nals of different simultaneously operated CO/HC sensors in lab firing experiments and in a field test over several months.
2 Experiments
2.1 Set-ups for sensor tests in the flue gas of different wood combustion systems
Firing experiments have been conducted with a wood-log-fuelled furnace (SF10SK; Brunner GmbH, Eggen-felden, Germany) and two different wood-chip-fuelled cen-tral heaters (Multifuel Cencen-tral Heater; A.P. Bioenergietech-nik, Hirschau, Germany). One of the latter (heating power: 49 kW) was operated in the lab, and the other (heating power: 88 kW) was used to provide a small settlement of several houses with heat energy in field test experiments over nearly 4 months during the winter season 2016–2017. All furnaces
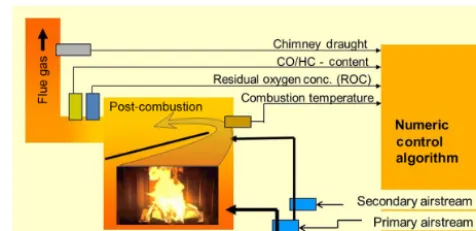
Figure 1.Schematic drawing of a wood-log-fuelled fireplace with indication of the primary and secondary combustion airstreams con-trolled by mass flow sensor–shutter systems (blue). The various sen-sor elements and their positions are depicted.
were complemented by a sensor (LSU 4.9; Bosch) for mea-surement of ROC and different types of CO/HC sensors, all positioned at the exhaust gas tube near the flue gas outlet of the firing system. The general concept of the construction of such furnaces with primary and secondary combustion zones and the position of the gas sensors is given as a schematic of a wood-log-fuelled fireplace in Fig. 1.
For comparative evaluation of the CO/HC sensors in the flue gas, a wood-log-fuelled fireplace (SF10SK) was addi-tionally complemented with sensors for combustion air mass stream measurement (HFM7; Bosch) and motor-driven shut-ters in both combustion airstream channels. The combustion airstreams were adjusted to desired flow, which is estimated by a novel control algorithm based onTc, ROC and CO/HC emissions as described in detail in Butschbach et al. (2009) and Kohler et al. (2013a). The calculated combustion air mass streams are adjusted by controlling the shutter posi-tion with a separate nested control algorithm in time intervals of 20 s based on air mass stream measurement. This enables the application of combustion airstream control systems to fireplaces with natural chimney draught as well, for which different draught conditions have to be expected depending, for instance, on the temperature of the chimney and on the outside air draught conditions estimated by the local weather situation. Before the sensor evaluation experiments could be started, the parameters of the algorithms for airstream con-trol had to be valuated first in iterative firing sequences to gain proper reproducible automated operation of the SF10SK fireplace.
ROC and CO/HC content in the exhaust gas and the com-bustion air mass streams. The software code for actual QC es-timation was developed on the software platform SOPAS ET (Sick AG, Reute), taking the mathematic correlations for the biomass combustion process into account (Sect. 3.3).
2.2 CO/HC sensors under investigation for flue gas analysis
The main focus of this work was to investigate the sensitivity and signal stability of different kinds of CO/HC gas sensors which were selected as interesting candidates for in situ oper-ation in the flue gas of low-power wood combustion systems. The availability of such long-term stable sensors at ambient temperatures in the range up to 500◦C is the prerequisite for establishing the above-mentioned new firing process control algorithms and a system for continuous QC monitoring.
Commercially available high-temperature (HT) gas sen-sors of the non-Nernstian mixed potential (MP) type have been investigated: CarboSen (CS) 1K and 10K (Lamtec GmbH & Co. KG, Walldorf) and a prototype sensor for CO/HC plus ROC measurement (HCS; Heraeus GmbH). The CO/HC sensing concept of both kinds of gas sensors is based on Au,Pt/YSZ/Pt electrochemical cells. The signal of these MP-type sensors cannot represent individual gas com-ponents but represents a value of the CO/HC content in the flue gas, whereby the relative sensitivity to individual gas components depends on the composition of the electrode ma-terial and operation temperature. An overview of the different sensor concepts for CO/HC monitoring in wood combus-tion exhaust gases, including different metal oxide gas sen-sors and MP-type sensen-sors, was already reported in Ojha et al. (2017). The basic measuring principle, set-up and specific properties of CS MP-type sensors are reported in Zhang et al. (2017) and details of the operation and signal generation of the HCS are described in Wienand et al. (2014).
The sensors are designed for in situ flue gas operation and are protected from particulate matter contamination by fil-ters. Generally, they are in contact with a multitude of gas components (majorly CO, CH4, Formaldehyde, alcohols, or-ganic acids, etc.; Marutzky and Seeger, 1999) which vary in concentration depending on the instant-of-firing situation (ignition phase, HT phase, which is steady state in the case of automated fuel feeding, burnout phase) and on the kind of wood used as fuel.
The CO/HC sensor performance was studied by in situ operation in the flue gas and simultaneously the flue gas com-position was analysed by extraction of a partial gas stream using a high-temperature FTIR gas analysis system (GAS-MET; Ansyco GmbH, Karlsruhe). This kind of referencing of gas composition allows for an analysis of all IR active components in time intervals of 10 s and may give valuable information about the individual dependence of the CO/HC sensor signal on the different flue gas components. However, the quantification of sensitivity and signal drifts during in situ
operation in the flue gas is not easily possible by referenc-ing the gaseous emissions because these are not well repro-ducible and vary considerably over time, as numerous differ-ent compondiffer-ents are emitted at a time (Marutzky and Seeger, 1999) and the MP signals of all CO/HC sensors under inves-tigation depend on the concentrations of many different com-ponents of the flue gas with different sensitivities (Ojha et al., 2017). For this reason, i.e. to get an independent valuation of the sensitivity and drift behaviour, the sensor elements were repeatedly calibrated in CO/H2(1 : 1)/O2/N2 model gas mixtures after certain times of operation in the exhaust gas according to the procedure described in Ojha et al. (2017). This allows for the measurement of CO/H2-equivalent con-centrations (CO/H2e) in the flue gas and enables the inves-tigation of the development of the signal stabilities during in situ operation in flue gases through the use of a standard gas mixing system (Jerger et al., 2002). Compared to COe values, which are well introduced for MP-type sensors, the CO/H2e values were clearly found to describe the real flue gas CO/HC composition better.
3 Results and discussion
3.1 Sensor behaviour over time during in situ operation in the flue gas
3.1.1 Flue gas monitoring of wood-chip-fuelled central heaters
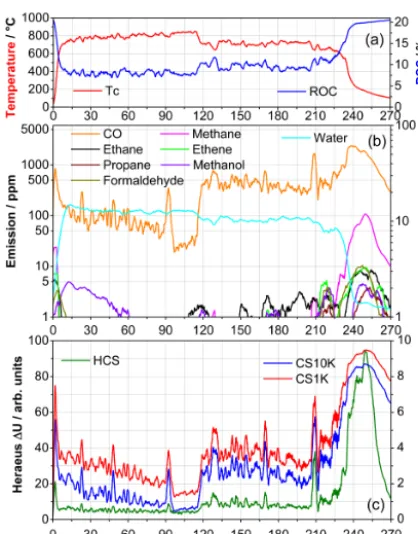
The CO/HC sensors under evaluation were operated in the flue gas of two wood-chip-fuelled central heaters of the same type (Sect. 2.1) for different experimental purposes. Combus-tion experiments were carried out in the lab over about 6 h a day. Between the firings the system was carefully cleaned to obtain reproducible combustion conditions. The signals of CS1K, CS10K and HCS over time of a typical test sequence are given in Fig. 2 together with theTc, the ROC and the anal-ysis of IR active flue gas components by quasi-continuous HT-FTIR analysis. After ignition, the system was operated at 70 % nominal power (NP) up to 120 min, then reduced to 50 % and the firing process was stopped at 225 min. Accord-ing to the given standard operation and control unit of the producer, operation at different heating power is set by differ-ent wood-chip feeding currdiffer-ents and correlated with differdiffer-ent
Tcand different concentrations of toxic gas emissions, espe-cially CO. Even a smallTcincrease atTc> 800◦C is reflected in a significant reduction of the ROC and CO concentration (c(CO)). Correspondingly, whenTcfell to about 700◦C (af-ter reduction of the NP to 50 %), c(CO) increased from less than 50 ppm to about 500 ppm.
Figure 2.Typical sequence of(a)combustion temperature (Tc) and residual oxygen concentration (ROC),(b)the continuous flue gas analysis (FTIR) and(c)the CO/HC sensor signals measured on the wood-chip-fuelled heater over time. The experiment started with cold ignition to steady-state operation at 70 % nominal power (NP), a subsequent change to 50 % NP at 120 min and after about 225 min the heater is operated down and stopped.
In contrast, the signals of the HCS are very low as long as the concentrations of the hydrocarbons are less than 5 ppm. Even to the stepwise rise in c(CO) after the change from 70 to 50 % NP, the sensor reacts only with a small but significant signal increase. This indicates that the signal of this type of MP gas sensor depends less on c(CO) and seems to be more estimated by the concentration of methane (c(CH4)) and per-haps other hydrocarbons, which is reflected in a steep signal increase when those components rise after the combustion was stopped. In this context the CarboSen sensors seem to be more sensitive. Even c(CO) values lower than about 50 ppm are clearly recorded.
Significantly higher emissions are observed when the heater is continuously operated in a mode for heating of a settlement (field test) over months and NP is repeatedly changed in small time intervals according to the heat demand and without any routine maintenance. Now emission peaks even higher than 1000 ppm CO (Fig. 3) are observed. The CO/H2e concentrations calculated for both types of sen-sors (from calibration data) follow quite well the course of c(CO) referenced by a standard portable CO analysis instru-ment (A600; Wöhler GmbH), but again, the signal response
Figure 3.Representative cut-out of the CO/H2e concentrations of a CS10K and an HCS, as calculated from the calibration data, reg-istered together with the CO concentrations after a 4-month opera-tion sequence of the multi-fuel wood-chip-fired central heater under field test conditions.
of the HCS is significantly lower. This confirms the inference above that this type of sensor is less sensitive to CO.
3.1.2 Flue gas monitoring of wood-log-fuelled fireplace
The sensor signals of another set of CO/HC sensors oper-ated during a representative batch experiment on the wood-log-fuelled fireplace are visualized in Fig. 4 together with the flue gas FTIR analysis, Tc and ROC. The automated combustion airstream control was conducted according to a novel control algorithm as introduced in Sect. 2.1. The experiment is based on independent combustion air mass stream control algorithms for primary and secondary com-bustion airstreams with separate control parameter valuation for the ignition phase (IP, 0–10 min), high-temperature com-bustion phase (HTCP, 10–50 min) and burnout phase (BOP, 50–150 min) as reported by Butschbach et al. (2009). During the HTCP the concentrations of emitted uncombusted com-ponents are very low (Fig. 4). However, there is no strong correlation ofTc, ROC and CO/HC emissions. For exam-ple, at the end of the IP the concentration of hydrocarbons (HCs) sharply decreases, Tc rises still beyond 700◦C and ROC continuously falls (Fig. 4), but c(CO) is more or less constant. Only beyond 20 min does c(CO) steeply fall to very low concentrations (Fig. 4). But even in the HTCP at tem-peratures between 750 and 800◦C there is no obvious cor-relation between CO/HC content and ROC. This example clearly demonstrates that the continuous independent mea-surement ofTc, ROC and CO/HC content is indispensable to enable optimized combustion by optimum airstream con-trol of wood-log-fuelled low-power fireplaces.
Figure 4. Course of(a)the combustion temperature (Tc) and the residual oxygen concentration (ROC),(b)the FTIR flue gas analysis and(c)the CO/HC sensor signals of CS10K and HCS in a typical wood-log combustion batch firing experiment.
organic gas components as well. The individual correlations of the signals with the flue gas components are still under investigation.
3.2 CO/HC sensor stability
The sensor signal stability was evaluated by re-peated sensor signal measurements under exposure to CO/H2(1 : 1)/O2/N2 model gases according to the procedure described in Sect. 2.2. An overview of the results is given in Fig. 5. Surprisingly, both types of sensors show increased sensitivity after in situ operation in the flue gas. After a 4-month field test period the sensor signals of the HCS were increased significantly at all oxygen concentra-tions (Fig. 5a). The sensitivity of the CS10K sensor element was clearly increased after the first three firing experiments and then seems to stabilize with further operation in the flue gas (Fig. 5b). In this context, it is important to report that in most cases the opposite trend (sensitivity loss) has been observed in the past and sometimes a sensitivity increase up to hours of operation in flue gas and a subsequent steep decrease in the sensitivity after further operation has been measured (Ojha et al., 2017). The reasons for these individ-ual behaviours are not yet well understood. It is assumed that different changes over time in the kinetics of the anodic
re-Figure 5.Evaluation of long-term stability by repeated sensor sig-nal measurements.(a)Sensor signals of HCS sensor before and af-ter 4 months of operation in the flue gas of a wood-chip central heater (field test) at different c(O2), and(b)CS10K signals in model gases with 7 % O2concentration before and after three, six and nine batch wood-log-fuelled firing experiments.
actions with the target gas components (CO, HC) compared to the cathodic reaction with the oxygen during operation in the flue gas seem to play an essential role related to drift behaviour. This is because MP is generated under conditions of balanced anodic and cathodic current conditions (Miura et al., 2014; Zhang et al., 2017). These aspects of signal change upon exposure to CO under different oxygen concentrations are systematically investigated by combined structural and electrochemical studies (Zhang et al., 2018).
3.3 Determination of actual combustion quality
wood-chip-fuelled central heater during real-life operation as described in Sect. 3.1.1, a detailed in-depth estimation of the actual QC and combustion efficiency could be demon-strated. Both values are important for continuous monitoring of the actual QC. For this purpose an algorithm was devel-oped based on the actual efficiency of combustion (quotient of heat output to fuel heat input), RHNo and the CO/H2e emissions. RHNo is defined as the quotient of actual heat output measured by the heat meter divided by NP given by the manufacturer, thus representing the actual load status of the furnace. The CO/H2e emissions were calculated from the HCS sensor signal. An overview of the data is given in Fig. 6. The bold horizontal yellow line represents the lower limit of proper QC (LPQC), which is set to 0.9. At QC val-ues lower than LPQC, proper operation is not supported and the system will give a service signal. The bold horizontal red line is defined as the limit of acceptable QC (LAQC), which is set to 0.6. At QC values lower than LAQC, the system will give a failure signal. The green curve (Fig. 6) represents the calculated QC, and in addition the course of the CO/H2e values referenced to ROC=13% (brown curve) is plotted.
If a malfunction, a failure or a shutdown of the furnace is recorded by the monitor system, the debug indicator (DI) is set to 1. Because DI=1 gives the status referred to as a mal-function of the furnace with no combustion process or very poor combustion quality, the determination of QC is not pos-sible or relevant. In this case (DI=1) the QC value is set to 1 because DI has a higher priority than QC; thus, DI is the only determinant parameter for failure analysis. If the value of DI is equal to 1, service or maintenance is necessary ex-cept in situations when the furnace is switched off. If DI=1 the monitor system will give a failure signal so that the op-erator can perform the required maintenance. Moreover, be-cause all parameters for the calculation of QC are recorded and related to a predefined value range of proper operation, the algorithm allows us to monitor the reason for malfunction and enables us to ascertain the service demand.
In Fig. 6 three segments with DI=1 are recorded. All seg-ments represent a shutdown or disabled combustion because the heat buffer tank was sufficiently loaded; this means there was no heat demand at these time segments.
Between the segments with DI=1 the wood-chip furnace was operated with a high heat output. Thus the RHNo was greater than 0.8 and, together with low CO/H2e values, this leads to a high combustion quality with QC > 0.9. In these segments the calculated CO/H2e signal from sensor HCS was most of the time lower than 200 mg m−3(13 % ROC). The CO/H2e limit above which the calculated QC is sig-nificantly decreased below 0.9 was set to 400 mg m−3(13 % ROC). This is the emission limit according to 1. BImSchV.
Figure 6.Example of the calculated quality of combustion (QC) in a wood-chip combustion unit with 88 kW of nominal heat output in field operation over a whole day in the winter season.
4 Conclusion and outlook
All CO/HC gas sensor elements under investigation are of the non-Nernstian mixed potential (MP) type and therefore cannot represent individual gas components. In a flue gas en-vironment the sensor signal is generated by all reactive gas components but at individual sensitivities depending on the MP electrode material. Therefore, the sensor signals repre-sent the flue gas composition and concentration in an in-dividual manner. In this context, all sensor elements under study are generally suitable for monitoring the quality of combustion (QC) and for the development of advanced soft-ware for control of the combustion airstreams to improve the QC and reduce the toxic gas emissions, especially for wood-log-fuelled firing systems. The signals of CS1K and CS10K sensor elements are well correlated with variations in CO emissions; however, the HCS sensor is more related to the variation in CH4.
Further comparative studies will give more insight into the long-term stability of the different types of sensors and their individual behaviours when operated in the flue gas. As a highlight, one of the sensor elements (HCS) showed no sig-nal loss even after a 4-month field test operation in the flue gas of a wood-chip combustion heater.
Data availability. A dataset supplementing Figs. 2, 3, 4, 5 and 6 is provided at https://doi.org/10.5281/zenodo.1189998 (Kohler et al., 2018).
Competing interests. The authors declare that they have no con-flict of interest.
Special issue statement. This article is part of the special issue “Sensor/IRS2 2017”. It is a result of the AMA Conferences, Nurem-berg, Germany, 30 May–1 June 2017.
Acknowledgements. This project was funded by the Bun-desministerium für Ernährung und Landwirtschaft (BMEL) and executed by the Fachagentur für Nachwachsende Rohstoffe (FNR), Gülzow.
Edited by: Jens Zosel
Reviewed by: two anonymous referees
References
Butschbach, P., Hammer, F., Kohler, H., Potreck, A., and Traut-mann, T.: Extensive reduction of toxic gas emissions of firewood-fueled low power fireplaces by improved in situ gas sensorics and catalytic treatment of the exhaust gas, Sensor. Actuat. B-Chem., 137, 32–41, 2009.
Jerger, A., Kohler, H., Becker, F., Keller, H. B., and Seifert, R.: New applications of tin oxide gas sensors – II. Intelligent sensor sys-tem for reliable monitoring of ammonia leakages, Sensor. Actuat. B-Chem., 81, 300–307, 2002.
Kohler, H., Brunner, S., Butschbach, P., and Glesing, D.: Sensorik und Abgas-Katalyse zur Reduktion der Emissio-nen von Klein-Holzfeuerungsanlagen, Konferenz “Energetische Biomassenutzung – Neue Technologien und Konzepte für die Bioenergie der Zukunft”, Berlin, 5. Nov. 2012, Konferenzband Energetische Biomassenutzung, S. 80, 2013a.
Kohler, H., Potreck, A., and Trautmann, T.: Verfahren und Vor-richtung zur Verbrennung von Brennstoffen, EP 2 066 972 B1, 2013b.
Kohler, H., Ojha, B., Illyaskutty, N., Hartmann, I., Thiel, C., Eisinger, K., and Dambacher, M.: Dataset supplementing Kohler et al., 2018, Zenodo, https://doi.org/10.5281/zenodo.1189998, 2018.
Marutzky, R. and Seeger, K.: Energie aus Holz und anderer Biomasse, DRW-Verlag, Leinfelden -Echterdingen, 1999. Meyer, N. K.: Particulate, black carbon and organic emissions from
small-scale residential wood combustion appliances in Switzer-land, Biomass Bioenerg., 36, 31–42, 2012.
Miura, N., Sato, T., Anggraini, S., Ikeda, H., and Zhuiykov, S.: A re-view of mixed-potential type zirconia-based gas sensors, Ionics, 20, 901–925, 2014.
Ojha, B., Illyaskutty, N., Knoblauch, J., Balachandran, M. R., and Kohler, H.: High-temperature CO/HC gas sensors to op-timize firewood combustion in low-power fireplaces, J. Sens. Sens. Syst., 6, 237–246, https://doi.org/10.5194/jsss-6-237-2017, 2017.
Tapanainen, M., Jalava, P. I., Mäki-Paakkanen, J., Hakulinen, P., Happo, M. S., Lamberg, H., Ruusunen, J., Tissari, J., Nuutinen, K., Yli-Pirilä, P., Hillamo, R., Salonen, R. O., Jokiniemi, J., and Hirvonen, M.-R.: In vitro immunotoxic and genotoxic activities of particles emitted from two different small-scale wood com-bustion appliances, Atmos. Environ., 45, 7546–7554, 2011. Wienand, K., Zinkevich, M., and Ullrich, K.-H.: Gassensor
zur Messung unterschiedlicher Gase und zugehöriges Herstel-lungsverfahren, WO2014, 198540, A1, 2014.
Zhang, X., Kohler, H., Schwotzer, M., and Guth, U.: Mixed-Potential Gas Sensor with Layered Au,Pt-YSZ Electrode: Inves-tigating the sensing mechanism with steady state and dynamic electrochemical methods, Sensor. Actuat. B-Chem., 252, 554– 560, 2017.